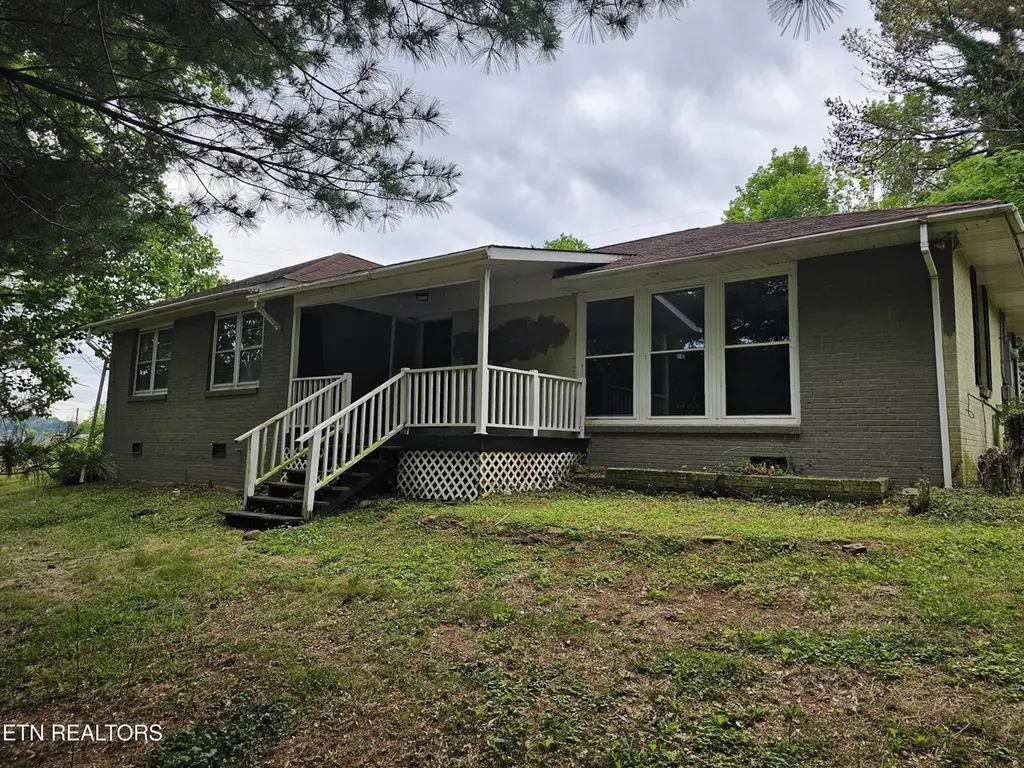
700 Lakeview Dr · Loudon, TN
Flood risk 1/10 · Minimal
- FEMA flood zone
- X (unshaded)
- Chance of flooding over 30 yrs
- 0.0%
- Est. flood insurance / yr
- $507 – $1,088
Fire risk 4/10 · Minor
- Est. fire insurance / yr
- $949 – $1,763
Heat risk 6/10 · Moderate
- Hot days now (above 105°F)
- 7 days/yr
- Hot days in 30 yrs
- 20 days/yr
Wind risk 2/10 · Minimal
- Chance of severe wind over 30 yrs
- 1.0%
Air-quality risk 3/10 · Minor
- Unhealthy air days now
- 2 days/yr
- Unhealthy air days in 30 yrs
- 2 days/yr
Risk factors via First Street. Map © Google.
Why this score? — see what drove the B+ grade
The composite is a weighted blend of 9 inputs, each scored 0–100. Each bar is that input's sub-score; the figure is the points it added to the 100-point composite (weight × sub-score).
- Cash flow +30.0/30.0
- ARV discount +15.0/15.0
- DSCR +10.0/10.0
- 1% rule +8.9/10.0
- Schools +3.2/10.0
- Livability +3.2/5.0
- Rent growth +2.5/5.0
- Condition / age +2.5/5.0
- Appreciation +0.0/10.0
$159,900
🖨 Deal sheet (PDF) 📄 Offer letter ✓ Due diligence
Listing remarks MLS
Cozy brick rancher, with 3 bedrooms and 2 full baths, plus an office with a total of 1615 sqft, this home has oak hardwood floors throughout. conviently located near and heart of downtown loudon and 20 miles west of Knoxville.
Key facts
- 0.47 acre lot
- Built 1956
- Listed 7 days
Property features AI
Exterior
- Parking: Off-street parking
- Utilities: Public sewer
- Home design: Detached property; Building area reported as 1,615 (per tax records)
- Construction: Brick construction
- Exterior features: Corner lot with level to rolling slope terrain; Country setting; Workshop on property
Interior
- Flooring: Hardwood
- Bathrooms: Two full bathrooms
- Heating & cooling: Natural gas heating; No central heating indicated; No central cooling indicated
- Interior features: Six total rooms; Hardwood flooring; Crawl space basement
Neighborhood map
What this means for you Summary
Snapshot
- This is a 3-bed/1.5-bath single-family listed at $160k.
Deal economics
- At list price, monthly cash flow is $765 ($9k/yr) — positive.
- The deal already cash-flows at list — no discount required.
- Meets the 1% rule at list price ($2k rent vs $160k).
- Cap rate 12.0% vs local median 4.3% in Loudon — top-decile yield for the area; either an underpriced asset or a hidden risk that comps aren't pricing in. Stress-test before assuming the spread holds.
Location & tenants
- Location reads 63/100 on livability (#190 in TN) — a middle-class / working-renter tenant base. Strengths: crime A+, cost of living A+, housing A+; Watch: employment D+, schools F, amenities F.
- Loudon County (rural): math 39% / reading 35% proficiency, ranked #18 of 139 in TN (top 13%) — families likely to look elsewhere, expect single-tenant / working-renter base with shorter leases.
- Market conditions: 436 active listings in the ZIP; 3 comparable units currently listed for rent nearby; rentals leasing fast (median 13d on market — plan ~1-2 weeks tenant-placement turnaround); solid renter incomes; 608 units permitted in Loudon County in 2024 (0 in 5+ unit buildings).
- This rent runs 30% of the median local income ($88k/yr) — at the standard rent-burdened threshold; future hikes will face affordability resistance.
Forward outlook
- Local home prices are declining (-3.0%/yr); year-one equity from $1k of loan paydown is wiped out by about $5k of value loss. Plan a longer hold.
- Loudon County population projected at +17% by 2050 — long-run rental-demand tailwind backs the buy-and-hold thesis.
- At projected returns (-3.0% appreciation + 3.0% rent growth), your $45k cash investment doubles in ~6 years — after that, you're playing with house money.
Negotiation context
- Only 7 days on market — expect competitive offers; lowballing is unlikely to land.
- 5 sale attempts since 19y ago with the ask held roughly flat each time — persistent listings suggest the price (not the market) is what's stuck; bring a comps-based counter.
- Current owner paid $114k; 40% above their basis — modest negotiation headroom, anchor on the comps not their cost.
Risks & watch-outs
- Watch-outs: built in 1956 — expect roof / HVAC / electrical / plumbing capex.
- Climate carrying-cost: extreme-heat days projected 7→20/yr by 2055 (HVAC capex compounding) — expect insurance premiums to compound above CPI over the hold.
Questions for the listing agent
- Built in 1956 — when were the roof, HVAC, electrical panel, plumbing, and water heater last replaced?
- Is there a deadline driving the sale (1031 exchange, divorce, estate, relocation)? That informs how much negotiation room exists.
- Schools are F-rated, which usually means shorter tenancies and higher turnover. Who's the typical renter profile here, and what's been the actual vacancy rate?
- What's the average days-on-market for RENTAL listings here right now (not sales)? A rising rental-DOM trend means longer vacancies and softer asking-rent achievability than the comps imply.
- What's the recent tenant-quality profile in this submarket — average credit score on applications, eviction rate, late-payment / NSF rate, and stable-employment percentage? A property-management company in the area should have these aggregated.
- How much new for-sale + rental construction is in the pipeline within 1–3 miles? Heavy new supply typically softens prices + rents 12–24 months out; constrained supply supports both.
Investment metrics
- 1% rule
- 1.39% ✓
- Cap rate
- 12.04%
- Cash-on-cash
- 20.51%
- DSCR
- 1.91
- GRM
- 6.0
CMA / ARV
- ARV (on-the-fly)
- $251,940
- Comps found
- 11
Show comp detail 11 sales within ~0.75 mi
| Address | Dist | Beds/Ba | Sqft | Sold | Price | $/sf | Match |
|---|---|---|---|---|---|---|---|
| 802 Arden St | 0.13mi | 3/2.0 | 1,680 (+4%) | 2mo | $234,900 | $140 | 83 |
| 431 Mason Ln | 0.30mi | 3/2.0 | 1,584 (-2%) | 11mo | $235,000 | $148 | 72 |
| 911 Summer St | 0.35mi | 3/2.0 | 1,475 (-9%) | 3mo | $215,000 | $146 | 64 |
| 509 Wharf St | 0.45mi | 3/2.0 | 1,660 (+3%) | 10mo | $275,000 | $166 | 64 |
| 20 Webster Ct | 0.22mi | 2/1.0 (-1) | 1,374 (-15%) | 5mo | $290,000 | $211 | 53 |
| 104 Huffs Ferry Rd S | 0.38mi | 3/2.0 | 1,445 (-10%) | 14mo | $275,000 | $190 | 52 |
| 709 Cedar St | 0.34mi | 3/1.0 | 1,440 (-11%) | 15mo | $225,000 | $156 | 52 |
| 703 Church St | 0.41mi | 3/2.0 | 1,400 (-13%) | 8mo | $190,000 | $136 | 50 |
| 400 Church St | 0.60mi | 3/2.5 | 1,729 (+7%) | 16mo | $150,000 | $87 | 43 |
| 633 River Rd | 0.75mi | 3/2.0 | 1,732 (+7%) | 12mo | $353,000 | $204 | 41 |
| 503 Ferry St | 0.60mi | 3/2.0 | 1,446 (-10%) | 22mo | $300,000 | $207 | 34 |
Match score weights: distance 35% · size 25% · config 20% · recency 20%. Top-matched comps best support the ARV.
Projected returns pro-forma
-3.0% appreciation · 3.0% rent growth · sell at horizon
- IRR
- 12.8%
- Equity multiple
- 1.51×
- Total profit
- $22,798
- Equity at exit
- $23,842
- IRR
- 21.7%
- Equity multiple
- 2.84×
- Total profit
- $82,461
- Equity at exit
- $13,825
Cash invested: $44,772 (down + closing). Projections, not guarantees.
Landlord ↔ Tenant lean methodology
- Overall (STATE)
- 87 Strongly Landlord-Friendly
- State Tennessee
- 87 Strongly Landlord-Friendly · R+13
- County
- — inherits STATE
- City
- — inherits STATE
ZIP-level market 37774
- Home prices YoY
- -12.8%
- Active inventory
- 436
- Price-to-rent
- 6.0×
Monthly cashflow live
- Estimated rent
- $2,216 medium interval (Pro) →
- Mortgage (P&I)
- −$839
- Tax from tax record
- −$80 /mo · $959/yr
- Insurance
- −$67
- HOA
- −$0
- Vacancy / Maint / Mgmt
- −$465
- Net cashflow
- $765
Break-even live
Sensitivity live
| Price | -10% $856 | -5% $811 | +0% $765 | +5% $720 | +10% $675 |
|---|---|---|---|---|---|
| Rent | -10% $590 | -5% $678 | +0% $765 | +5% $853 | +10% $940 |
| Rate | -1.0pp $846 | -0.5pp $806 | base $765 | +0.5pp $724 | +1.0pp $682 |
UW: 25.0% down · 7.5% · 30yr · 1.5% tax · 5.0% vac · 8.0% maint · 8.0% mgmt
Financing live
Cash to close
- Down payment
- $39,975
- Closing costs
- $4,797
- Reserves months
- —
- Total cash needed
- —
Loan-product check · same deal, 3 products live
Conventional
25% down · 7.5% · 30yr
- Down + closing
- —
- Monthly P&I
- —
- Monthly cashflow
- —
- DSCR
- —
- Eligible?
- —
Personal DTI + credit; lowest rate.
DSCR
20% down · 8.5% · 30yr
- Down + closing
- —
- Monthly P&I
- —
- Monthly cashflow
- —
- DSCR
- —
- Eligible?
- —
No personal income docs; deal must DSCR.
Hard money
10% down · 12.0% · 12mo
- Down + closing
- —
- Monthly P&I
- —
- Monthly cashflow
- —
- DSCR
- —
- Eligible?
- —
Short-term bridge; refi at stabilization.
Rent comps 3 comps
| Address | Beds | Baths | Sqft | Rent | $/sqft | DOM | Units | Dist |
|---|---|---|---|---|---|---|---|---|
| 211 Waller St Loudon, TN | 3.0 | 1.5 | 1686 | $1,600 | $0.95 | 12d | 1 | 0.56mi |
| 1060 Mulberry St Loudon, TN | 2.0 | 1.5 | 1204 | $1,800 | $1.50 | 12d | 1 | 1.02mi |
| 120 Stone Gate Cir Loudon, TN | 2.0 | 2.5 | 1200 | $1,750 | $1.46 | 12d | 6 | 1.27mi |
Listing history 17 events
-
2026-06-05status $159,900 Pending 7 DOM
-
2026-06-03days on market $159,900 Active 7 DOM
-
2026-06-02days on market $159,900 Active 6 DOM
-
2026-06-01days on market $159,900 Active 5 DOM
-
2026-05-31days on market $159,900 Active 4 DOM
-
2026-05-31days on market $159,900 Active 3 DOM
-
2026-05-27$159,900 Active
-
2015-06-22soldstatus $114,000
-
2015-06-16historical 226-char remark
Show marketing remark (226 chars)
Cozy brick rancher, with 3 bedrooms and 2 full baths, plus an office with a total of 1615 sqft, this home has oak hardwood floors throughout. conviently located near and heart of downtown loudon and 20 miles west of Knoxville.
-
2015-06-15soldstatus $114,000 Closed 226-char remark
Show marketing remark (226 chars)
Cozy brick rancher, with 3 bedrooms and 2 full baths, plus an office with a total of 1615 sqft, this home has oak hardwood floors throughout. conviently located near and heart of downtown loudon and 20 miles west of Knoxville.
-
2015-05-25historical Pending - Continue to Show 226-char remark
Show marketing remark (226 chars)
Cozy brick rancher, with 3 bedrooms and 2 full baths, plus an office with a total of 1615 sqft, this home has oak hardwood floors throughout. conviently located near and heart of downtown loudon and 20 miles west of Knoxville.
-
2015-03-23$119,000 Active 226-char remark
Show marketing remark (226 chars)
Cozy brick rancher, with 3 bedrooms and 2 full baths, plus an office with a total of 1615 sqft, this home has oak hardwood floors throughout. conviently located near and heart of downtown loudon and 20 miles west of Knoxville.
-
2015-03-23price $114,000 226-char remark
Show marketing remark (226 chars)
Cozy brick rancher, with 3 bedrooms and 2 full baths, plus an office with a total of 1615 sqft, this home has oak hardwood floors throughout. conviently located near and heart of downtown loudon and 20 miles west of Knoxville.
-
2009-07-01$122,900
-
2008-11-30$139,900
-
2007-12-12soldstatus $112,000
-
2007-04-25$125,900
ⓘ Source: listings_history table (triggers on properties + properties_extension) + one-shot
backfill from property_details.listing_events for pre-trigger history.
Tax reassessment forecast TN · Resets to sale price
- Current annual tax
- $959 · $80/mo
- Projected year-2 tax
- $1,135 · $95/mo
- Expected delta
- +$177/yr (+$15/mo · 18.4%)
ⓘ Screening estimate from a state-policy table — verify with the county assessor before closing.
Climate risk First Street
- Flood 1/10 Low FEMA zone X (unshaded) · 0% chance over 30 yrs
- Wildfire 4/10 Moderate
- Heat 6/10 Major 7 d/yr ≥105°F today · 20 d/yr by 30 yrs out
- Wind 2/10 Low 100% chance of damaging wind over 30 yrs
- Air quality 3/10 Moderate 2 unhealthy d/yr today · 2 by 30 yrs out
Nearby sold comps map
Loading sold comps map…
Walkable amenities ~0.75 mi
Loading nearby amenities…
Taxation est. · year 1
- Rental income
- $26,589
- − Mortgage interest
- −$8,957
- − Property taxes
- −$959
- − Insurance
- −$800
- − Repairs & maintenance
- −$2,127
- − Management
- −$2,127
- − Depreciation
- −$4,652
- Taxable income
- $6,968
- Est. tax owed @ 24.0%
- −$1,672
- After-tax cash flow
- $7,512/yr
For passive investors: Depreciation is non-cash, so a rental often shows a tax loss while cash-flowing — sheltering income. Rental losses are passive: they offset passive income freely, and up to $25,000/yr can offset ordinary (W-2) income if you actively participate and your MAGI is under $100k (phasing out to $0 by $150k); unused losses carry forward. On sale, claimed depreciation is recaptured at up to 25%, and gains may owe capital-gains tax (a 1031 exchange can defer both). Figures are a year-1 estimate at your 24.0% rate — not tax advice; consult a CPA.
Schools (NCES district)
- District
- Loudon County
- NCES district ID
- 4702520
- Math proficiency
- 39% ▼ -13.00%
- Reading proficiency
- 35% ▼ -4.00%
- Median HH income
- $54,201
- Composite
- 32.43/100
- National rank
- #5724
- State rank
- #18 of 139 in TN
Livability — Loudon
- Score
- 63/100
- State rank
- #190
- US rank
- #15214
Category grades
Schools grade is shown separately in the Schools card above.
Census & demographics
- Census place
- Loudon, TN
- County
- Loudon County · 54,472 people
- City population
- 21,784
- Metro
- Knoxville, TN
- Population (ZIP)
- 21,784
- Household income
- $87,718
- Rent vs Own
- Severe rent burden
- 200.0
Population outlook (Loudon County) Hauer SSP2
- Today (2025)
- 55,364 people
- By 2030
- 57,414 · +3.7%
- By 2040
- 61,216 · +10.6%
- By 2050
- 64,846 · +17.1%
- By 2075
- 75,829 · +37.0%
- By 2100
- 85,693 · +54.8%
Race, ethnicity, and origin ACS 2023
- Neighborhood character
- Predominantly White (87%)
- Race & ethnicity
- White 87% Hispanic / Latino 9% Two or more races 6% Asian 2% Black 1%
- Hispanic origin (detail)
- Mexican 6%
- Common ancestry
- Serbian 3% Romanian 2% Slovak 2%
- Foreign-born
- 7% · Canada
- Languages at home
- 93% English-only · Spanish 6%
Political lean MEDSL · Loudon
- 2024 margin
- Solid R (+53.0) · D 23.0% · R 76.0% · Other 1.1%
- 2008→2024 swing
- -9.0pp toward R · 2008: -44.0pp · 2024: -53.0pp
- All cycles
- 2024: R+53.0 2020: R+50.3 2016: R+54.4 2012: R+52.8 2008: R+44.0
Not yet ingested
- Civics
- —
Market trends
- HPI YoY
- ▼ -47.04%
- Current HPI
- 320.0874
- Rent YoY
- —
- Metro
- Knoxville, TN
- State GDP YoY
- ▲ 2.78%
- F500 in state
- 22
Industry mix (Fortune 500 HQ in TN)
| Industry | F500 HQs | Revenue |
|---|---|---|
| Healthcare | 3 | $91B |
|
||
| Retail | 3 | $72B |
|
||
| Transportation / Logistics | 1 | $88B |
|
||
| Paper / Packaging | 1 | $19B |
|
||
| Insurance | 1 | $13B |
|
||
| Energy | 1 | $12B |
|
||
Price history
+27.0% since first listed11 events — show timeline
- 2026-05-27 Listed $159,900 Knoxville MLS
- 2015-06-22 Sold (Public Records) $114,000 Public Records
- 2015-06-16 Listing Removed — Knoxville MLS
- 2015-06-15 Sold (MLS) $114,000 Knoxville MLS
- 2015-05-25 Contingent — Knoxville MLS
- 2015-03-23 Listed $119,000 Knoxville MLS
- 2015-03-23 Price Changed $114,000 Knoxville MLS
- 2009-07-01 Listed $122,900 Knoxville MLS
- 2008-11-30 Listed $139,900 Knoxville MLS
- 2007-12-12 Sold (Public Records) $112,000 Public Records
- 2007-04-25 Listed $125,900 Knoxville MLS
Property tax history
+1.1%/yrLatest (2025): $959 · +0.0% YoY. Source: county tax records.
Cash-flow waterfall
monthlySold comps — $/sqft
last 12 mo · ≤1 miLoading sold comps…