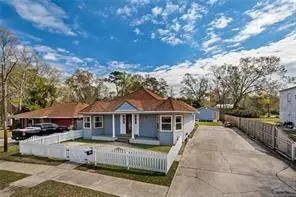
2596 4th St · Slidell, LA
Flood risk No data
- FEMA flood zone
- —
- Chance of flooding over 30 yrs
- —
- Est. flood insurance / yr
- —
Fire risk No data
- Est. fire insurance / yr
- —
Heat risk No data
- Hot days now (above threshold)
- —
- Hot days in 30 yrs
- —
Wind risk No data
- Chance of severe wind over 30 yrs
- —
Air-quality risk No data
- Unhealthy air days now
- —
- Unhealthy air days in 30 yrs
- —
Risk factors via First Street. Map © Google.
Why this score? — see what drove the B grade
The composite is a weighted blend of 9 inputs, each scored 0–100. Each bar is that input's sub-score; the figure is the points it added to the 100-point composite (weight × sub-score).
- Cash flow +26.4/30.0
- ARV discount +15.0/15.0
- DSCR +9.0/10.0
- 1% rule +7.2/10.0
- Schools +4.3/10.0
- Livability +3.5/5.0
- Rent growth +2.9/5.0
- Condition / age +2.5/5.0
- Appreciation +0.0/10.0
$214,900
🖨 Deal sheet (PDF) 📄 Offer letter ✓ Due diligence
Listing remarks MLS
Charming 4-Bedroom Home in the Heart of the Preservation District! This spacious 2,977 sq ft home sits on a generous . 3-acre lot and offers 4 bedrooms, including an oversized primary suite, along with 2 full bathrooms and a half bath. Located in desirable Old Towne Slidell, this home boasts a welcoming white picket fence, off-street parking, and plenty of unexpected features that you truly must see in person to fully appreciate. With its combination of size, location, and value, this property stands out as one of the best deals in Old Towne Slidell. Don’t miss your opportunity to own this charming home in the sought-after Preservation District!
Key facts
- Generous lot
- Off-street parking
- 0.31 acre lot
Tags
Neighborhood map
What this means for you Summary
Snapshot
- This is a 4-bed/2.5-bath single-family listed at $215k.
Deal economics
- At list price, monthly cash flow is $559 ($7k/yr) — positive.
- The deal already cash-flows at list — no discount required.
- Meets the 1% rule at list price ($3k rent vs $215k).
- Recommended offer: $189k (12.0% below list) — sets the bar for market timing.
- Cap rate 9.4% vs local median 5.9% in Slidell — top-decile yield for the area; either an underpriced asset or a hidden risk that comps aren't pricing in. Stress-test before assuming the spread holds.
Location & tenants
- Location reads 70/100 on livability (#57 in LA) — a middle-class / working-renter tenant base. Strengths: cost of living A+, housing A+, health & safety A+; Watch: amenities F, commute F.
- St. Tammany Parish (suburban): math 43% / reading 55% proficiency, ranked #11 of 98 in LA (top 11%) — families likely to look elsewhere, expect single-tenant / working-renter base with shorter leases.
- Market conditions: Rents rising (+1.5%/yr); 489 active listings in the ZIP; 1 comparable units currently listed for rent nearby; 1,064 units permitted in St. Tammany Parish in 2024 (0 in 5+ unit buildings).
- This rent runs 43% of the median local income ($73k/yr) — at the standard rent-burdened threshold; future hikes will face affordability resistance.
Forward outlook
- Local home prices are declining (-3.0%/yr); year-one equity from $1k of loan paydown is wiped out by about $6k of value loss. Plan a longer hold.
- St. Tammany County population projected at +27% by 2050 — long-run rental-demand tailwind backs the buy-and-hold thesis.
Negotiation context
- It's been on market 328 days — a 12% lower offer ($189k) is reasonable based on typical stale-listing flexibility.
- 8 sale attempts since 8y ago with the ask held roughly flat each time — persistent listings suggest the price (not the market) is what's stuck; bring a comps-based counter.
- Current owner paid $174k; 24% above their basis — modest negotiation headroom, anchor on the comps not their cost.
Questions for the listing agent
- It's been on market 328 days. Have you received any prior offers? Is the seller open to a 12% concession, seller financing, or rate buy-down credit?
- Built in 1965 — when were the roof, HVAC, electrical panel, plumbing, and water heater last replaced?
- Why hasn't it sold? Are there any deal-killer items the seller is aware of (foundation, flood, title, zoning, code violations)?
- Is there a deadline driving the sale (1031 exchange, divorce, estate, relocation)? That informs how much negotiation room exists.
- Schools are B-rated — typically a magnet for longer-tenancy family renters. What's the average tenant stay here, and is there a school-zone premium baked into asking?
- What's the average days-on-market for RENTAL listings here right now (not sales)? A rising rental-DOM trend means longer vacancies and softer asking-rent achievability than the comps imply.
- What's the recent tenant-quality profile in this submarket — average credit score on applications, eviction rate, late-payment / NSF rate, and stable-employment percentage? A property-management company in the area should have these aggregated.
- How much new for-sale + rental construction is in the pipeline within 1–3 miles? Heavy new supply typically softens prices + rents 12–24 months out; constrained supply supports both.
Investment metrics
- 1% rule
- 1.22% ✓
- Cap rate
- 9.41%
- Cash-on-cash
- 11.15%
- DSCR
- 1.50
- GRM
- 6.9
CMA / ARV
- ARV (median comp)
- $312,799
- List price
- $214,900
- Delta
- -31.30%
- Verdict
- UNDERPRICED
- Comps
- 20 within 1.0 mi
Show comp detail 3 sales within ~0.75 mi
| Address | Dist | Beds/Ba | Sqft | Sold | Price | $/sf | Match |
|---|---|---|---|---|---|---|---|
| 700 Dewey Ave | 0.26mi | 4/3.0 | 3,291 (+10%) | 6mo | $312,000 | $95 | 63 |
| 2613 Carey St | 0.32mi | 4/3.0 | 2,849 (-4%) | 16mo | $375,000 | $132 | 62 |
| 534 Teddy Ave | 0.69mi | 4/3.5 | 3,081 (+4%) | 24mo | $440,000 | $143 | 38 |
Match score weights: distance 35% · size 25% · config 20% · recency 20%. Top-matched comps best support the ARV.
Projected returns pro-forma
-3.0% appreciation · 1.47% rent growth · sell at horizon
- IRR
- -1.4%
- Equity multiple
- 0.95×
- Total profit
- $-3,126
- Equity at exit
- $32,042
- IRR
- 6.6%
- Equity multiple
- 1.46×
- Total profit
- $27,571
- Equity at exit
- $18,581
Cash invested: $60,172 (down + closing). Projections, not guarantees.
Landlord ↔ Tenant lean methodology
- Overall (STATE)
- 90 Strongly Landlord-Friendly
- State Louisiana
- 90 Strongly Landlord-Friendly · R+12
- County
- — inherits STATE
- City
- — inherits STATE
ZIP-level market 70458
- Rents YoY
- 1.5%
- Active inventory
- 489
- Price-to-rent
- 6.9×
Monthly cashflow live
- Estimated rent
- $2,613 medium interval (Pro) →
- Mortgage (P&I)
- −$1,127
- Tax from tax record
- −$289 /mo · $3,468/yr
- Insurance
- −$90
- HOA
- −$0
- Vacancy / Maint / Mgmt
- −$549
- Net cashflow
- $559
Break-even live
Sensitivity live
| Price | -10% $681 | -5% $620 | +0% $559 | +5% $498 | +10% $437 |
|---|---|---|---|---|---|
| Rent | -10% $353 | -5% $456 | +0% $559 | +5% $662 | +10% $766 |
| Rate | -1.0pp $667 | -0.5pp $614 | base $559 | +0.5pp $503 | +1.0pp $447 |
UW: 25.0% down · 7.5% · 30yr · 1.5% tax · 5.0% vac · 8.0% maint · 8.0% mgmt
Financing live
Cash to close
- Down payment
- $53,725
- Closing costs
- $6,447
- Reserves months
- —
- Total cash needed
- —
Loan-product check · same deal, 3 products live
Conventional
25% down · 7.5% · 30yr
- Down + closing
- —
- Monthly P&I
- —
- Monthly cashflow
- —
- DSCR
- —
- Eligible?
- —
Personal DTI + credit; lowest rate.
DSCR
20% down · 8.5% · 30yr
- Down + closing
- —
- Monthly P&I
- —
- Monthly cashflow
- —
- DSCR
- —
- Eligible?
- —
No personal income docs; deal must DSCR.
Hard money
10% down · 12.0% · 12mo
- Down + closing
- —
- Monthly P&I
- —
- Monthly cashflow
- —
- DSCR
- —
- Eligible?
- —
Short-term bridge; refi at stabilization.
Rent comps 1 comps
| Address | Beds | Baths | Sqft | Rent | $/sqft | DOM | Units | Dist |
|---|---|---|---|---|---|---|---|---|
| 3106 Little Pl Slidell, LA | 3.0 | 3.0 | 3000 | $4,900 | $1.63 | 4d | 1 | 1.43mi |
Listing history 36 events
-
2026-06-21days on market $214,900 Active 328 DOM
-
2026-06-18days on market $214,900 Active 325 DOM
-
2026-06-17days on market $214,900 Active 324 DOM
-
2026-06-16days on market $214,900 Active 323 DOM
-
2026-06-15days on market $214,900 Active 322 DOM
-
2026-06-13days on market $214,900 Active 320 DOM
-
2026-06-10days on market $214,900 Active 317 DOM
-
2026-06-09days on market $214,900 Active 316 DOM
-
2026-06-08days on market $214,900 Active 315 DOM
-
2026-06-07days on market $214,900 Active 314 DOM
-
2026-06-03days on market $214,900 Active 310 DOM
-
2026-06-02days on market $214,900 Active 309 DOM
-
2026-06-01days on market $214,900 Active 308 DOM
-
2026-05-31days on market $214,900 Active 307 DOM
-
2025-07-20$214,900 Active 659-char remark
Show marketing remark (652 chars)
Charming 4-Bedroom Home in the Heart of the Preservation District! This spacious 2,977 sq ft home sits on a generous .3-acre lot and offers 4 bedrooms, including an oversized primary suite, along with 2 full bathrooms and a half bath. Located in desirable Old Towne Slidell, this home boasts a welcoming white picket fence, off-street parking, and plenty of unexpected features that you truly must see in person to fully appreciate. With its combination of size, location, and value, this property stands out as one of the best deals in Old Towne Slidell. Don't miss your opportunity to own this charming home in the sought-after Preservation District!
-
2025-07-20$214,900 Active 652-char remark
Show marketing remark (652 chars)
Charming 4-Bedroom Home in the Heart of the Preservation District! This spacious 2,977 sq ft home sits on a generous .3-acre lot and offers 4 bedrooms, including an oversized primary suite, along with 2 full bathrooms and a half bath. Located in desirable Old Towne Slidell, this home boasts a welcoming white picket fence, off-street parking, and plenty of unexpected features that you truly must see in person to fully appreciate. With its combination of size, location, and value, this property stands out as one of the best deals in Old Towne Slidell. Don't miss your opportunity to own this charming home in the sought-after Preservation District!
-
2019-08-14soldstatus $173,500
-
2019-08-09soldstatus $173,500 Closed
-
2019-06-25status Pending
-
2019-06-14status Active
-
2019-03-29status Pending
-
2019-03-18$173,500
-
2019-03-18$173,500 Active
-
2018-11-26price $173,500
-
2018-10-15price $185,000
-
2018-10-02price $195,000
-
2018-09-20price $200,000
-
2018-09-18$173,500
-
2018-07-09soldstatus $160,000
-
2018-07-06soldstatus $160,000 Sold
-
2018-06-12historical Pending Continue to Show
-
2018-05-29price $160,000
-
2018-05-04price $195,900
-
2018-04-12price $234,900
-
2018-03-08$250,000 Active
-
2018-03-08$160,000
ⓘ Source: listings_history table (triggers on properties + properties_extension) + one-shot
backfill from property_details.listing_events for pre-trigger history.
Tax reassessment forecast LA · Resets to sale price
- Current annual tax
- $3,468 · $289/mo
- Projected year-2 tax
- $3,468 · $289/mo
- Expected delta
- $0/yr ($0/mo · 0.0%)
ⓘ Screening estimate from a state-policy table — verify with the county assessor before closing.
Nearby sold comps map
Loading sold comps map…
Walkable amenities ~0.75 mi
Loading nearby amenities…
Taxation est. · year 1
- Rental income
- $31,361
- − Mortgage interest
- −$12,038
- − Property taxes
- −$3,468
- − Insurance
- −$1,074
- − Repairs & maintenance
- −$2,509
- − Management
- −$2,509
- − Depreciation
- −$6,252
- Taxable income
- $3,511
- Est. tax owed @ 24.0%
- −$843
- After-tax cash flow
- $5,866/yr
For passive investors: Depreciation is non-cash, so a rental often shows a tax loss while cash-flowing — sheltering income. Rental losses are passive: they offset passive income freely, and up to $25,000/yr can offset ordinary (W-2) income if you actively participate and your MAGI is under $100k (phasing out to $0 by $150k); unused losses carry forward. On sale, claimed depreciation is recaptured at up to 25%, and gains may owe capital-gains tax (a 1031 exchange can defer both). Figures are a year-1 estimate at your 24.0% rate — not tax advice; consult a CPA.
Schools (NCES district)
- District
- St. Tammany Parish
- NCES district ID
- 2201650
- Math proficiency
- 43% ▼ -32.00%
- Reading proficiency
- 55% ▼ -26.00%
- Median HH income
- $61,752
- Composite
- 43.04/100
- National rank
- #3098
- State rank
- #11 of 98 in LA
Livability — Slidell
- Score
- 70/100
- State rank
- #57
- US rank
- #7673
Category grades
Schools grade is shown separately in the Schools card above.
Census & demographics
- Census place
- Slidell, LA
- County
- Saint Tammany Parish · 228,296 people
- City population
- 95,511
- Metro
- New Orleans-Metairie, LA
- Population (ZIP)
- 39,034
- Household income
- $72,843
- Rent vs Own
- Severe rent burden
- 1331.0
Population outlook (St. Tammany County) Hauer SSP2
- Today (2025)
- 286,725 people
- By 2030
- 304,175 · +6.1%
- By 2040
- 336,203 · +17.3%
- By 2050
- 364,590 · +27.2%
- By 2075
- 433,362 · +51.1%
- By 2100
- 470,333 · +64.0%
Race, ethnicity, and origin ACS 2023
- Neighborhood character
- Predominantly White (66%)
- Race & ethnicity
- White 66% Black 17% Two or more races 10% Hispanic / Latino 9% Native American 2% Asian 1%
- Hispanic origin (detail)
- Mexican 3% Puerto Rican 1%
- Common ancestry
- Lithuanian 15% Slovak 2% Romanian 1%
- Foreign-born
- 3% · Canada, Vietnam
- Languages at home
- 93% English-only · Spanish 5% Vietnamese 1%
Political lean MEDSL · St. Tammany
- 2024 margin
- Solid R (+43.8) · D 27.3% · R 71.1% · Other 1.6%
- 2008→2024 swing
- +9.6pp toward D · 2008: -53.4pp · 2024: -43.8pp
- All cycles
- 2024: R+43.8 2020: R+44.2 2016: R+50.8 2012: R+52.2 2008: R+53.4
Not yet ingested
- Civics
- —
Market trends
- HPI YoY
- ▼ -173.60%
- Current HPI
- 147.4749
- Rent YoY
- ▲ 1.47%
- Metro
- New Orleans-Metairie, LA
- State GDP YoY
- ▲ 3.29%
- F500 in state
- 10
Industry mix (Fortune 500 HQ in LA)
| Industry | F500 HQs | Revenue |
|---|---|---|
| Telecommunications | 2 | $23B |
|
||
| Utilities | 1 | $12B |
|
||
| Wholesale / Distribution | 1 | $5B |
|
||
| Advertising | 1 | $2B |
|
||
Price history
-14.0% since first listed22 events — show timeline
- 2025-07-20 Listed $214,900 AcadianaMLS
- 2025-07-20 Listed $214,900 GSREIN
- 2019-08-14 Sold (Public Records) $173,500 Public Records
- 2019-08-09 Sold (MLS) $173,500 GSREIN
- 2019-06-25 Pending — GSREIN
- 2019-06-14 Relisted — GSREIN
- 2019-03-29 Pending — GSREIN
- 2019-03-18 Listed $173,500 GSREIN
- 2019-03-18 Listed $173,500 AcadianaMLS
- 2018-11-26 Price Changed $173,500 GSREIN
- 2018-10-15 Price Changed $185,000 GSREIN
- 2018-10-02 Price Changed $195,000 GSREIN
- 2018-09-20 Price Changed $200,000 GSREIN
- 2018-09-18 Listed $173,500 AcadianaMLS
- 2018-07-09 Sold (Public Records) $160,000 Public Records
- 2018-07-06 Sold (MLS) $160,000 GSREIN
- 2018-06-12 Contingent — GSREIN
- 2018-05-29 Price Changed $160,000 GSREIN
- 2018-05-04 Price Changed $195,900 GSREIN
- 2018-04-12 Price Changed $234,900 GSREIN
- 2018-03-08 Listed $160,000 AcadianaMLS
- 2018-03-08 Listed $250,000 GSREIN
Property tax history
+2.0%/yrLatest (2025): $3,468 · +27.1% YoY. Source: county tax records.
Cash-flow waterfall
monthlySold comps — $/sqft
last 12 mo · ≤1 miLoading sold comps…