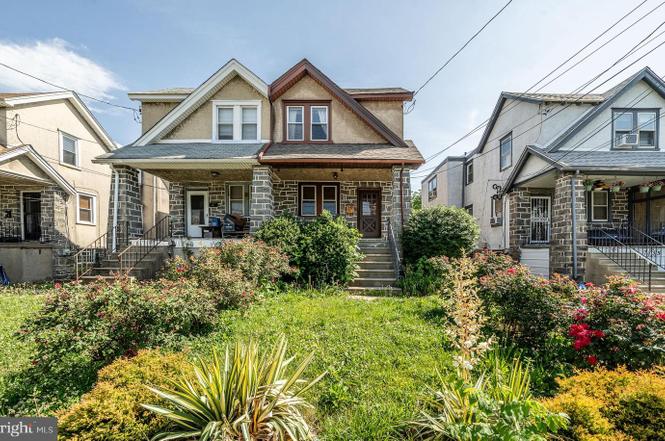
7737 Parkview Rd · Philadelphia, PA
Flood risk 1/10 · Minimal
- FEMA flood zone
- X (unshaded)
- Chance of flooding over 30 yrs
- 0.0%
- Est. flood insurance / yr
- $473 – $860
Fire risk 1/10 · Minimal
- Est. fire insurance / yr
- $511 – $949
Heat risk 6/10 · Moderate
- Hot days now (above 103°F)
- 7 days/yr
- Hot days in 30 yrs
- 15 days/yr
Wind risk 6/10 · Moderate
- Chance of severe wind over 30 yrs
- 27.0%
Air-quality risk 4/10 · Minor
- Unhealthy air days now
- 3 days/yr
- Unhealthy air days in 30 yrs
- 6 days/yr
Risk factors via First Street. Map © Google.
Why this score? — see what drove the D+ grade
The composite is a weighted blend of 9 inputs, each scored 0–100. Each bar is that input's sub-score; the figure is the points it added to the 100-point composite (weight × sub-score).
- ARV discount +15.0/15.0
- Cash flow +13.8/30.0
- 1% rule +5.4/10.0
- DSCR +4.2/10.0
- Livability +3.9/5.0
- Rent growth +2.9/5.0
- Condition / age +2.5/5.0
- Schools +2.4/10.0
- Appreciation +0.0/10.0
$174,900
🖨 Deal sheet (PDF) 📄 Offer letter ✓ Due diligence
Listing remarks
Welcome to 7737 Parkview Road, a classic 3-bedroom, 1-bath stone-facade twin in Upper Darby, offering a rare combination of solid structure and exceptional panoramic views! Perfectly situated overlooking the freshly reimagined and newly upgraded Cobbs Creek Golf Course, this estate sale is being sold in strictly as-is condition and presents an incredible opportunity to build instant sweat equity. Arrive to a welcoming, covered front porch with a charming stone facade—the perfect spot for your morning coffee while taking in the neighborhood. Step inside to find original hardwood floors spanning throughout a spacious living and dining layout. The kitchen features a convenient eat-in are
Key facts
- Covered front porch
- Private driveway
- Panoramic views
Tags
Property features AI
Exterior
- Parking: Attached rear-entry garage with inside access; Shared driveway; One total garage/parking space
- Utilities: Public water; Public sewer; Natural gas
- Home design: Semi-detached; Combination of flat and pitched shingle roof; Entry from rear garage (inside access); Facing direction not specified; Entry level not specified
- Construction: Stucco and stone exterior; Permanent foundation; Replacement windows with screens; Year built from assessor
- Exterior features: Sidewalks; Deck(s)
Interior
- Kitchen: Stove; Refrigerator; Dishwasher
- Bedrooms: Three bedrooms on the upper level
- Flooring: Hardwood
- Bathrooms: One full bathroom
- Heating & cooling: Hot water heating; Natural gas heating and hot water
- Interior features: Dining area; Traditional floor plan; Eat-in kitchen; Wood floors
- Laundry & utility: Basement with outside entrance (unfinished)
Neighborhood map
What this means for you Summary
Snapshot
- This is a 3-bed/1.0-bath townhouse listed at $175k.
Deal economics
- At list price, monthly cash flow is $15 ($177/yr) — positive.
- The deal already cash-flows at list — no discount required.
- Meets the 1% rule at list price ($2k rent vs $175k).
- Cap rate 6.4% vs local median 3.5% in Philadelphia — top-decile yield for the area; either an underpriced asset or a hidden risk that comps aren't pricing in. Stress-test before assuming the spread holds.
Location & tenants
- Location reads 77/100 on livability (#348 in PA, #3,054 nationally) — a middle-class / working-renter tenant base. Strengths: amenities A+, commute A+, cost of living A+; Watch: employment C-, crime F.
- Upper Darby SD (suburban): math 18% / reading 36% proficiency, ranked #453 of 539 in PA (top 84%) — low school quality limits family demand, transient renter base, plan for 1-2y turnover.
- Zoned schools: Highland Park El Sch (math 18% / reading 43%, grade F, #1,119 of 1,518 statewide, top 74%, 701 students, 100% FRL); Beverly Hills Ms (math 6% / reading 25%, grade F, #469 of 512 statewide, top 92%, 1,523 students, 100% FRL); Upper Darby Shs (math 46% / reading 47%, grade D-, #176 of 437 statewide, top 40%, 4,191 students, 95% FRL) — zoned schools average 98% FRL vs 52% district-wide (46 pts higher); higher-poverty schools than district average — tighter screening recommended.
- Market conditions: Rents rising (+1.6%/yr); 133 active listings in the ZIP; 33 comparable units currently listed for rent nearby; rentals at typical pace (median 20d on market — plan ~3-4 weeks tenant-placement turnaround); 299 units permitted in Delaware County in 2024 (5 in 5+ unit buildings).
- This rent runs 38% of the median local income ($57k/yr) — at the standard rent-burdened threshold; future hikes will face affordability resistance.
Forward outlook
- Local home prices are declining (-3.0%/yr); year-one equity from $1k of loan paydown is wiped out by about $5k of value loss. Plan a longer hold.
Negotiation context
- Only 2 days on market — expect competitive offers; lowballing is unlikely to land.
- Current owner paid $34k; list at $175k implies a 422% gain — meaningful room to come down on a strong offer.
Risks & watch-outs
- Watch-outs: property tax is 3.0% of price; built in 1940 — expect roof / HVAC / electrical / plumbing capex.
- Climate carrying-cost: major wind risk, 27% chance of damaging wind over 30y; extreme-heat days projected 7→15/yr by 2055 (HVAC capex compounding) — expect insurance premiums to compound above CPI over the hold.
Questions for the listing agent
- Built in 1940 — when were the roof, HVAC, electrical panel, plumbing, and water heater last replaced?
- Property tax is high relative to price — has the assessment been appealed recently, and will the sale trigger a re-assessment?
- Is there a deadline driving the sale (1031 exchange, divorce, estate, relocation)? That informs how much negotiation room exists.
- Schools are D-rated, which usually means shorter tenancies and higher turnover. Who's the typical renter profile here, and what's been the actual vacancy rate?
- Crime grade is F in this area — have there been break-ins, vandalism, or insurance claims at this property in the last 3 years? What carrier currently insures it and at what premium?
- The area grade is low — what's the realistic commute time and amenity access for the typical tenant pool here? Any planned neighborhood developments (good or bad) we should know about?
- What's the average days-on-market for RENTAL listings here right now (not sales)? A rising rental-DOM trend means longer vacancies and softer asking-rent achievability than the comps imply.
- What's the recent tenant-quality profile in this submarket — average credit score on applications, eviction rate, late-payment / NSF rate, and stable-employment percentage? A property-management company in the area should have these aggregated.
- How much new for-sale + rental construction is in the pipeline within 1–3 miles? Heavy new supply typically softens prices + rents 12–24 months out; constrained supply supports both.
Investment metrics
- 1% rule
- 1.04% ✓
- Cap rate
- 6.39%
- Cash-on-cash
- 0.36%
- DSCR
- 1.02
- GRM
- 8.0
CMA / ARV
- ARV (on-the-fly)
- $252,736
- Comps found
- 12
Show comp detail 12 sales within ~0.75 mi
| Address | Dist | Beds/Ba | Sqft | Sold | Price | $/sf | Match |
|---|---|---|---|---|---|---|---|
| 105 N Fairview Ave | 0.12mi | 3/2.0 | 1,400 (-2%) | 0mo | $255,000 | $182 | 86 |
| 7819 Windrim Ave | 0.16mi | 3/1.0 | 1,272 (-11%) | 0mo | $187,500 | $147 | 73 |
| 101 N Pennock Ave | 0.12mi | 3/1.5 | 1,582 (+10%) | 3mo | $231,000 | $146 | 73 |
| 7945 Arlington Ave | 0.72mi | 3/1.0 | 1,419 (-1%) | 1mo | $228,000 | $161 | 64 |
| 223 Saint Laurence Rd | 0.26mi | 3/1.5 | 1,643 (+14%) | 2mo | $220,000 | $134 | 61 |
| 1338 Kimberly Dr | 0.56mi | 3/1.5 | 1,569 (+9%) | 2mo | $275,000 | $175 | 54 |
| 1351 Kimberly Dr | 0.59mi | 3/2.0 | 1,309 (-9%) | 1mo | $249,000 | $190 | 53 |
| 7800 Beverly Blvd | 0.71mi | 3/1.0 | 1,560 (+9%) | 2mo | $275,000 | $176 | 51 |
| 122 Crestview Rd | 0.60mi | 4/1.5 (+1) | 1,612 (+12%) | 0mo | $325,000 | $202 | 44 |
| 7431 Drexel Rd | 0.72mi | 3/1.5 | 1,260 (-12%) | 1mo | $221,000 | $175 | 43 |
| 7523 Woodcrest Ave | 0.63mi | 3/2.5 | 1,266 (-12%) | 4mo | $250,500 | $198 | 42 |
| 7501 Woodcrest Ave | 0.66mi | 4/4.5 (+1) | 1,518 (+6%) | 1mo | $350,000 | $231 | 40 |
Match score weights: distance 35% · size 25% · config 20% · recency 20%. Top-matched comps best support the ARV.
Projected returns pro-forma
-3.0% appreciation · 1.62% rent growth · sell at horizon
- IRR
- -17.4%
- Equity multiple
- 0.39×
- Total profit
- $-29,733
- Equity at exit
- $26,078
- IRR
- -12.6%
- Equity multiple
- 0.31×
- Total profit
- $-33,972
- Equity at exit
- $15,122
Cash invested: $48,972 (down + closing). Projections, not guarantees.
Landlord ↔ Tenant lean methodology
- Overall (STATE)
- 62 Landlord-Friendly
- State Pennsylvania
- 62 Landlord-Friendly · EVEN
- County
- — inherits STATE
- City
- — inherits STATE
ZIP-level market 19082
- Home prices YoY
- -32.1%
- Rents YoY
- 1.6%
- Active inventory
- 133
- Price-to-rent
- 8.0×
Monthly cashflow live
- Estimated rent
- $1,817 high interval (Pro) →
- Mortgage (P&I)
- −$917
- Tax from tax record
- −$430 /mo · $5,164/yr
- Insurance
- −$73
- HOA
- −$0
- Vacancy / Maint / Mgmt
- −$381
- Net cashflow
- $15
Break-even live
Sensitivity live
| Price | -10% $114 | -5% $64 | +0% $15 | +5% $-35 | +10% $-84 |
|---|---|---|---|---|---|
| Rent | -10% $-129 | -5% $-57 | +0% $15 | +5% $87 | +10% $158 |
| Rate | -1.0pp $103 | -0.5pp $59 | base $15 | +0.5pp $-31 | +1.0pp $-77 |
UW: 25.0% down · 7.5% · 30yr · 1.5% tax · 5.0% vac · 8.0% maint · 8.0% mgmt
Financing live
Cash to close
- Down payment
- $43,725
- Closing costs
- $5,247
- Reserves months
- —
- Total cash needed
- —
Loan-product check · same deal, 3 products live
Conventional
25% down · 7.5% · 30yr
- Down + closing
- —
- Monthly P&I
- —
- Monthly cashflow
- —
- DSCR
- —
- Eligible?
- —
Personal DTI + credit; lowest rate.
DSCR
20% down · 8.5% · 30yr
- Down + closing
- —
- Monthly P&I
- —
- Monthly cashflow
- —
- DSCR
- —
- Eligible?
- —
No personal income docs; deal must DSCR.
Hard money
10% down · 12.0% · 12mo
- Down + closing
- —
- Monthly P&I
- —
- Monthly cashflow
- —
- DSCR
- —
- Eligible?
- —
Short-term bridge; refi at stabilization.
Rent comps 33 comps
| Address | Beds | Baths | Sqft | Rent | $/sqft | DOM | Units | Dist |
|---|---|---|---|---|---|---|---|---|
| 10 Oakley Rd Upper Darby, PA | 3.0 | 1.0 | 1476 | $1,895 | $1.28 | 26d | 1 | 0.19mi |
| 113 Saint Laurence Rd Upper Darby, PA | 2.0 | 1.0 | 1360 | $1,350 | $0.99 | 18d | 1 | 0.29mi |
| 51 N State Rd Upper Darby, PA | 3.0 | 1.0 | 1244 | $1,595 | $1.28 | 45d | 1 | 0.31mi |
| 44 Sunshine Rd Upper Darby, PA | 4.0 | 1.0 | 1481 | $1,795 | $1.21 | 23d | 1 | 0.34mi |
| 89 S State Rd Upper Darby, PA | 2.0 | 1.0 | 865 | $1,404 | $1.62 | 0d | 2 | 0.47mi |
| 233 S State Rd Unit 2ND Upper Darby Township, PA | 3.0 | 2.0 | 950 | $2,000 | $2.11 | 45d | 1 | 0.62mi |
| 7100 W Chester Pike Upper Darby Township, PA | 1.0–2.0 | 1.0 | 770 | $1,315 | $1.71 | 26d | 5 | 0.62mi |
| 55 N Keystone Ave Upper Darby, PA | 3.0 | 1.0 | 1258 | $1,700 | $1.35 | 45d | 1 | 0.62mi |
| 249 N Linden Ave Upper Darby, PA | 3.0 | 1.0 | 1237 | $1,700 | $1.37 | 7d | 1 | 0.68mi |
| 261 S Bayberry Ln Upper Darby, PA | 3.0 | 1.0 | 1248 | $2,200 | $1.76 | 4d | 1 | 0.70mi |
| 7801 Westview Ave Upper Darby, PA | 3.0 | 1.0 | 1152 | $2,100 | $1.82 | 0d | 1 | 0.73mi |
| 130 Garrett Rd Upper Darby, PA | 2.0 | 1.0 | 675 | $999 | $1.48 | 7d | 2 | 0.75mi |
| 217 Sansom St Upper Darby, PA | 2.0 | 1.0 | 1342 | $1,000 | $0.75 | 26d | 1 | 0.76mi |
| 58 Suburban Ln Upper Darby, PA | 3.0 | 1.0 | 1152 | $2,300 | $2.00 | 26d | 1 | 0.77mi |
| 130 Ivy Ct Upper Darby, PA | 3.0 | 1.0 | 1420 | $2,000 | $1.41 | 4d | 1 | 0.92mi |
| 228 Bayard Rd Upper Darby, PA | 3.0 | 2.5 | 1600 | $2,095 | $1.31 | 7d | 1 | 0.95mi |
| 2204 Lynn Blvd Drexel Hill, PA | 3.0 | 2.0 | 1120 | $2,300 | $2.05 | 46d | 1 | 0.98mi |
| 2219 Ardmore Ave Drexel Hill, PA | 3.0 | 1.0 | 1120 | $2,000 | $1.79 | 45d | 1 | 1.02mi |
| 88 S Harwood Ave Upper Darby, PA | 3.0 | 1.0 | 1152 | $1,950 | $1.69 | 4d | 1 | 1.08mi |
| 2420 Cedar Ln Unit 2 Drexel Hill, PA | 2.0 | 1.0 | 1500 | $1,400 | $0.93 | 14d | 1 | 1.14mi |
| 317 Barker Ave Lansdowne, PA | 3.0 | 2.0 | 1596 | $2,700 | $1.69 | 25d | 1 | 1.18mi |
| 222 Rock Glen Rd Wynnewood, PA | 3.0 | 1.5 | 1548 | $3,500 | $2.26 | 0d | 1 | 1.19mi |
| 430 Glendale Rd Upper Darby, PA | 3.0 | 1.0 | 1090 | $1,650 | $1.51 | 23d | 1 | 1.23mi |
| 293 Wabash Ave Lansdowne, PA | 3.0 | 1.0 | 1377 | $1,900 | $1.38 | 20d | 1 | 1.27mi |
| 530 E Manoa Rd Havertown, PA | 3.0 | 1.0 | 1236 | $2,800 | $2.27 | 45d | 1 | 1.28mi |
| 177 Wellington Rd Upper Darby, PA | 3.0 | 2.0 | 1236 | $2,000 | $1.62 | 26d | 1 | 1.29mi |
| 259 Heather Rd Upper Darby, PA | 2.0 | 1.0 | 1120 | $1,395 | $1.25 | 0d | 1 | 1.30mi |
| 292 N Wycombe Ave Lansdowne, PA | 2.0 | 1.0 | 1162 | $1,600 | $1.38 | 45d | 1 | 1.31mi |
| 31 Lamport Rd Upper Darby, PA | 3.0 | 1.0 | 1244 | $1,800 | $1.45 | 7d | 1 | 1.31mi |
| 2410 David Dr Unit 2ND FL Havertown, PA | 2.0 | 1.0 | 900 | $1,450 | $1.61 | 14d | 1 | 1.35mi |
| 1001 City Ave Unit E-1107 Penn Wynne, PA | 2.0 | 2.0 | 1222 | $2,750 | $2.25 | 20d | 1 | 1.45mi |
| 7216 Clinton Rd Upper Darby, PA | 3.0 | 1.0 | 1170 | $1,815 | $1.55 | 3d | 1 | 1.48mi |
| 5 W Plumstead Ave Unit 1 Lansdowne, PA | 2.0 | 1.0 | 1100 | $1,550 | $1.41 | 26d | 1 | 1.49mi |
Listing history 4 events
-
2026-06-21statusdays on market $174,900 Pending 2 DOM
-
2026-06-18status $174,900 Active 1 DOM
-
2026-06-17remarks 693-char remark
-
2026-06-17$174,900 Coming Soon 1 DOM
ⓘ Source: listings_history table (triggers on properties + properties_extension) + one-shot
backfill from property_details.listing_events for pre-trigger history.
Tax reassessment forecast PA · Partial reset (capped growth)
- Current annual tax
- $5,164 · $430/mo
- Projected year-2 tax
- $5,164 · $430/mo
- Expected delta
- $0/yr ($0/mo · 0.0%)
ⓘ Screening estimate from a state-policy table — verify with the county assessor before closing.
Climate risk First Street
- Flood 1/10 Low FEMA zone X (unshaded) · 0% chance over 30 yrs
- Wildfire 1/10 Low
- Heat 6/10 Major 7 d/yr ≥103°F today · 15 d/yr by 30 yrs out
- Wind 6/10 Major 27% chance of damaging wind over 30 yrs
- Air quality 4/10 Moderate 3 unhealthy d/yr today · 6 by 30 yrs out
Nearby sold comps map
Loading sold comps map…
Walkable amenities ~0.75 mi
Loading nearby amenities…
Taxation est. · year 1
- Rental income
- $21,800
- − Mortgage interest
- −$9,797
- − Property taxes
- −$5,164
- − Insurance
- −$874
- − Repairs & maintenance
- −$1,744
- − Management
- −$1,744
- − Depreciation
- −$5,088
- Taxable loss
- −$2,612
- Est. tax savings @ 24.0%
- +$627
- After-tax cash flow
- $804/yr
For passive investors: Depreciation is non-cash, so a rental often shows a tax loss while cash-flowing — sheltering income. Rental losses are passive: they offset passive income freely, and up to $25,000/yr can offset ordinary (W-2) income if you actively participate and your MAGI is under $100k (phasing out to $0 by $150k); unused losses carry forward. On sale, claimed depreciation is recaptured at up to 25%, and gains may owe capital-gains tax (a 1031 exchange can defer both). Figures are a year-1 estimate at your 24.0% rate — not tax advice; consult a CPA.
Schools (NCES district)
- District
- Upper Darby SD
- NCES district ID
- 4224320
- Math proficiency
- 18% ▼ -8.00%
- Reading proficiency
- 36% ▼ -10.00%
- Median HH income
- $50,341
- Composite
- 23.68/100
- National rank
- #7837
- State rank
- #453 of 539 in PA
Livability — Philadelphia
- Score
- 77/100
- State rank
- #348
- US rank
- #3054
Category grades
Schools grade is shown separately in the Schools card above.
Census & demographics
- County
- Delaware County · 399,863 people
- City population
- 1,559,001
- Metro
- Philadelphia-Camden-Wilmington, PA-NJ-DE-MD
- Population (ZIP)
- 41,541
- Household income
- $57,108
- Rent vs Own
- Severe rent burden
- 2416.0
Population outlook (Delaware County) Hauer SSP2
- Today (2025)
- 577,490 people
- By 2030
- 581,243 · +0.6%
- By 2040
- 584,700 · +1.2%
- By 2050
- 586,581 · +1.6%
- By 2075
- 598,706 · +3.7%
- By 2100
- 590,823 · +2.3%
Race, ethnicity, and origin ACS 2023
- Neighborhood character
- Highly diverse neighborhood (Simpson 0.71)
- Race & ethnicity
- Black 44% White 21% Asian 17% Hispanic / Latino 13% Two or more races 5%
- Hispanic origin (detail)
- Mexican 3% Puerto Rican 2%
- Common ancestry
- Hispanic 2% Swiss 2% Romanian 1%
- Foreign-born
- 34% · Canada, Vietnam, South Korea
- Languages at home
- 62% English-only · Spanish 11% Other Indo-European 10% French/Haitian/Cajun 5%
Political lean MEDSL · Delaware
- 2024 margin
- Strong D (+23.7) · D 61.4% · R 37.6% · Other 1.0%
- 2008→2024 swing
- +2.3pp toward D · 2008: 21.4pp · 2024: 23.7pp
- All cycles
- 2024: D+23.7 2020: D+26.7 2016: D+22.0 2012: D+21.8 2008: D+21.4
Not yet ingested
- Civics
- —
Market trends
- HPI YoY
- ▼ -161.05%
- Current HPI
- 341.2957
- Rent YoY
- ▲ 1.62%
- Metro
- Philadelphia-Camden-Wilmington, PA-NJ-DE-MD
- State GDP YoY
- ▲ 1.68%
- F500 in state
- 34
Industry mix (Fortune 500 HQ in PA)
| Industry | F500 HQs | Revenue |
|---|---|---|
| Healthcare | 2 | $309B |
|
||
| Insurance | 2 | $27B |
|
||
| Telecommunications / Media | 1 | $124B |
|
||
| Industrial Distribution | 1 | $22B |
|
||
| Financial Services | 1 | $20B |
|
||
| Chemicals / Materials | 1 | $18B |
|
||
Price history
+422.1% since first listed2 events — show timeline
- 2026-06-16 Coming Soon $174,900 BRIGHT MLS
- 1977-12-09 Sold (Public Records) $33,500 Public Records
Property tax history
+2.0%/yrLatest (2026): $5,164 · +7.7% YoY. Source: county tax records.
Cash-flow waterfall
monthlySold comps — $/sqft
last 12 mo · ≤1 miLoading sold comps…