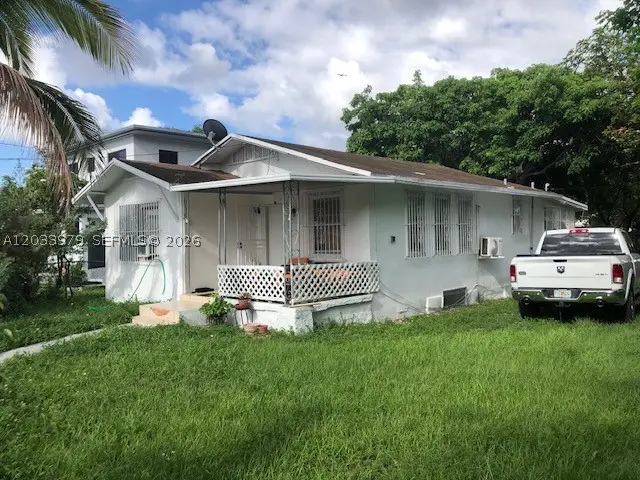
3314 NW 9th Ct · Miami, FL
Flood risk 1/10 · Minimal
- FEMA flood zone
- X (unshaded)
- Chance of flooding over 30 yrs
- 0.0%
- Est. flood insurance / yr
- $507 – $1,088
Fire risk 1/10 · Minimal
- Est. fire insurance / yr
- $947 – $1,759
Heat risk 10/10 · Severe
- Hot days now (above 103°F)
- 7 days/yr
- Hot days in 30 yrs
- 28 days/yr
Wind risk 10/10 · Severe
- Chance of severe wind over 30 yrs
- 99.0%
Air-quality risk 2/10 · Minimal
- Unhealthy air days now
- 1 days/yr
- Unhealthy air days in 30 yrs
- 1 days/yr
Risk factors via First Street. Map © Google.
Why this score? — see what drove the F grade
The composite is a weighted blend of 9 inputs, each scored 0–100. Each bar is that input's sub-score; the figure is the points it added to the 100-point composite (weight × sub-score).
- Cash flow +7.6/30.0
- ARV discount +7.5/15.0
- Schools +4.2/10.0
- Livability +3.9/5.0
- Rent growth +3.1/5.0
- Condition / age +2.5/5.0
- 1% rule +1.9/10.0
- DSCR +1.7/10.0
- Appreciation +0.0/10.0
$409,000
🖨 Deal sheet (PDF) 📄 Offer letter ✓ Due diligence
Listing remarks MLS
Multi family zoned double frontage lot in rapidly developing Buena Vista Park subdivision. Property sits minutes from Wynwood, Design District , I-95, State Road 112 &, State Road 195 & Biscayne Blvd. Property sits in close proximity to Miami Beach, Downtown Miami & Miami Shores. Excellent development opportunity in rapidly developing area.
Key facts
- Double frontage lot
- Multi family zoned
- 5,640 sq ft lot
Tags
Property features AI
Exterior
- Parking: Detached carport; Carport with 6 covered spaces; RV access/parking; On-street parking
- Utilities: Public water; Public sewer
- Home design: Single-story; Faces east; Unknown year built
- Construction: Block, frame and stucco construction; Shingle roof
- Exterior features: Fenced yard; Paved city street frontage; Less than quarter-acre lot
Interior
- Kitchen: Electric range; Refrigerator
- Bedrooms: Bedroom on main level
- Flooring: Laminate
- Bathrooms: 1 full bathroom
- Heating & cooling: Electric heating; Electric cooling
- Interior features: Den; Living/dining room; Bedroom on main level; Stacked bedrooms
Neighborhood map
What this means for you Summary
Snapshot
- This is a 2-bed/1.0-bath single-family listed at $409k.
Deal economics
- At list price, monthly cash flow is $-487 ($-6k/yr) — negative.
- To cash-flow at today's rent, offer at most $323k (21.1% below list).
- To meet the 1% rule (rent ≥ 1% of price), the offer needs to be $281k (31.4% below list).
- Recommended offer: $281k (31.4% below list) — sets the bar for 1% rule.
- Cap rate 4.9% vs local median 1.9% in Miami — top-decile yield for the area; either an underpriced asset or a hidden risk that comps aren't pricing in. Stress-test before assuming the spread holds.
Location & tenants
- Location reads 78/100 on livability (#177 in FL, #2,724 nationally) — a middle-class / working-renter tenant base. Strengths: amenities A+, commute A+, health & safety A+; Watch: employment C-, crime F, cost of living F.
- Miami-Dade (suburban): math 45% / reading 54% proficiency, ranked #40 of 73 in FL (top 55%) — families likely to look elsewhere, expect single-tenant / working-renter base with shorter leases; 64% free/reduced lunch — lower-income household profile, screen leases tightly.
- Zoned schools: Santa Clara Elementary School (math 30% / reading 28%, grade F, #1,932 of 2,144 statewide, top 91%, 596 students, 59% FRL); Georgia Jones Ayers Middle School (math 13% / reading 16%, grade F, #568 of 571 statewide, top 100%, 543 students, 68% FRL); Miami Jackson Senior High School (math 13% / reading 22%, grade F, #575 of 667 statewide, top 86%, 1,305 students, 62% FRL) — zoned schools at 63% FRL track the district average.
- Zoned-school proficiency averages 20% at this address vs 50% district-wide (-29 pts) — the specific schools serving this property underperform the Miami-Dade average; the district grade overstates school quality for this exact location.
- Market conditions: Rents rising (+2.3%/yr); 296 active listings in the ZIP; 1 comparable units currently listed for rent nearby; lower-income renter base — watch delinquency; 10,051 units permitted in Miami-Dade County in 2024 (7,758 in 5+ unit buildings).
Forward outlook
- Local home prices are declining (-3.0%/yr); year-one equity from $3k of loan paydown is wiped out by about $12k of value loss. Plan a longer hold.
- Miami-Dade County population projected at +28% by 2050 — long-run rental-demand tailwind backs the buy-and-hold thesis.
Negotiation context
- Only 12 days on market — expect competitive offers; lowballing is unlikely to land.
- 6 sale attempts since 14y ago with the ask held roughly flat each time — persistent listings suggest the price (not the market) is what's stuck; bring a comps-based counter.
- Current owner paid $58k; list at $409k implies a 605% gain — meaningful room to come down on a strong offer.
Risks & watch-outs
- Watch-outs: built in 1924 — expect roof / HVAC / electrical / plumbing capex.
- Climate carrying-cost: severe wind risk, 99% chance of damaging wind over 30y; extreme-heat days projected 7→28/yr by 2055 (HVAC capex compounding) — expect insurance premiums to compound above CPI over the hold.
Questions for the listing agent
- What do current leases actually rent for vs. the listed asking? Can we see a recent rent roll and the last 12 months of T-12 income?
- Built in 1924 — when were the roof, HVAC, electrical panel, plumbing, and water heater last replaced?
- Is there a deadline driving the sale (1031 exchange, divorce, estate, relocation)? That informs how much negotiation room exists.
- Schools are B-rated — typically a magnet for longer-tenancy family renters. What's the average tenant stay here, and is there a school-zone premium baked into asking?
- Crime grade is F in this area — have there been break-ins, vandalism, or insurance claims at this property in the last 3 years? What carrier currently insures it and at what premium?
- The area grade is low — what's the realistic commute time and amenity access for the typical tenant pool here? Any planned neighborhood developments (good or bad) we should know about?
- What's the average days-on-market for RENTAL listings here right now (not sales)? A rising rental-DOM trend means longer vacancies and softer asking-rent achievability than the comps imply.
- What's the recent tenant-quality profile in this submarket — average credit score on applications, eviction rate, late-payment / NSF rate, and stable-employment percentage? A property-management company in the area should have these aggregated.
- How much new for-sale + rental construction is in the pipeline within 1–3 miles? Heavy new supply typically softens prices + rents 12–24 months out; constrained supply supports both.
Investment metrics
- 1% rule
- 0.69% ✗
- Cap rate
- 4.86%
- Cash-on-cash
- -5.11%
- DSCR
- 0.77
- GRM
- 12.1
CMA / ARV
- ARV (on-the-fly)
- $256,020
- Comps found
- 4
Show comp detail 4 sales within ~0.75 mi
| Address | Dist | Beds/Ba | Sqft | Sold | Price | $/sf | Match |
|---|---|---|---|---|---|---|---|
| 1029 NW 42nd St | 0.49mi | 2/1.0 | 1,110 (+9%) | 6mo | $238,000 | $214 | 58 |
| 819 NW 47th St | 0.74mi | 2/1.0 | 1,090 (+7%) | 4mo | $405,000 | $372 | 51 |
| 1355 NW 44th St | 0.75mi | 2/1.0 | 1,076 (+6%) | 9mo | $270,000 | $251 | 48 |
| 1236 NW 31st St | 0.34mi | 2/1.0 | 1,167 (+14%) | 20mo | $260,000 | $223 | 43 |
Match score weights: distance 35% · size 25% · config 20% · recency 20%. Top-matched comps best support the ARV.
Projected returns pro-forma
-3.0% appreciation · 2.26% rent growth · sell at horizon
- IRR
- -25.8%
- Equity multiple
- 0.13×
- Total profit
- $-99,426
- Equity at exit
- $60,983
- IRR
- -24.8%
- Equity multiple
- -0.18×
- Total profit
- $-135,070
- Equity at exit
- $35,363
Cash invested: $114,520 (down + closing). Projections, not guarantees.
Landlord ↔ Tenant lean methodology
- Overall (STATE)
- 87 Strongly Landlord-Friendly
- State Florida
- 87 Strongly Landlord-Friendly · R+3
- County
- — inherits STATE
- City
- — inherits STATE
ZIP-level market 33127
- Home prices YoY
- -30.1%
- Rents YoY
- 2.3%
- Active inventory
- 296
- Price-to-rent
- 12.1×
Monthly cashflow live
- Estimated rent
- $2,806 medium interval (Pro) →
- Mortgage (P&I)
- −$2,145
- Tax from tax record
- −$389 /mo · $4,663/yr
- Insurance
- −$170
- HOA
- −$0
- Vacancy / Maint / Mgmt
- −$589
- Net cashflow
- $-487
Break-even live
Sensitivity live
| Price | -10% $-256 | -5% $-372 | +0% $-487 | +5% $-603 | +10% $-719 |
|---|---|---|---|---|---|
| Rent | -10% $-709 | -5% $-598 | +0% $-487 | +5% $-377 | +10% $-266 |
| Rate | -1.0pp $-281 | -0.5pp $-383 | base $-487 | +0.5pp $-593 | +1.0pp $-701 |
UW: 25.0% down · 7.5% · 30yr · 1.5% tax · 5.0% vac · 8.0% maint · 8.0% mgmt
Financing live
Cash to close
- Down payment
- $102,250
- Closing costs
- $12,270
- Reserves months
- —
- Total cash needed
- —
Loan-product check · same deal, 3 products live
Conventional
25% down · 7.5% · 30yr
- Down + closing
- —
- Monthly P&I
- —
- Monthly cashflow
- —
- DSCR
- —
- Eligible?
- —
Personal DTI + credit; lowest rate.
DSCR
20% down · 8.5% · 30yr
- Down + closing
- —
- Monthly P&I
- —
- Monthly cashflow
- —
- DSCR
- —
- Eligible?
- —
No personal income docs; deal must DSCR.
Hard money
10% down · 12.0% · 12mo
- Down + closing
- —
- Monthly P&I
- —
- Monthly cashflow
- —
- DSCR
- —
- Eligible?
- —
Short-term bridge; refi at stabilization.
Rent comps 1 comps
| Address | Beds | Baths | Sqft | Rent | $/sqft | DOM | Units | Dist |
|---|---|---|---|---|---|---|---|---|
| 2900 Biscayne Blvd Miami, FL | 3.0 | 1.0–3.5 | 1260 | $13,305 | $10.56 | 4d | 13 | 1.36mi |
Listing history 8 events
-
2026-06-21days on market $409,000 Active 12 DOM
-
2026-06-18days on market $409,000 Active 9 DOM
-
2026-06-17days on market $409,000 Active 8 DOM
-
2026-06-16days on market $409,000 Active 7 DOM
-
2026-06-15days on market $409,000 Active 6 DOM
-
2026-06-13days on market $409,000 Active 4 DOM
-
2026-06-10remarks 348-char remark
-
2026-06-10$409,000 Active 1 DOM
ⓘ Source: listings_history table (triggers on properties + properties_extension) + one-shot
backfill from property_details.listing_events for pre-trigger history.
Tax reassessment forecast FL · Resets to sale price
- Current annual tax
- $4,663 · $389/mo
- Projected year-2 tax
- $4,663 · $389/mo
- Expected delta
- $0/yr ($0/mo · 0.0%)
ⓘ Screening estimate from a state-policy table — verify with the county assessor before closing.
Climate risk First Street
- Flood 1/10 Low FEMA zone X (unshaded) · 0% chance over 30 yrs
- Wildfire 1/10 Low
- Heat 10/10 Extreme 7 d/yr ≥103°F today · 28 d/yr by 30 yrs out
- Wind 10/10 Extreme 99% chance of damaging wind over 30 yrs
- Air quality 2/10 Low 1 unhealthy d/yr today · 1 by 30 yrs out
Nearby sold comps map
Loading sold comps map…
Walkable amenities ~0.75 mi
Loading nearby amenities…
Taxation est. · year 1
- Rental income
- $33,667
- − Mortgage interest
- −$22,910
- − Property taxes
- −$4,663
- − Insurance
- −$2,045
- − Repairs & maintenance
- −$2,693
- − Management
- −$2,693
- − Depreciation
- −$11,898
- Taxable loss
- −$13,236
- Est. tax savings @ 24.0%
- +$3,177
- After-tax cash flow
- $-2,672/yr
For passive investors: Depreciation is non-cash, so a rental often shows a tax loss while cash-flowing — sheltering income. Rental losses are passive: they offset passive income freely, and up to $25,000/yr can offset ordinary (W-2) income if you actively participate and your MAGI is under $100k (phasing out to $0 by $150k); unused losses carry forward. On sale, claimed depreciation is recaptured at up to 25%, and gains may owe capital-gains tax (a 1031 exchange can defer both). Figures are a year-1 estimate at your 24.0% rate — not tax advice; consult a CPA.
Schools (NCES district)
- District
- Miami-Dade
- NCES district ID
- 1200390
- Math proficiency
- 45% ▼ -16.00%
- Reading proficiency
- 54% ▼ -5.00%
- Median HH income
- $43,928
- Composite
- 41.76/100
- National rank
- #3397
- State rank
- #40 of 73 in FL
Livability — Miami
- Score
- 78/100
- State rank
- #177
- US rank
- #2724
Category grades
Schools grade is shown separately in the Schools card above.
Census & demographics
- Census place
- Miami, FL
- County
- Miami-Dade County · 2,697,751 people
- City population
- 827,308
- Metro
- Miami-Fort Lauderdale-Pompano Beach, FL
- Population (ZIP)
- 26,786
- Household income
- $41,230
- Rent vs Own
- Severe rent burden
- 2523.0
Population outlook (Miami-Dade County) Hauer SSP2
- Today (2025)
- 3,126,439 people
- By 2030
- 3,325,765 · +6.4%
- By 2040
- 3,697,561 · +18.3%
- By 2050
- 4,012,134 · +28.3%
- By 2075
- 4,605,612 · +47.3%
- By 2100
- 4,866,598 · +55.7%
Race, ethnicity, and origin ACS 2023
- Neighborhood character
- Majority Hispanic (55%)
- Race & ethnicity
- Hispanic / Latino 55% Black 39% Two or more races 30% White 4%
- Hispanic origin (detail)
- Mexican 2% Puerto Rican 6% Cuban 9% Dominican 5%
- Common ancestry
- Hispanic 11%
- Foreign-born
- 43% · Canada, Jamaica, Dominican Republic
- Languages at home
- 34% English-only · Spanish 53% French/Haitian/Cajun 12%
Political lean MEDSL · Miami-Dade
- 2024 margin
- R (+11.4) · D 43.9% · R 55.4%
- 2008→2024 swing
- -27.6pp toward R · 2008: 16.1pp · 2024: -11.4pp
- All cycles
- 2024: R+11.4 2020: D+7.3 2016: D+29.6 2012: D+23.7 2008: D+16.1
Not yet ingested
- Civics
- —
Market trends
- HPI YoY
- ▼ -293.00%
- Current HPI
- 680.1845
- Rent YoY
- ▲ 2.26%
- Metro
- Miami-Fort Lauderdale-Pompano Beach, FL
- State GDP YoY
- ▲ 3.28%
- F500 in state
- 36
Industry mix (Fortune 500 HQ in FL)
| Industry | F500 HQs | Revenue |
|---|---|---|
| Industrial Technology | 2 | $29B |
|
||
| Insurance | 2 | $17B |
|
||
| Retail | 1 | $60B |
|
||
| Technology Distribution | 1 | $58B |
|
||
| Homebuilding | 1 | $35B |
|
||
| Technology Manufacturing | 1 | $35B |
|
||
Price history
+2172.2% since first listed11 events — show timeline
- 2026-06-08 Listed $409,000 Beaches MLS
- 2026-06-08 Listed $409,000 MARMLS
- 2017-12-02 Listing Removed — MARMLS
- 2017-10-30 Listed $190,000 MARMLS
- 2017-08-01 Listing Removed — MARMLS
- 2017-06-02 Listed $189,000 MARMLS
- 2013-08-13 Sold (MLS) $58,000 MARMLS
- 2013-08-12 Sold (Public Records) $58,000 Public Records
- 2013-06-03 Relisted — MARMLS
- 2012-12-06 Listed $69,000 MARMLS
- 1978-07-01 Sold (Public Records) $18,000 Public Records
Property tax history
+13.6%/yrLatest (2025): $4,663 · +7.0% YoY. Source: county tax records.
Cash-flow waterfall
monthlySold comps — $/sqft
last 12 mo · ≤1 miLoading sold comps…