46357 Township Road 1208 · Coshocton, OH
Flood risk 1/10 · Minimal
- FEMA flood zone
- X (shaded)
- Chance of flooding over 30 yrs
- 0.0%
- Est. flood insurance / yr
- $473 – $860
Fire risk 1/10 · Minimal
- Est. fire insurance / yr
- $713 – $1,323
Heat risk 3/10 · Minor
- Hot days now (above 98°F)
- 7 days/yr
- Hot days in 30 yrs
- 18 days/yr
Wind risk 2/10 · Minimal
- Chance of severe wind over 30 yrs
- 1.0%
Air-quality risk 2/10 · Minimal
- Unhealthy air days now
- 1 days/yr
- Unhealthy air days in 30 yrs
- 3 days/yr
Risk factors via First Street. Map © Google.
Why this score? — see what drove the B grade
The composite is a weighted blend of 9 inputs, each scored 0–100. Each bar is that input's sub-score; the figure is the points it added to the 100-point composite (weight × sub-score).
- Cash flow +30.0/30.0
- 1% rule +10.0/10.0
- DSCR +10.0/10.0
- ARV discount +7.5/15.0
- Schools +4.6/10.0
- Livability +3.5/5.0
- Rent growth +2.5/5.0
- Condition / age +2.2/5.0
- Appreciation +0.0/10.0
$50,000
🖨 Deal sheet 📄 Offer letter ✓ Due diligence
Listing remarks
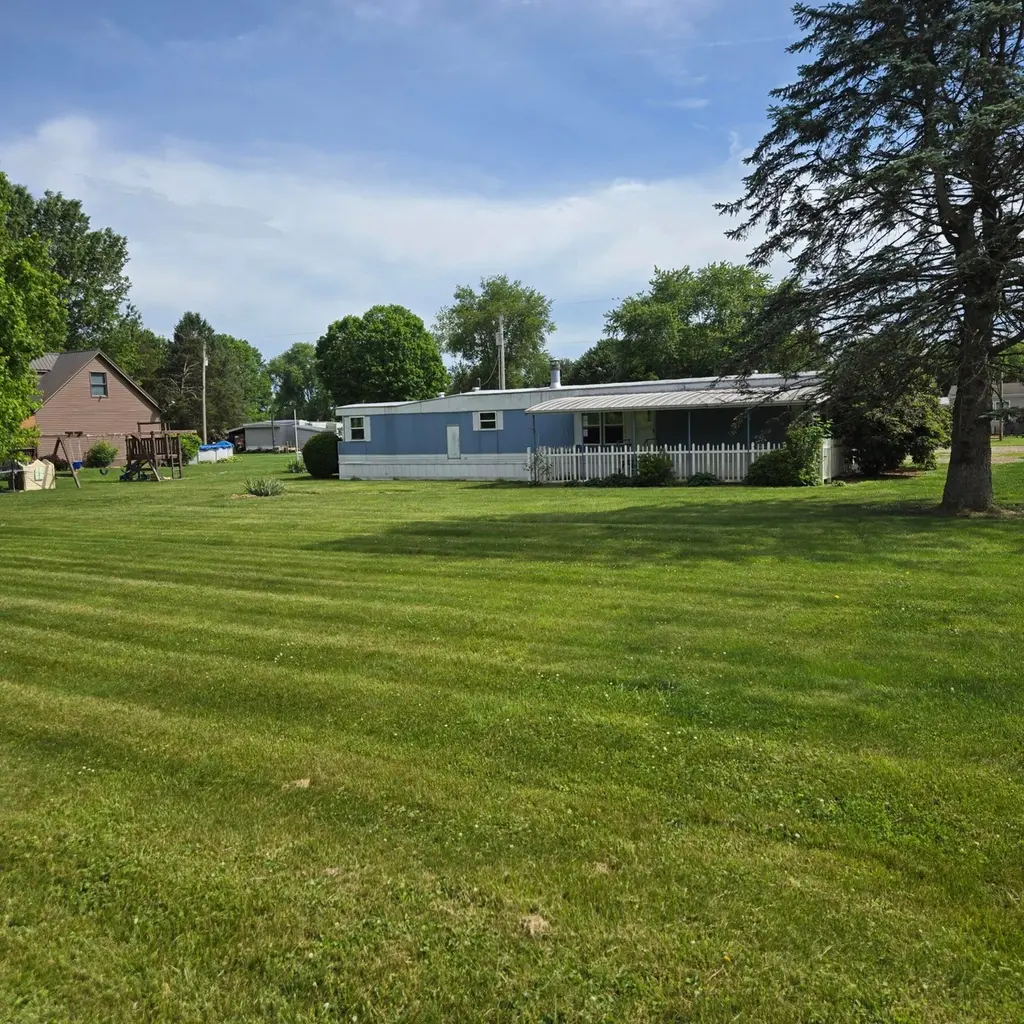
ONLINE AUCTION, the RESERVE (Minimum Bid) is $50,000. The auction ends at 7:00 PM, Monday, June 22nd, 2026. BUYERS MUST SIGN ACKNOWLEDGEMENT OF TERMS to bid. Agents, please see 'A2A'. This 3-bedroom, 2-bath mobile home sits on approximately 0.38± acres. Built in 1982, the home offers approximately 980 square feet of living space. The property includes a two-car detached garage and is serviced by well and septic.
Key facts
- 0.38 acre lot
- 2 garage spots
- Built 1982
Property features AI
Finance
- Other: Property listed with auction and standard sale conditions
Exterior
- Parking: Detached 2-car garage
- Utilities: Private water; Private sewer
- Home design: Single-family residence; One story; Built in 1982; No shared/common walls
- Exterior features: Slab foundation; Lot about 0.38 acre
Interior
- Bedrooms: Three main-level bedrooms
- Bathrooms: Two full bathrooms
- Interior features: Living area approximately 980
Neighborhood map
What this means for you Summary
Snapshot
- This is a 3-bed/2.0-bath single-family listed at $50k. Condition is rated fair.
Deal economics
- At list price, monthly cash flow is $542 ($7k/yr) — positive.
- The deal already cash-flows at list — no discount required.
- Meets the 1% rule at list price ($1k rent vs $50k).
- Recommended offer: $49k (1.5% below list) — sets the bar for market timing.
- Cap rate 19.3% vs local median 3.8% in Coshocton — top-decile yield for the area; either an underpriced asset or a hidden risk that comps aren't pricing in. Stress-test before assuming the spread holds.
Location & tenants
- Location reads 69/100 on livability (#526 in OH) — a middle-class / working-renter tenant base. Strengths: cost of living A+, housing A+, health & safety B+; Watch: crime C-, amenities F, commute F.
- River View Local (rural): math 52% / reading 56% proficiency, ranked #389 of 656 in OH (top 59%) — acceptable for families but not a draw, mixed tenant base, ~2y average lease.
- Market conditions: 116 active listings in the ZIP; 7 units permitted in Coshocton County in 2024 (0 in 5+ unit buildings).
Forward outlook
- Local home prices are declining (-3.0%/yr); year-one equity from $346 of loan paydown is wiped out by about $2k of value loss. Plan a longer hold.
- Coshocton County population projected at -18% by 2050 — secular population decline; favor cash flow + early exit over multi-decade hold.
- At projected returns (-3.0% appreciation + 3.0% rent growth), your $14k cash investment doubles in ~3 years — after that, you're playing with house money.
Negotiation context
- It's been on market 26 days — a 2% lower offer ($49k) is reasonable based on typical stale-listing flexibility.
Questions for the listing agent
- Have any recent inspections been done? Can we get a copy of the seller's disclosures and any deferred-maintenance estimates?
- Is there a deadline driving the sale (1031 exchange, divorce, estate, relocation)? That informs how much negotiation room exists.
- What's the average days-on-market for RENTAL listings here right now (not sales)? A rising rental-DOM trend means longer vacancies and softer asking-rent achievability than the comps imply.
- What's the recent tenant-quality profile in this submarket — average credit score on applications, eviction rate, late-payment / NSF rate, and stable-employment percentage? A property-management company in the area should have these aggregated.
- How much new for-sale + rental construction is in the pipeline within 1–3 miles? Heavy new supply typically softens prices + rents 12–24 months out; constrained supply supports both.
Investment metrics
- 1% rule
- 2.25% ✓
- Cap rate
- 19.30%
- Cash-on-cash
- 46.46%
- DSCR
- 3.07
- GRM
- 3.7
CMA / ARV
No comps found within radius.
Projected returns pro-forma
-3.0% appreciation · 3.0% rent growth · sell at horizon
- IRR
- 43.7%
- Equity multiple
- 2.89×
- Total profit
- $26,435
- Equity at exit
- $7,455
- IRR
- 49.7%
- Equity multiple
- 5.82×
- Total profit
- $67,538
- Equity at exit
- $4,323
Cash invested: $14,000 (down + closing). Projections, not guarantees.
Landlord ↔ Tenant lean methodology
- Overall (STATE)
- 73 Landlord-Friendly
- State Ohio
- 73 Landlord-Friendly · R+6
- County
- — inherits STATE
- City
- — inherits STATE
ZIP-level market 43812
- Active inventory
- 116
- Price-to-rent
- 3.7×
Monthly cashflow live
- Estimated rent
- $1,123 medium interval (Pro) →
- Mortgage (P&I)
- −$262
- Tax est. 1.5%
- −$62 /mo · $750/yr
- Insurance
- −$21
- HOA
- −$0
- Vacancy / Maint / Mgmt
- −$236
- Net cashflow
- $542
Break-even live
UW: 25.0% down · 7.5% · 30yr · 1.5% tax · 5.0% vac · 8.0% maint · 8.0% mgmt
Financing live
Cash to close
- Down payment
- $12,500
- Closing costs
- $1,500
- Reserves months
- —
- Total cash needed
- —
Loan-product check · same deal, 3 products live
Conventional
25% down · 7.5% · 30yr
- Down + closing
- —
- Monthly P&I
- —
- Monthly cashflow
- —
- DSCR
- —
- Eligible?
- —
Personal DTI + credit; lowest rate.
DSCR
20% down · 8.5% · 30yr
- Down + closing
- —
- Monthly P&I
- —
- Monthly cashflow
- —
- DSCR
- —
- Eligible?
- —
No personal income docs; deal must DSCR.
Hard money
10% down · 12.0% · 12mo
- Down + closing
- —
- Monthly P&I
- —
- Monthly cashflow
- —
- DSCR
- —
- Eligible?
- —
Short-term bridge; refi at stabilization.
Listing history 15 events
-
2026-06-18days on market $50,000 Active 26 DOM
-
2026-06-17days on market $50,000 Active 25 DOM
-
2026-06-16days on market $50,000 Active 24 DOM
-
2026-06-15days on market $50,000 Active 23 DOM
-
2026-06-13days on market $50,000 Active 21 DOM
-
2026-06-13days on market $50,000 Active 20 DOM
-
2026-06-09days on market $50,000 Active 17 DOM
-
2026-06-08days on market $50,000 Active 16 DOM
-
2026-06-07days on market $50,000 Active 15 DOM
-
2026-06-05days on market $50,000 Active 12 DOM
-
2026-06-03days on market $50,000 Active 11 DOM
-
2026-06-02days on market $50,000 Active 10 DOM
-
2026-06-01days on market $50,000 Active 9 DOM
-
2026-05-31days on market $50,000 Active 8 DOM
-
2026-05-23$50,000 Active
ⓘ Source: listings_history table (triggers on properties + properties_extension) + one-shot
backfill from property_details.listing_events for pre-trigger history.
Climate risk First Street
- Flood 1/10 Low FEMA zone X (shaded) · 0% chance over 30 yrs
- Wildfire 1/10 Low
- Heat 3/10 Moderate 7 d/yr ≥98°F today · 18 d/yr by 30 yrs out
- Wind 2/10 Low 100% chance of damaging wind over 30 yrs
- Air quality 2/10 Low 1 unhealthy d/yr today · 3 by 30 yrs out
Nearby sold comps map
Loading sold comps map…
Walkable amenities ~0.75 mi
Loading nearby amenities…
Taxation est. · year 1
- Rental income
- $13,482
- − Mortgage interest
- −$2,801
- − Property taxes
- −$750
- − Insurance
- −$250
- − Repairs & maintenance
- −$1,079
- − Management
- −$1,079
- − Depreciation
- −$1,455
- Taxable income
- $6,069
- Est. tax owed @ 24.0%
- −$1,457
- After-tax cash flow
- $5,047/yr
For passive investors: Depreciation is non-cash, so a rental often shows a tax loss while cash-flowing — sheltering income. Rental losses are passive: they offset passive income freely, and up to $25,000/yr can offset ordinary (W-2) income if you actively participate and your MAGI is under $100k (phasing out to $0 by $150k); unused losses carry forward. On sale, claimed depreciation is recaptured at up to 25%, and gains may owe capital-gains tax (a 1031 exchange can defer both). Figures are a year-1 estimate at your 24.0% rate — not tax advice; consult a CPA.
Condition & rehab AI · 13 photos
This mobile home requires moderate repairs and maintenance to improve its condition and value. Fresh paint, new flooring, and landscaping improvements would significantly enhance its appeal.
Repairs flagged
- Moderate Roof — Shingles appear aged
- Moderate Exterior Siding — Siding shows weathering
- Moderate Flooring — Carpeted floors show significant wear
- Moderate Interior Walls — Paint appears chipped in some areas
- Moderate Kitchen Cabinets — Cabinets and countertops show wear
- Moderate Landscaping — Landscaping is maintained but not lush
Value-add opportunities
- Resale Paint touch-ups — Fresh paint enhances curb appeal
- Resale Floor refinishing — New flooring improves aesthetics and functionality
- Both Landscaping improvements — Lush landscaping enhances curb appeal and property value
Renovation cost estimate screening
| Repair item | Severity | Est. cost |
|---|---|---|
| Roof · Shingles appear aged | Moderate | $3,000–15,000 |
| Exterior Siding · Siding shows weathering | Moderate | $3,000–15,000 |
| Flooring · Carpeted floors show significant wear | Moderate | $3,000–15,000 |
| Interior Walls · Paint appears chipped in some areas | Moderate | $3,000–15,000 |
| Kitchen Cabinets · Cabinets and countertops show wear | Moderate | $3,000–15,000 |
| Landscaping · Landscaping is maintained but not lush | Moderate | $3,000–15,000 |
| Total estimated repair cost · 6 items | $18,000–90,000 |
Value-add ROI direction
- Resale Paint touch-ups — Fresh paint enhances curb appeal ↑
- Resale Floor refinishing — New flooring improves aesthetics and functionality ↑
- Both Landscaping improvements — Lush landscaping enhances curb appeal and property value ↑
ⓘ Cost ranges are severity-bucket heuristics (US national rule-of-thumb). Get contractor quotes + a written scope before underwriting a rehab budget.
Schools (NCES district)
- District
- River View Local
- NCES district ID
- 3904648
- Math proficiency
- 52% ▼ -17.00%
- Reading proficiency
- 56% ▼ -10.00%
- Median HH income
- $45,488
- Composite
- 45.66/100
- National rank
- #2581
- State rank
- #389 of 656 in OH
Livability — Coshocton
- Score
- 69/100
- State rank
- #526
- US rank
- #8938
Category grades
Schools grade is shown separately in the Schools card above.
Census & demographics
- County
- Coshocton · 37,075 people
- Population (ZIP)
- 18,716
- Household income
- $51,930
- Rent vs Own
- Severe rent burden
- 7.2
Population outlook (Coshocton County) Hauer SSP2
- Today (2025)
- 35,193 people
- By 2030
- 34,112 · -3.1%
- By 2040
- 31,670 · -10.0%
- By 2050
- 29,033 · -17.5%
- By 2075
- 22,827 · -35.1%
- By 2100
- 16,421 · -53.3%
Race, ethnicity, and origin ACS 2023
- Neighborhood character
- Predominantly White (93%)
- Race & ethnicity
- White 93% Two or more races 5%
- Common ancestry
- Iranian 2% Lithuanian 2% Slovak 2%
- Foreign-born
- 1%
- Languages at home
- 98% English-only · German/W. Germanic 1%
Political lean MEDSL · Coshocton
- 2024 margin
- Solid R (+52.2) · D 23.5% · R 75.7%
- 2008→2024 swing
- -46.4pp toward R · 2008: -5.8pp · 2024: -52.2pp
- All cycles
- 2024: R+52.2 2020: R+49.0 2016: R+43.3 2012: R+9.5 2008: R+5.8
Not yet ingested
- Civics
- —
Market trends
- HPI YoY
- ▼ -188.33%
- Current HPI
- 216.5142
- Rent YoY
- —
- Metro
- —
- State GDP YoY
- ▲ 1.98%
- F500 in state
- 48
Industry mix (Fortune 500 HQ in OH)
| Industry | F500 HQs | Revenue |
|---|---|---|
| Insurance | 3 | $145B |
|
||
| Industrial Machinery | 3 | $49B |
|
||
| Financial Services | 3 | $24B |
|
||
| Consumer Goods | 2 | $93B |
|
||
| Aerospace / Defense | 2 | $47B |
|
||
| Utilities | 2 | $33B |
|
||
Price history
1 event — show timeline
- 2026-05-23 Listed $50,000 CBRMLS
Cash-flow waterfall
monthlySold comps — $/sqft
last 12 mo · ≤1 miLoading sold comps…