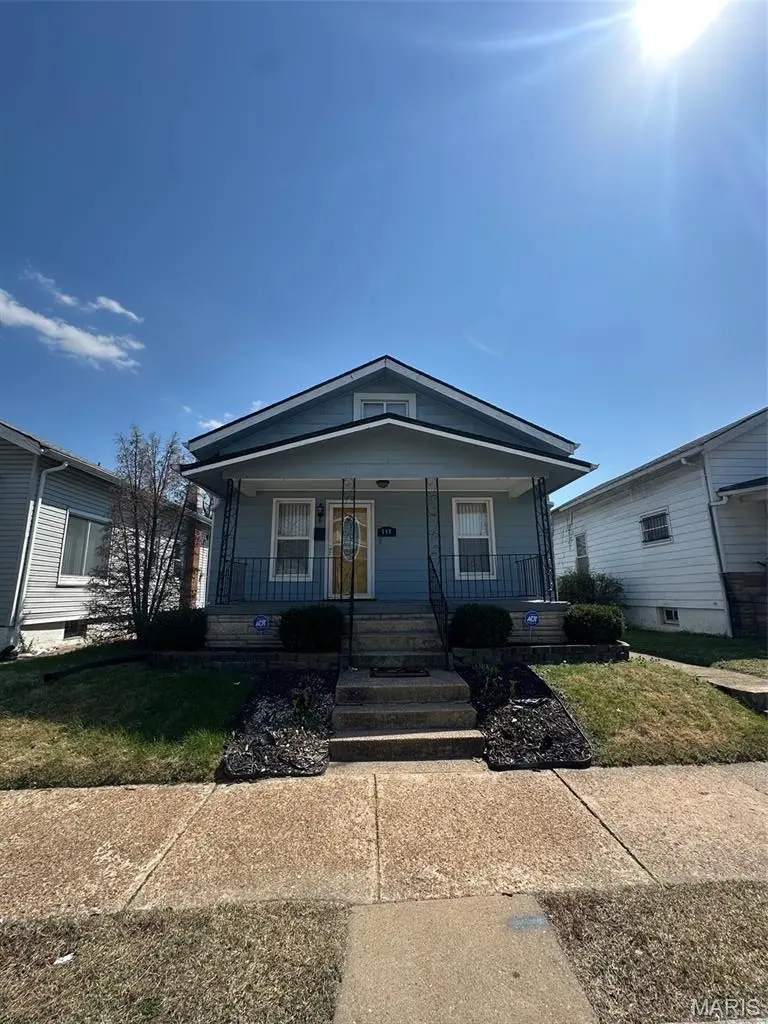
748 Ponce Ave · St. Louis, MO
Flood risk 6/10 · Moderate
- FEMA flood zone
- X (shaded)
- Chance of flooding over 30 yrs
- 0.72%
- Est. flood insurance / yr
- $473 – $860
Fire risk 1/10 · Minimal
- Est. fire insurance / yr
- $1,054 – $1,958
Heat risk 5/10 · Moderate
- Hot days now (above 107°F)
- 7 days/yr
- Hot days in 30 yrs
- 22 days/yr
Wind risk 2/10 · Minimal
- Chance of severe wind over 30 yrs
- 1.0%
Air-quality risk 4/10 · Minor
- Unhealthy air days now
- 5 days/yr
- Unhealthy air days in 30 yrs
- 6 days/yr
Risk factors via First Street. Map © Google.
Why this score? — see what drove the C grade
The composite is a weighted blend of 9 inputs, each scored 0–100. Each bar is that input's sub-score; the figure is the points it added to the 100-point composite (weight × sub-score).
- Cash flow +30.0/30.0
- 1% rule +10.0/10.0
- DSCR +10.0/10.0
- Rent growth +2.5/5.0
- Livability +2.5/5.0
- Condition / age +2.5/5.0
- Schools +1.2/10.0
- ARV discount +0.0/15.0
- Appreciation +0.0/10.0
$69,900
🖨 Deal sheet (PDF) 📄 Offer letter ✓ Due diligence
Listing remarks MLS
Buyer financing fell through - You have a second chance! This beautifully maintained home is truly move-in ready, offering peace of mind with updated systems and a newer roof. The functional kitchen provides a practical and welcoming space for everyday living, while the spacious finished basement adds incredible versatility—perfect for a family room, home office, gym, or all three. Enjoy the abundance of extra living space downstairs, giving you room to spread out and make it your own. Step outside to a nice, flat backyard—ideal for entertaining, play, or relaxation—complete with a rear deck that’s perfect for morning coffee or evening gatherings. A well-cared-for home with space, comfort, and flexibility—ready for its next owner to enjoy. Agent Owned.
Key facts
- 3,811 sq ft lot
- Built 1924
- Listed 71 days
Neighborhood map
What this means for you Summary
Snapshot
- This is a 3-bed/1.0-bath single-family listed at $70k.
Deal economics
- At list price, monthly cash flow is $491 ($6k/yr) — positive.
- The deal already cash-flows at list — no discount required.
- Meets the 1% rule at list price ($1k rent vs $70k).
- Recommended offer: $66k (6.0% below list) — sets the bar for market timing.
- Cap rate 14.7% vs local median 5.0% in St. Louis — top-decile yield for the area; either an underpriced asset or a hidden risk that comps aren't pricing in. Stress-test before assuming the spread holds.
Location & tenants
- Location reads: area grade C — affects rentability + tenant quality, not the cash-flow math above.
- St. Louis City (urban): math 10% / reading 18% proficiency, ranked #312 of 324 in MO (top 96%) — low school quality limits family demand, transient renter base, plan for 1-2y turnover; 80% free/reduced lunch — lower-income household profile, screen leases tightly.
- Market conditions: 57 active listings in the ZIP; 14 comparable units currently listed for rent nearby; rentals at typical pace (median 25d on market — plan ~3-4 weeks tenant-placement turnaround); lower-income renter base — watch delinquency; 294 units permitted in St. Louis city in 2024 (227 in 5+ unit buildings).
- This rent runs 33% of the median local income ($41k/yr) — at the standard rent-burdened threshold; future hikes will face affordability resistance.
Forward outlook
- Local home prices are declining (-3.0%/yr); year-one equity from $483 of loan paydown is wiped out by about $2k of value loss. Plan a longer hold.
- St. Louis County population projected to shrink 6% by 2050 — rents likely to lag national; underwrite the cash flow, not the appreciation.
- At projected returns (-3.0% appreciation + 3.0% rent growth), your $20k cash investment doubles in ~4 years — after that, you're playing with house money.
Negotiation context
- It's been on market 72 days — a 6% lower offer ($66k) is reasonable based on typical stale-listing flexibility.
- 2 sale attempts; this cycle's ask has dropped $14k (17%) from the opening price — seller is motivated, your offer sets the floor, not the list.
- Current owner paid $22k; list at $70k implies a 218% gain — meaningful room to come down on a strong offer.
Risks & watch-outs
- Watch-outs: built in 1924 — expect roof / HVAC / electrical / plumbing capex.
- Climate carrying-cost: major flood risk; extreme-heat days projected 7→22/yr by 2055 (HVAC capex compounding) — expect insurance premiums to compound above CPI over the hold.
Questions for the listing agent
- It's been on market 72 days. Have you received any prior offers? Is the seller open to a 6% concession, seller financing, or rate buy-down credit?
- Built in 1924 — when were the roof, HVAC, electrical panel, plumbing, and water heater last replaced?
- Why hasn't it sold? Are there any deal-killer items the seller is aware of (foundation, flood, title, zoning, code violations)?
- Is there a deadline driving the sale (1031 exchange, divorce, estate, relocation)? That informs how much negotiation room exists.
- What's the average days-on-market for RENTAL listings here right now (not sales)? A rising rental-DOM trend means longer vacancies and softer asking-rent achievability than the comps imply.
- What's the recent tenant-quality profile in this submarket — average credit score on applications, eviction rate, late-payment / NSF rate, and stable-employment percentage? A property-management company in the area should have these aggregated.
- How much new for-sale + rental construction is in the pipeline within 1–3 miles? Heavy new supply typically softens prices + rents 12–24 months out; constrained supply supports both.
Investment metrics
- 1% rule
- 1.64% ✓
- Cap rate
- 14.72%
- Cash-on-cash
- 30.09%
- DSCR
- 2.34
- GRM
- 5.1
CMA / ARV
- ARV (median comp)
- $53,187
- List price
- $69,900
- Delta
- 31.42%
- Verdict
- OVERPRICED
- Comps
- 20 within 1.0 mi
Show comp detail 6 sales within ~0.75 mi
| Address | Dist | Beds/Ba | Sqft | Sold | Price | $/sf | Match |
|---|---|---|---|---|---|---|---|
| 8572 Oriole Ave | 0.65mi | 3/1.0 | 768 (0%) | 15mo | $34,999 | $46 | 57 |
| 1256 Gimblin St | 0.57mi | 3/1.0 | 800 (+4%) | 12mo | $67,000 | $84 | 56 |
| 1266 Lynfield Pl | 0.51mi | 2/1.0 (-1) | 840 (+9%) | 18mo | $52,000 | $62 | 41 |
| 1239 Peggy Ct | 0.53mi | 3/2.0 | 876 (+14%) | 10mo | $102,900 | $117 | 39 |
| 1227 Peggy Ct | 0.51mi | 3/1.0 | 876 (+14%) | 20mo | $14,000 | $16 | 36 |
| 8536 Partridge Ave | 0.75mi | 2/1.0 (-1) | 868 (+13%) | 11mo | $119,900 | $138 | 30 |
Match score weights: distance 35% · size 25% · config 20% · recency 20%. Top-matched comps best support the ARV.
Projected returns pro-forma
-3.0% appreciation · 3.0% rent growth · sell at horizon
- IRR
- 24.7%
- Equity multiple
- 2.02×
- Total profit
- $19,909
- Equity at exit
- $10,422
- IRR
- 32.4%
- Equity multiple
- 3.94×
- Total profit
- $57,492
- Equity at exit
- $6,044
Cash invested: $19,572 (down + closing). Projections, not guarantees.
Landlord ↔ Tenant lean methodology
- Overall (STATE)
- 81 Strongly Landlord-Friendly
- State Missouri
- 81 Strongly Landlord-Friendly · R+10
- County
- — inherits STATE
- City
- — inherits STATE
ZIP-level market 63147
- Home prices YoY
- -31.4%
- Active inventory
- 57
- Price-to-rent
- 5.1×
Monthly cashflow live
- Estimated rent
- $1,149 high interval (Pro) →
- Mortgage (P&I)
- −$367
- Tax from tax record
- −$21 /mo · $251/yr
- Insurance
- −$29
- HOA
- −$0
- Vacancy / Maint / Mgmt
- −$241
- Net cashflow
- $491
Break-even live
Sensitivity live
| Price | -10% $530 | -5% $511 | +0% $491 | +5% $471 | +10% $451 |
|---|---|---|---|---|---|
| Rent | -10% $400 | -5% $445 | +0% $491 | +5% $536 | +10% $582 |
| Rate | -1.0pp $526 | -0.5pp $509 | base $491 | +0.5pp $473 | +1.0pp $454 |
UW: 25.0% down · 7.5% · 30yr · 1.5% tax · 5.0% vac · 8.0% maint · 8.0% mgmt
Financing live
Cash to close
- Down payment
- $17,475
- Closing costs
- $2,097
- Reserves months
- —
- Total cash needed
- —
Loan-product check · same deal, 3 products live
Conventional
25% down · 7.5% · 30yr
- Down + closing
- —
- Monthly P&I
- —
- Monthly cashflow
- —
- DSCR
- —
- Eligible?
- —
Personal DTI + credit; lowest rate.
DSCR
20% down · 8.5% · 30yr
- Down + closing
- —
- Monthly P&I
- —
- Monthly cashflow
- —
- DSCR
- —
- Eligible?
- —
No personal income docs; deal must DSCR.
Hard money
10% down · 12.0% · 12mo
- Down + closing
- —
- Monthly P&I
- —
- Monthly cashflow
- —
- DSCR
- —
- Eligible?
- —
Short-term bridge; refi at stabilization.
Rent comps 14 comps
| Address | Beds | Baths | Sqft | Rent | $/sqft | DOM | Units | Dist |
|---|---|---|---|---|---|---|---|---|
| 8612 Halls Ferry Rd Saint Louis, MO | 1.0–2.0 | 1.0 | 625 | $775 | $1.24 | 5d | 2 | 0.61mi |
| 8530 Lowell St Saint Louis, MO | 2.0 | 1.0 | 918 | $1,100 | $1.20 | 44d | 1 | 0.69mi |
| 8548 Drury Ln Saint Louis, MO | 3.0 | 2.0 | 1107 | $1,420 | $1.28 | 44d | 1 | 0.98mi |
| 605 Fremont Ave Saint Louis, MO | 2.0 | 1.0 | 750 | $995 | $1.33 | 44d | 1 | 1.02mi |
| 5931 Emma Ave Saint Louis, MO | 2.0 | 1.0 | 880 | $1,200 | $1.36 | 44d | 1 | 1.30mi |
| 5932 Floy Ave Saint Louis, MO | 3.0 | 1.0 | 1080 | $1,373 | $1.27 | 21d | 1 | 1.34mi |
| 5955 Floy Ave Saint Louis, MO | 2.0 | 1.0 | 1032 | $1,050 | $1.02 | 4d | 1 | 1.35mi |
| 960 Raford Ct St. Louis, MO | 2.0 | 1.0 | 750 | $950 | $1.27 | 24d | 1 | 1.37mi |
| 5756 Floy Ave Saint Louis, MO | 2.0 | 1.0 | 1080 | $995 | $0.92 | 44d | 1 | 1.40mi |
| 5574 Era Ave Saint Louis, MO | 3.0 | 1.0 | 850 | $1,400 | $1.65 | 13d | 1 | 1.42mi |
| 5741 Floy Ave Saint Louis, MO | 2.0 | 1.0 | 1000 | $1,100 | $1.10 | 24d | 1 | 1.44mi |
| 2056 Coleridge Dr Saint Louis, MO | 3.0 | 1.0 | 949 | $1,195 | $1.26 | 24d | 1 | 1.45mi |
| 5721 Floy Ave Saint Louis, MO | 2.0 | 1.0 | 1032 | $1,120 | $1.09 | 24d | 1 | 1.45mi |
| 5546 Floy Ave Saint Louis, MO | 2.0 | 2.0 | 850 | $1,273 | $1.50 | 21d | 1 | 1.49mi |
Listing history 23 events
-
2026-06-21days on market $69,900 Active 72 DOM
-
2026-06-19price $69,900 Active 69 DOM
-
2026-06-18days on market $72,000 Active 69 DOM
-
2026-06-17days on market $72,000 Active 68 DOM
-
2026-06-16days on market $72,000 Active 67 DOM
-
2026-06-15days on market $72,000 Active 66 DOM
-
2026-06-13days on market $72,000 Active 64 DOM
-
2026-06-09days on market $72,000 Active 60 DOM
-
2026-06-08days on market $72,000 Active 59 DOM
-
2026-06-08days on market $72,000 Active 58 DOM
-
2026-06-05pricedays on market $72,000 Active 55 DOM
-
2026-06-03days on market $75,000 Active 54 DOM
-
2026-06-02days on market $75,000 Active 53 DOM
-
2026-06-01days on market $75,000 Active 52 DOM
-
2026-05-31days on market $75,000 Active 51 DOM
-
2026-04-29status Active 793-char remark
Show marketing remark (793 chars)
Buyer financing fell through - You have a second chance! This beautifully maintained home is truly move-in ready, offering peace of mind with updated systems and a newer roof. The functional kitchen provides a practical and welcoming space for everyday living, while the spacious finished basement adds incredible versatility—perfect for a family room, home office, gym, or all three. Enjoy the abundance of extra living space downstairs, giving you room to spread out and make it your own. Step outside to a nice, flat backyard—ideal for entertaining, play, or relaxation—complete with a rear deck that’s perfect for morning coffee or evening gatherings. A well-cared-for home with space, comfort, and flexibility—ready for its next owner to enjoy. Agent Owned.
-
2026-04-21status Pending 793-char remark
Show marketing remark (793 chars)
Buyer financing fell through - You have a second chance! This beautifully maintained home is truly move-in ready, offering peace of mind with updated systems and a newer roof. The functional kitchen provides a practical and welcoming space for everyday living, while the spacious finished basement adds incredible versatility—perfect for a family room, home office, gym, or all three. Enjoy the abundance of extra living space downstairs, giving you room to spread out and make it your own. Step outside to a nice, flat backyard—ideal for entertaining, play, or relaxation—complete with a rear deck that’s perfect for morning coffee or evening gatherings. A well-cared-for home with space, comfort, and flexibility—ready for its next owner to enjoy. Agent Owned.
-
2026-04-03$84,000 Active 793-char remark
Show marketing remark (793 chars)
Buyer financing fell through - You have a second chance! This beautifully maintained home is truly move-in ready, offering peace of mind with updated systems and a newer roof. The functional kitchen provides a practical and welcoming space for everyday living, while the spacious finished basement adds incredible versatility—perfect for a family room, home office, gym, or all three. Enjoy the abundance of extra living space downstairs, giving you room to spread out and make it your own. Step outside to a nice, flat backyard—ideal for entertaining, play, or relaxation—complete with a rear deck that’s perfect for morning coffee or evening gatherings. A well-cared-for home with space, comfort, and flexibility—ready for its next owner to enjoy. Agent Owned.
-
2026-04-02historical $84,000 793-char remark
Show marketing remark (793 chars)
Buyer financing fell through - You have a second chance! This beautifully maintained home is truly move-in ready, offering peace of mind with updated systems and a newer roof. The functional kitchen provides a practical and welcoming space for everyday living, while the spacious finished basement adds incredible versatility—perfect for a family room, home office, gym, or all three. Enjoy the abundance of extra living space downstairs, giving you room to spread out and make it your own. Step outside to a nice, flat backyard—ideal for entertaining, play, or relaxation—complete with a rear deck that’s perfect for morning coffee or evening gatherings. A well-cared-for home with space, comfort, and flexibility—ready for its next owner to enjoy. Agent Owned.
-
1997-10-29soldstatus
-
1997-10-29soldstatus
-
1993-04-21soldstatus
-
1993-03-15soldstatus $22,000
ⓘ Source: listings_history table (triggers on properties + properties_extension) + one-shot
backfill from property_details.listing_events for pre-trigger history.
Tax reassessment forecast MO · Resets to sale price
- Current annual tax
- $251 · $21/mo
- Projected year-2 tax
- $678 · $57/mo
- Expected delta
- +$427/yr (+$36/mo · 169.6%)
ⓘ Screening estimate from a state-policy table — verify with the county assessor before closing.
Climate risk First Street
- Flood 6/10 Major FEMA zone X (shaded) · 72% chance over 30 yrs
- Wildfire 1/10 Low
- Heat 5/10 Major 7 d/yr ≥107°F today · 22 d/yr by 30 yrs out
- Wind 2/10 Low 100% chance of damaging wind over 30 yrs
- Air quality 4/10 Moderate 5 unhealthy d/yr today · 6 by 30 yrs out
Nearby sold comps map
Loading sold comps map…
Walkable amenities ~0.75 mi
Loading nearby amenities…
Taxation est. · year 1
- Rental income
- $13,784
- − Mortgage interest
- −$3,915
- − Property taxes
- −$251
- − Insurance
- −$350
- − Repairs & maintenance
- −$1,103
- − Management
- −$1,103
- − Depreciation
- −$2,033
- Taxable income
- $5,029
- Est. tax owed @ 24.0%
- −$1,207
- After-tax cash flow
- $4,683/yr
For passive investors: Depreciation is non-cash, so a rental often shows a tax loss while cash-flowing — sheltering income. Rental losses are passive: they offset passive income freely, and up to $25,000/yr can offset ordinary (W-2) income if you actively participate and your MAGI is under $100k (phasing out to $0 by $150k); unused losses carry forward. On sale, claimed depreciation is recaptured at up to 25%, and gains may owe capital-gains tax (a 1031 exchange can defer both). Figures are a year-1 estimate at your 24.0% rate — not tax advice; consult a CPA.
Schools (NCES district)
- District
- St. Louis City
- NCES district ID
- 2929280
- Math proficiency
- 10% ▼ -6.00%
- Reading proficiency
- 18% ▼ -3.00%
- Median HH income
- $35,685
- Composite
- 11.54/100
- National rank
- #9699
- State rank
- #312 of 324 in MO
Livability — St. Louis
No livability data for this city. (Only ~50 U.S. cities are tracked.)
Census & demographics
- Census place
- St. Louis, MO
- County
- Saint Louis City · 254,015 people
- City population
- 283,259
- Metro
- St. Louis, MO-IL
- Population (ZIP)
- 8,173
- Household income
- $41,182
- Rent vs Own
- Severe rent burden
- 418.0
Population outlook (St. Louis County) Hauer SSP2
- Today (2025)
- 315,737 people
- By 2030
- 313,865 · -0.6%
- By 2040
- 305,439 · -3.3%
- By 2050
- 296,529 · -6.1%
- By 2075
- 271,028 · -14.2%
- By 2100
- 255,359 · -19.1%
Race, ethnicity, and origin ACS 2023
- Neighborhood character
- Predominantly Black (92%)
- Race & ethnicity
- Black 92% White 5% Two or more races 2%
- Foreign-born
- 0%
- Languages at home
- 99% English-only · Spanish 1%
Political lean MEDSL · St. Louis
- 2024 margin
- Solid D (+64.7) · D 81.4% · R 16.7% · Other 2.0%
- 2008→2024 swing
- -3.5pp toward R · 2008: 68.2pp · 2024: 64.7pp
- All cycles
- 2024: D+64.7 2020: D+66.2 2016: D+63.7 2012: D+66.6 2008: D+68.2
Not yet ingested
- Civics
- —
Market trends
- HPI YoY
- ▼ -38.51%
- Current HPI
- 84.224
- Rent YoY
- —
- Metro
- St. Louis, MO-IL
- State GDP YoY
- ▲ 1.84%
- F500 in state
- 20
Industry mix (Fortune 500 HQ in MO)
| Industry | F500 HQs | Revenue |
|---|---|---|
| Healthcare | 1 | $163B |
|
||
| Insurance | 1 | $21B |
|
||
| Industrial Technology | 1 | $17B |
|
||
| Retail | 1 | $16B |
|
||
| Industrial Distribution | 1 | $10B |
|
||
| Utilities | 1 | $9B |
|
||
Price history
+281.8% since first listed8 events — show timeline
- 2026-04-29 Relisted — MARIS as Distributed by MLS Grid
- 2026-04-21 Pending — MARIS as Distributed by MLS Grid
- 2026-04-03 Listed $84,000 MARIS as Distributed by MLS Grid
- 2026-04-02 Coming Soon $84,000 MARIS as Distributed by MLS Grid
- 1997-10-29 Sold (Public Records) — Public Records
- 1997-10-29 Sold (Public Records) — Public Records
- 1993-04-21 Sold (Public Records) — Public Records
- 1993-03-15 Sold (Public Records) $22,000 Public Records
Property tax history
-1.4%/yrLatest (2024): $251 · +4.6% YoY. Source: county tax records.
Cash-flow waterfall
monthlySold comps — $/sqft
last 12 mo · ≤1 miLoading sold comps…