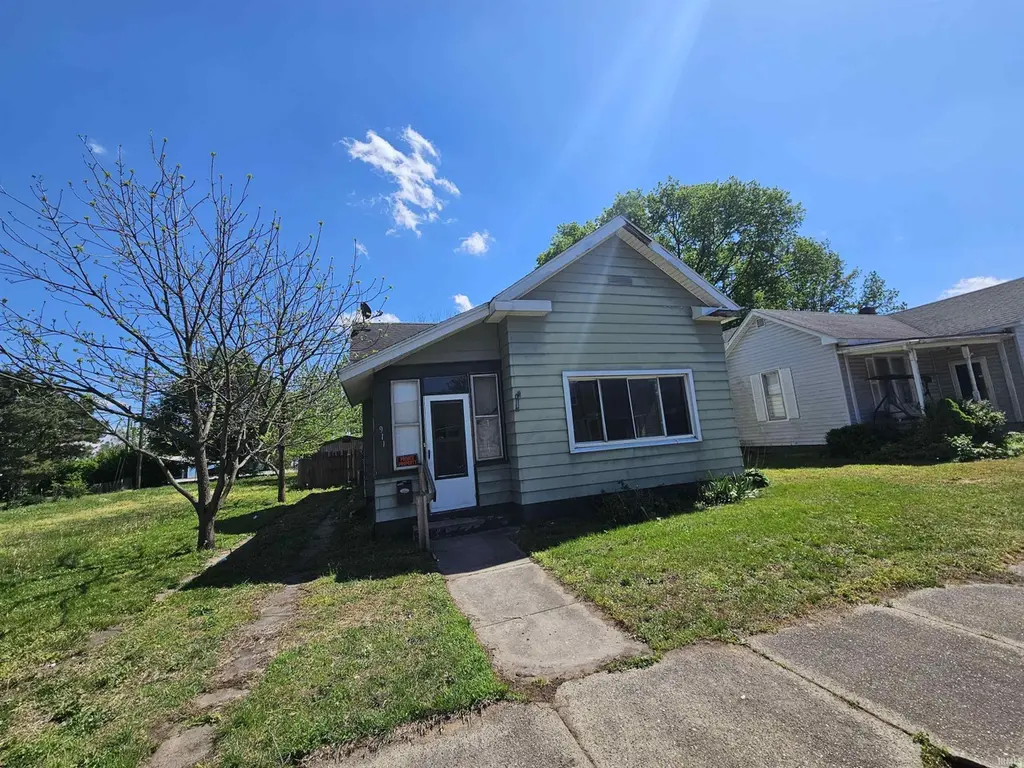
911 N 9th St · Vincennes, IN
Flood risk 3/10 · Minor
- FEMA flood zone
- —
- Chance of flooding over 30 yrs
- 0.14%
- Est. flood insurance / yr
- —
Fire risk 1/10 · Minimal
- Est. fire insurance / yr
- $717 – $1,331
Heat risk 5/10 · Moderate
- Hot days now (above 106°F)
- 7 days/yr
- Hot days in 30 yrs
- 19 days/yr
Wind risk 2/10 · Minimal
- Chance of severe wind over 30 yrs
- 2.0%
Air-quality risk 3/10 · Minor
- Unhealthy air days now
- 2 days/yr
- Unhealthy air days in 30 yrs
- 3 days/yr
Risk factors via First Street. Map © Google.
Why this score? — see what drove the B- grade
The composite is a weighted blend of 9 inputs, each scored 0–100. Each bar is that input's sub-score; the figure is the points it added to the 100-point composite (weight × sub-score).
- Cash flow +30.0/30.0
- 1% rule +10.0/10.0
- DSCR +10.0/10.0
- ARV discount +7.5/15.0
- Livability +3.5/5.0
- Schools +3.0/10.0
- Rent growth +2.5/5.0
- Condition / age +2.5/5.0
- Appreciation +0.0/10.0
$39,900
🖨 Deal sheet 📄 Offer letter ✓ Due diligence
Listing remarks MLS
This is a 2-3 bedroom home in the middle of Vincennes. The home has larger rooms, main floor laundry, an eat in kitchen, and enclosed front and back porches. The home has a fenced in backyard and storage building. This is an REO property and the condition is unknown. The home is priced accordingly for the work needed.
Key facts
- Eat in kitchen
- Fenced in backyard
- Storage building
Tags
Neighborhood map
What this means for you Summary
Snapshot
- This is a 2-bed/1.0-bath single-family listed at $40k.
Deal economics
- At list price, monthly cash flow is $525 ($6k/yr) — positive.
- The deal already cash-flows at list — no discount required.
- Meets the 1% rule at list price ($975 rent vs $40k).
- Recommended offer: $39k (1.5% below list) — sets the bar for market timing.
- Cap rate 22.1% vs local median 5.1% in Vincennes — top-decile yield for the area; either an underpriced asset or a hidden risk that comps aren't pricing in. Stress-test before assuming the spread holds.
Location & tenants
- Location reads 70/100 on livability (#148 in IN) — a middle-class / working-renter tenant base. Strengths: cost of living A+, housing A+, health & safety A+; Watch: schools D, amenities F, commute F.
- Vincennes Community School Corporation (town): math 34% / reading 38% proficiency, ranked #193 of 301 in IN (top 64%) — families likely to look elsewhere, expect single-tenant / working-renter base with shorter leases.
- Market conditions: 136 active listings in the ZIP; 1 comparable units currently listed for rent nearby; 36 units permitted in Knox County in 2024 (0 in 5+ unit buildings).
Forward outlook
- Local home prices are declining (-3.0%/yr); year-one equity from $276 of loan paydown is wiped out by about $1k of value loss. Plan a longer hold.
- Knox County population projected at -13% by 2050 — secular population decline; favor cash flow + early exit over multi-decade hold.
- At projected returns (-3.0% appreciation + 3.0% rent growth), your $11k cash investment doubles in ~3 years — after that, you're playing with house money.
Negotiation context
- It's been on market 27 days — a 2% lower offer ($39k) is reasonable based on typical stale-listing flexibility.
Risks & watch-outs
- Watch-outs: built in 1896 — expect roof / HVAC / electrical / plumbing capex.
- Climate carrying-cost: extreme-heat days projected 7→19/yr by 2055 (HVAC capex compounding) — expect insurance premiums to compound above CPI over the hold.
Questions for the listing agent
- Built in 1896 — when were the roof, HVAC, electrical panel, plumbing, and water heater last replaced?
- Is there a deadline driving the sale (1031 exchange, divorce, estate, relocation)? That informs how much negotiation room exists.
- Schools are D-rated, which usually means shorter tenancies and higher turnover. Who's the typical renter profile here, and what's been the actual vacancy rate?
- What's the average days-on-market for RENTAL listings here right now (not sales)? A rising rental-DOM trend means longer vacancies and softer asking-rent achievability than the comps imply.
- What's the recent tenant-quality profile in this submarket — average credit score on applications, eviction rate, late-payment / NSF rate, and stable-employment percentage? A property-management company in the area should have these aggregated.
- How much new for-sale + rental construction is in the pipeline within 1–3 miles? Heavy new supply typically softens prices + rents 12–24 months out; constrained supply supports both.
Investment metrics
- 1% rule
- 2.44% ✓
- Cap rate
- 22.07%
- Cash-on-cash
- 56.35%
- DSCR
- 3.51
- GRM
- 3.4
CMA / ARV
- ARV (median comp)
- $109,800
- List price
- $39,900
- Delta
- -63.66%
- Verdict
- UNDERPRICED
- Comps
- 20 within 1.0 mi
Show comp detail 12 sales within ~0.75 mi
| Address | Dist | Beds/Ba | Sqft | Sold | Price | $/sf | Match |
|---|---|---|---|---|---|---|---|
| 911 N 9th St | 0.00mi | 3/1.0 (+1) | 1,296 (0%) | 1mo | $27,500 | $21 | 94 |
| 1303 N Upper 11th St | 0.31mi | 2/1.5 | 1,298 (+0%) | 1mo | $121,000 | $93 | 83 |
| 914 N 9th St | 0.02mi | 2/1.5 | 1,186 (-8%) | 4mo | $73,501 | $62 | 80 |
| 1007 N 10th St | 0.09mi | 3/1.0 (+1) | 1,384 (+7%) | 3mo | $115,000 | $83 | 77 |
| 917 Hart St | 0.22mi | 3/2.0 (+1) | 1,357 (+5%) | 2mo | $105,000 | $77 | 71 |
| 1218 Mckinley Ave | 0.65mi | 2/1.0 | 1,206 (-7%) | 0mo | $185,000 | $153 | 58 |
| 923 Buntin St | 0.37mi | 2/1.0 | 1,125 (-13%) | 7mo | $52,000 | $46 | 54 |
| 1704 Indiana Ave | 0.52mi | 2/1.0 | 1,128 (-13%) | 4mo | $130,000 | $115 | 51 |
| 204 Carolina Dr | 0.61mi | 3/2.0 (+1) | 1,400 (+8%) | 2mo | $225,000 | $161 | 47 |
| 208 S 10th St | 0.70mi | 3/1.0 (+1) | 1,179 (-9%) | 2mo | $79,900 | $68 | 45 |
| 1313 Broadway St | 0.55mi | 3/2.0 (+1) | 1,422 (+10%) | 8mo | $149,900 | $105 | 43 |
| 862 Ridgeway Ave | 0.71mi | 3/2.0 (+1) | 1,188 (-8%) | 2mo | $159,000 | $134 | 42 |
Match score weights: distance 35% · size 25% · config 20% · recency 20%. Top-matched comps best support the ARV.
Projected returns pro-forma
-3.0% appreciation · 3.0% rent growth · sell at horizon
- IRR
- 54.7%
- Equity multiple
- 3.41×
- Total profit
- $26,941
- Equity at exit
- $5,949
- IRR
- 59.8%
- Equity multiple
- 6.95×
- Total profit
- $66,466
- Equity at exit
- $3,450
Cash invested: $11,172 (down + closing). Projections, not guarantees.
Landlord ↔ Tenant lean methodology
- Overall (STATE)
- 90 Strongly Landlord-Friendly
- State Indiana
- 90 Strongly Landlord-Friendly · R+11
- County
- — inherits STATE
- City
- — inherits STATE
ZIP-level market 47591
- Home prices YoY
- -19.5%
- Active inventory
- 136
- Price-to-rent
- 3.4×
Monthly cashflow live
- Estimated rent
- $975 medium interval (Pro) →
- Mortgage (P&I)
- −$209
- Tax from tax record
- −$20 /mo · $238/yr
- Insurance
- −$17
- HOA
- −$0
- Vacancy / Maint / Mgmt
- −$205
- Net cashflow
- $525
Break-even live
UW: 25.0% down · 7.5% · 30yr · 1.5% tax · 5.0% vac · 8.0% maint · 8.0% mgmt
Financing live
Cash to close
- Down payment
- $9,975
- Closing costs
- $1,197
- Reserves months
- —
- Total cash needed
- —
Loan-product check · same deal, 3 products live
Conventional
25% down · 7.5% · 30yr
- Down + closing
- —
- Monthly P&I
- —
- Monthly cashflow
- —
- DSCR
- —
- Eligible?
- —
Personal DTI + credit; lowest rate.
DSCR
20% down · 8.5% · 30yr
- Down + closing
- —
- Monthly P&I
- —
- Monthly cashflow
- —
- DSCR
- —
- Eligible?
- —
No personal income docs; deal must DSCR.
Hard money
10% down · 12.0% · 12mo
- Down + closing
- —
- Monthly P&I
- —
- Monthly cashflow
- —
- DSCR
- —
- Eligible?
- —
Short-term bridge; refi at stabilization.
Rent comps 1 comps
| Address | Beds | Baths | Sqft | Rent | $/sqft | DOM | Units | Dist |
|---|---|---|---|---|---|---|---|---|
| 721 N 7th St Unit A Vincennes, IN | 2.0 | 1.0 | 1000 | $975 | $0.97 | 43d | 1 | 0.17mi |
Listing history 2 events
-
2026-05-13status Pending 352-char remark
Show marketing remark (352 chars)
This is a 2-3 bedroom home in the middle of Vincennes. The home has larger rooms, main floor laundry, an eat in kitchen, and enclosed front and back porches. The home has a fenced in backyard and storage building. This is an REO property and the condition is unknown. The home is priced accordingly for the work needed.
-
2026-04-16$39,900 Active 352-char remark
Show marketing remark (352 chars)
This is a 2-3 bedroom home in the middle of Vincennes. The home has larger rooms, main floor laundry, an eat in kitchen, and enclosed front and back porches. The home has a fenced in backyard and storage building. This is an REO property and the condition is unknown. The home is priced accordingly for the work needed.
ⓘ Source: listings_history table (triggers on properties + properties_extension) + one-shot
backfill from property_details.listing_events for pre-trigger history.
Tax reassessment forecast IN · Partial reset (capped growth)
- Current annual tax
- $238 · $20/mo
- Projected year-2 tax
- $288 · $24/mo
- Expected delta
- +$51/yr (+$4/mo · 21.3%)
ⓘ Screening estimate from a state-policy table — verify with the county assessor before closing.
Climate risk First Street
- Flood 3/10 Moderate 14% chance over 30 yrs
- Wildfire 1/10 Low
- Heat 5/10 Major 7 d/yr ≥106°F today · 19 d/yr by 30 yrs out
- Wind 2/10 Low 2% chance of damaging wind over 30 yrs
- Air quality 3/10 Moderate 2 unhealthy d/yr today · 3 by 30 yrs out
Nearby sold comps map
Loading sold comps map…
Walkable amenities ~0.75 mi
Loading nearby amenities…
Taxation est. · year 1
- Rental income
- $11,700
- − Mortgage interest
- −$2,235
- − Property taxes
- −$238
- − Insurance
- −$200
- − Repairs & maintenance
- −$936
- − Management
- −$936
- − Depreciation
- −$1,161
- Taxable income
- $5,995
- Est. tax owed @ 24.0%
- −$1,439
- After-tax cash flow
- $4,856/yr
For passive investors: Depreciation is non-cash, so a rental often shows a tax loss while cash-flowing — sheltering income. Rental losses are passive: they offset passive income freely, and up to $25,000/yr can offset ordinary (W-2) income if you actively participate and your MAGI is under $100k (phasing out to $0 by $150k); unused losses carry forward. On sale, claimed depreciation is recaptured at up to 25%, and gains may owe capital-gains tax (a 1031 exchange can defer both). Figures are a year-1 estimate at your 24.0% rate — not tax advice; consult a CPA.
Schools (NCES district)
- District
- Vincennes Community School Corporation
- NCES district ID
- 1812120
- Math proficiency
- 34% ▼ -5.00%
- Reading proficiency
- 38% ▼ -4.00%
- Median HH income
- $38,359
- Composite
- 30.05/100
- National rank
- #6354
- State rank
- #193 of 301 in IN
Livability — Vincennes
- Score
- 70/100
- State rank
- #148
- US rank
- #7480
Category grades
Schools grade is shown separately in the Schools card above.
Census & demographics
- Census place
- Vincennes, IN
- Population (ZIP)
- 25,191
Population outlook (Knox County) Hauer SSP2
- Today (2025)
- 37,092 people
- By 2030
- 36,271 · -2.2%
- By 2040
- 34,196 · -7.8%
- By 2050
- 32,405 · -12.6%
- By 2075
- 28,754 · -22.5%
- By 2100
- 24,110 · -35.0%
Race, ethnicity, and origin ACS 2023
- Neighborhood character
- Predominantly White (88%)
- Race & ethnicity
- White 88% Two or more races 6% Hispanic / Latino 3% Black 2% Asian 1%
- Common ancestry
- Lithuanian 4% Romanian 2% Slovak 2%
- Foreign-born
- 3% · Canada, China
- Languages at home
- 95% English-only · Spanish 2% French/Haitian/Cajun 1% Chinese 1%
Political lean MEDSL · Knox
- 2024 margin
- Solid R (+50.4) · D 24.0% · R 74.4% · Other 1.6%
- 2008→2024 swing
- -43.9pp toward R · 2008: -6.5pp · 2024: -50.4pp
- All cycles
- 2024: R+50.4 2020: R+47.4 2016: R+47.2 2012: R+28.9 2008: R+6.5
Not yet ingested
- Civics
- —
Market trends
- HPI YoY
- ▼ -47.26%
- Current HPI
- 194.903
- Rent YoY
- —
- Metro
- —
- State GDP YoY
- ▲ 2.90%
- F500 in state
- 18
Industry mix (Fortune 500 HQ in IN)
| Industry | F500 HQs | Revenue |
|---|---|---|
| Industrial Machinery | 2 | $37B |
|
||
| Healthcare | 1 | $177B |
|
||
| Pharmaceuticals | 1 | $45B |
|
||
| Metals / Steel | 1 | $18B |
|
||
| Agriculture | 1 | $17B |
|
||
| Packaging | 1 | $12B |
|
||
Price history
2 events — show timeline
- 2026-05-13 Pending — IRMLS
- 2026-04-16 Listed $39,900 IRMLS
Property tax history
-3.7%/yrLatest (2024): $238 · -66.8% YoY. Source: county tax records.
Cash-flow waterfall
monthlySold comps — $/sqft
last 12 mo · ≤1 miLoading sold comps…