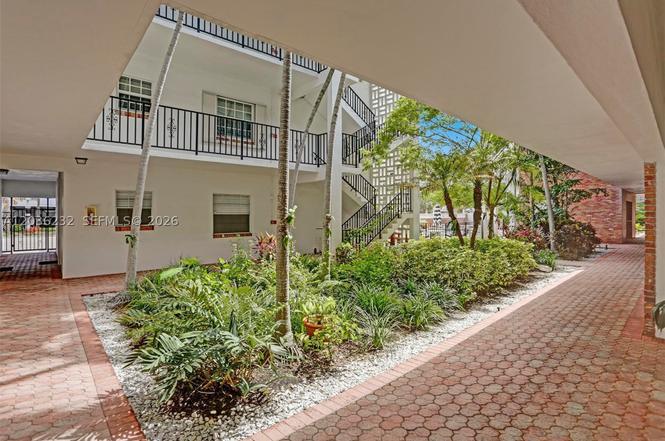
2500 NE 9th St #111 · Fort Lauderdale, FL
Flood risk No data
- FEMA flood zone
- —
- Chance of flooding over 30 yrs
- —
- Est. flood insurance / yr
- —
Fire risk No data
- Est. fire insurance / yr
- —
Heat risk No data
- Hot days now (above threshold)
- —
- Hot days in 30 yrs
- —
Wind risk No data
- Chance of severe wind over 30 yrs
- —
Air-quality risk No data
- Unhealthy air days now
- —
- Unhealthy air days in 30 yrs
- —
Risk factors via First Street. Map © Google.
Why this score? — see what drove the D grade
The composite is a weighted blend of 9 inputs, each scored 0–100. Each bar is that input's sub-score; the figure is the points it added to the 100-point composite (weight × sub-score).
- Cash flow +11.8/30.0
- ARV discount +7.5/15.0
- 1% rule +6.8/10.0
- Schools +4.1/10.0
- Livability +4.1/5.0
- DSCR +3.5/10.0
- Rent growth +3.2/5.0
- Condition / age +2.5/5.0
- Appreciation +0.0/10.0
$199,000
🖨 Deal sheet (PDF) 📄 Offer letter ✓ Due diligence
Listing remarks
Perfect Fort Lauderdale Beach Pied-à-Terre! Meticulously maintained and fully furnished 1-bedroom, 1.5-bathroom condo, in an over-55 gated community just steps from Fort Lauderdale Beach. This first-floor unit features hurricane impact windows, newer A/C system, and spacious kitchen. The versatile layout includes a Murphy bed for guests, making it the ideal beach getaway or seasonal retreat. Enjoy the sparkling community pool and the unbeatable walkable location just moments from Galleria Mall, Publix, CVS, Starbucks, George English Park, Hugh Taylor Birch State Park, Bonnet House, and an array of top-rated restaurants and cafés. With everything you need right at your doorstep
Key facts
- Community pool
- Spacious kitchen
- Murphy bed
Tags
Property features AI
Finance
- Financial info: Pets not allowed
- HOA & community: Monthly association fee; Association amenities include laundry and pool; Association covers management, common areas, laundry, grounds maintenance, structure maintenance, parking, pool(s), trash and water; Senior community
Exterior
- Parking: Assigned detached garage parking; Guest parking available; One covered parking space (garage)
- Security: Complex fenced; Smoke detectors
- Utilities: Cable available
- Home design: Attached property; 3 stories; Entry on level 1; North-facing
- Construction: Block construction; Effective year built
- Exterior features: Courtyard; Association pool
Interior
- Kitchen: Electric range; Microwave; Refrigerator
- Bedrooms: Bedroom on main level
- Flooring: Ceramic tile
- Bathrooms: 1 full bathroom; 1 half bathroom
- Heating & cooling: Central air conditioning
- Interior features: Blinds on windows; First-floor entry; Living/dining room; Tub with shower
- Laundry & utility: Common area laundry
Neighborhood map
What this means for you Summary
Snapshot
- This is a 1-bed/2.0-bath condo listed at $199k.
Deal economics
- At list price, monthly cash flow is $-53 ($-639/yr) — negative.
- To cash-flow at today's rent, offer at most $190k (4.7% below list).
- Meets the 1% rule at list price ($2k rent vs $199k).
- Recommended offer: $190k (4.7% below list) — sets the bar for cash-flow.
- Cap rate 6.0% vs local median 2.2% in Fort Lauderdale — top-decile yield for the area; either an underpriced asset or a hidden risk that comps aren't pricing in. Stress-test before assuming the spread holds.
Location & tenants
- Location reads 82/100 on livability (#78 in FL, #1,293 nationally) — a professional / high-income tenant draw. Strengths: crime A+, amenities A+, health & safety A+; Watch: cost of living D-.
- Broward (suburban): math 42% / reading 53% proficiency, ranked #46 of 73 in FL (top 63%) — families likely to look elsewhere, expect single-tenant / working-renter base with shorter leases.
- Zoned schools: Nova Blanche Forman Elementary (math 35% / reading 55%, grade D-, #1,271 of 2,144 statewide, top 60%, 769 students, 72% FRL); Nova Middle School (math 44% / reading 53%, grade C-, #274 of 571 statewide, top 50%, 1,284 students, 68% FRL); Fort Lauderdale High School (math 38% / reading 67%, grade C-, #154 of 667 statewide, top 24%, 2,228 students, 57% FRL).
- Market conditions: Rents rising (+2.8%/yr); 630 active listings in the ZIP; 40 comparable units currently listed for rent nearby; rentals at typical pace (median 22d on market — plan ~3-4 weeks tenant-placement turnaround); solid renter incomes; 2,111 units permitted in Broward County in 2024 (1,265 in 5+ unit buildings).
- This rent runs 33% of the median local income ($85k/yr) — at the standard rent-burdened threshold; future hikes will face affordability resistance.
Forward outlook
- Local home prices are declining (-3.0%/yr); year-one equity from $1k of loan paydown is wiped out by about $6k of value loss. Plan a longer hold.
- Broward County population projected at +34% by 2050 — long-run rental-demand tailwind backs the buy-and-hold thesis.
Negotiation context
- Only 5 days on market — expect competitive offers; lowballing is unlikely to land.
- 8 sale attempts since 8y ago with the ask held roughly flat each time — persistent listings suggest the price (not the market) is what's stuck; bring a comps-based counter.
- Current owner paid $128k; list at $199k implies a 55% gain — meaningful room to come down on a strong offer.
Questions for the listing agent
- What do current leases actually rent for vs. the listed asking? Can we see a recent rent roll and the last 12 months of T-12 income?
- Built in 1968 — when were the roof, HVAC, electrical panel, plumbing, and water heater last replaced?
- What does the HOA fee cover, when was the last increase, and are there any pending special assessments or reserve-fund shortfalls?
- Any open or pending special assessments — roof, HVAC, plumbing, elevator, façade? What's the per-unit balance and payoff schedule, and is the seller paying it off at close or rolling it to the buyer?
- Is there a deadline driving the sale (1031 exchange, divorce, estate, relocation)? That informs how much negotiation room exists.
- Schools are B-rated — typically a magnet for longer-tenancy family renters. What's the average tenant stay here, and is there a school-zone premium baked into asking?
- The area grade is low — what's the realistic commute time and amenity access for the typical tenant pool here? Any planned neighborhood developments (good or bad) we should know about?
- What's the average days-on-market for RENTAL listings here right now (not sales)? A rising rental-DOM trend means longer vacancies and softer asking-rent achievability than the comps imply.
- What's the recent tenant-quality profile in this submarket — average credit score on applications, eviction rate, late-payment / NSF rate, and stable-employment percentage? A property-management company in the area should have these aggregated.
- How much new apartment / multifamily construction is in the pipeline within 1–3 miles? Heavy new supply (>2% of stock underway) typically softens rents 12–24 months out; light construction supports rent growth.
Investment metrics
- 1% rule
- 1.18% ✓
- Cap rate
- 5.97%
- Cash-on-cash
- -1.15%
- DSCR
- 0.95
- GRM
- 7.1
CMA / ARV
No comps found within radius.
Projected returns pro-forma
-3.0% appreciation · 2.75% rent growth · sell at horizon
- IRR
- -18.3%
- Equity multiple
- 0.36×
- Total profit
- $-35,865
- Equity at exit
- $29,672
- IRR
- -10.9%
- Equity multiple
- 0.34×
- Total profit
- $-36,528
- Equity at exit
- $17,206
Cash invested: $55,720 (down + closing). Projections, not guarantees.
Landlord ↔ Tenant lean methodology
- Overall (STATE)
- 87 Strongly Landlord-Friendly
- State Florida
- 87 Strongly Landlord-Friendly · R+3
- County
- — inherits STATE
- City
- — inherits STATE
ZIP-level market 33304
- Rents YoY
- 2.8%
- Active inventory
- 630
- Price-to-rent
- 7.1×
Monthly cashflow live
- Estimated rent
- $2,351 high interval (Pro) →
- Mortgage (P&I)
- −$1,044
- Tax from tax record
- −$364 /mo · $4,371/yr
- Insurance
- −$83
- HOA
- −$420
- Vacancy / Maint / Mgmt
- −$494
- Net cashflow
- $-53
Break-even live
Sensitivity live
| Price | -10% $59 | -5% $3 | +0% $-53 | +5% $-110 | +10% $-166 |
|---|---|---|---|---|---|
| Rent | -10% $-239 | -5% $-146 | +0% $-53 | +5% $40 | +10% $132 |
| Rate | -1.0pp $47 | -0.5pp $-3 | base $-53 | +0.5pp $-105 | +1.0pp $-157 |
UW: 25.0% down · 7.5% · 30yr · 1.5% tax · 5.0% vac · 8.0% maint · 8.0% mgmt
Financing live
Cash to close
- Down payment
- $49,750
- Closing costs
- $5,970
- Reserves months
- —
- Total cash needed
- —
Loan-product check · same deal, 3 products live
Conventional
25% down · 7.5% · 30yr
- Down + closing
- —
- Monthly P&I
- —
- Monthly cashflow
- —
- DSCR
- —
- Eligible?
- —
Personal DTI + credit; lowest rate.
DSCR
20% down · 8.5% · 30yr
- Down + closing
- —
- Monthly P&I
- —
- Monthly cashflow
- —
- DSCR
- —
- Eligible?
- —
No personal income docs; deal must DSCR.
Hard money
10% down · 12.0% · 12mo
- Down + closing
- —
- Monthly P&I
- —
- Monthly cashflow
- —
- DSCR
- —
- Eligible?
- —
Short-term bridge; refi at stabilization.
Rent comps 40 comps
| Address | Beds | Baths | Sqft | Rent | $/sqft | DOM | Units | Dist |
|---|---|---|---|---|---|---|---|---|
| 2424 NE 9th St Fort Lauderdale, FL | 1.0–2.0 | 1.5–2.0 | 1000 | $2,700 | $2.70 | 0d | 2 | 0.05mi |
| 2424 NE 9th St Fort Lauderdale, FL | 1.0–2.0 | 1.5–2.0 | 1000 | $2,200 | $2.20 | 5d | 3 | 0.05mi |
| 2424 NE 9th St Fort Lauderdale, FL | 1.0–2.0 | 1.5–2.0 | 1000 | $2,200 | $2.20 | 26d | 3 | 0.05mi |
| 888 Intracoastal Dr Fort Lauderdale, FL | 1.0 | 1.5–2.0 | 955 | $2,400 | $2.51 | 26d | 2 | 0.20mi |
| 2670 E Sunrise Blvd #1428 Fort Lauderdale, FL | 1.0 | 1.0 | 585 | $1,589 | $2.72 | 26d | 1 | 0.29mi |
| 1030 Seminole Dr Fort Lauderdale, FL | 1.0–2.0 | 1.0–2.0 | 1442 | $2,895 | $2.01 | 0d | 34 | 0.31mi |
| 741 Bayshore Dr Unit 16N Fort Lauderdale, FL | 1.0 | 1.0 | 565 | $2,400 | $4.25 | 7d | 1 | 0.31mi |
| 1040 Seminole Dr Unit 1406 Fort Lauderdale, FL | 1.0 | 1.0 | 917 | $3,143 | $3.43 | 26d | 1 | 0.32mi |
| 815 Middle River Dr #203 Fort Lauderdale, FL | 1.0 | 1.0 | 660 | $1,900 | $2.88 | 21d | 1 | 0.32mi |
| 2555 NE 11th St Fort Lauderdale, FL | 1.0–2.0 | 1.0 | 840 | $1,550 | $1.85 | 26d | 2 | 0.32mi |
| 2555 NE 11th St #502 Fort Lauderdale, FL | 2.0 | 1.0 | 970 | $2,200 | $2.27 | 19d | 1 | 0.32mi |
| 2555 NE 11th St #9 Fort Lauderdale, FL | 2.0 | 1.0 | 970 | $2,400 | $2.47 | 18d | 1 | 0.32mi |
| 815 Middle River Dr Fort Lauderdale, FL | 1.0 | 1.0 | 555 | $1,850 | $3.33 | 0d | 2 | 0.33mi |
| 2800 E Sunrise Blvd Unit 19D Fort Lauderdale, FL | 1.0 | 1.5 | 1000 | $3,250 | $3.25 | 4d | 1 | 0.36mi |
| 625 Antioch Ave #407 Fort Lauderdale, FL | 1.0 | 1.0 | 670 | $2,200 | $3.28 | 4d | 1 | 0.37mi |
| 624 Antioch Ave Fort Lauderdale, FL | 2.0 | 1.0 | 880 | $2,575 | $2.93 | 26d | 2 | 0.39mi |
| 720 Orton Ave Fort Lauderdale, FL | 1.0–2.0 | 1.0 | 750 | $2,100 | $2.80 | 26d | 2 | 0.42mi |
| 619 Orton Ave #302 Fort Lauderdale, FL | 1.0 | 1.5 | 828 | $2,100 | $2.54 | 26d | 1 | 0.43mi |
| 624 Orton Ave #19 Fort Lauderdale, FL | 1.0 | 1.0 | 691 | $2,200 | $3.18 | 26d | 1 | 0.44mi |
| 901 N Birch Rd Fort Lauderdale, FL | 1.0 | 1.0 | 550 | $2,300 | $4.18 | 7d | 1 | 0.45mi |
| 2727 Yacht Club Blvd Unit 2A Fort Lauderdale, FL | 2.0 | 2.0 | 1030 | $2,800 | $2.72 | 20d | 1 | 0.47mi |
| 1911 NE 8th Ct Fort Lauderdale, FL | 1.0 | 1.0 | 650 | $1,650 | $2.54 | 26d | 1 | 0.47mi |
| 511 Bayshore Dr #206 Fort Lauderdale, FL | 1.0 | 1.5 | 928 | $3,000 | $3.23 | 26d | 1 | 0.48mi |
| 511 Bayshore Dr #206 Fort Lauderdale, FL | 1.0 | 1.5 | 928 | $3,000 | $3.23 | 0d | 1 | 0.48mi |
| 1160 N Federal Hwy #315 Fort Lauderdale, FL | 1.0 | 1.0 | 900 | $1,950 | $2.17 | 26d | 1 | 0.49mi |
| 508 Antioch Ave #1 Fort Lauderdale, FL | 1.0 | 1.0 | 748 | $2,500 | $3.34 | 26d | 1 | 0.50mi |
| 801 NE 19th Ave Unit B Fort Lauderdale, FL | 2.0 | 1.0 | 1000 | $2,000 | $2.00 | 26d | 1 | 0.51mi |
| 600 N Birch Rd Unit 605H Fort Lauderdale, FL | 1.0 | 1.0 | 668 | $2,000 | $2.99 | 26d | 1 | 0.52mi |
| 3000 E Sunrise Blvd Fort Lauderdale, FL | 1.0–2.0 | 1.5–2.0 | 1024 | $2,300 | $2.25 | 13d | 3 | 0.52mi |
| 524 Orton Ave #201 Fort Lauderdale, FL | 2.0 | 2.0 | 855 | $3,000 | $3.51 | 9d | 1 | 0.52mi |
| 524 Orton Ave Fort Lauderdale, FL | 2.0 | 2.0 | 927 | $2,798 | $3.02 | 3d | 2 | 0.53mi |
| 3003 Terramar St #1002 Fort Lauderdale, FL | 1.0 | 1.0 | 860 | $2,400 | $2.79 | 26d | 1 | 0.53mi |
| 905 Sunrise Ln Unit 905 Fort Lauderdale, FL | 1.0 | 1.0 | 1010 | $2,000 | $1.98 | 26d | 1 | 0.58mi |
| 3114 E Sunrise Blvd Fort Lauderdale, FL | 2.0 | 1.0 | 1000 | $4,500 | $4.50 | 26d | 1 | 0.58mi |
| 401 N Birch Rd Fort Lauderdale, FL | 1.0–3.0 | 1.0–3.5 | 1401 | $4,000 | $2.85 | 3d | 11 | 0.61mi |
| 401 N Birch Rd Fort Lauderdale, FL | 1.0–3.0 | 1.0–3.5 | 1401 | $4,200 | $3.00 | 20d | 13 | 0.61mi |
| 401 N Birch Rd Fort Lauderdale, FL | 1.0–3.0 | 1.0–3.5 | 1401 | $4,000 | $2.85 | 3d | 11 | 0.61mi |
| 3000 Riomar St Fort Lauderdale, FL | 1.0 | 1.0 | 640 | $2,250 | $3.52 | 4d | 2 | 0.63mi |
| 1045 NE 18th Ave #304 Fort Lauderdale, FL | — | 1.0 | 528 | $2,100 | $3.98 | 9d | 1 | 0.64mi |
| 1045 NE 18th Ave #304 Fort Lauderdale, FL | — | 1.0 | 528 | $2,100 | $3.98 | 26d | 1 | 0.64mi |
HOA detail condo
- Monthly dues
- $420 · $5,040/yr
- Likely covers
- poolsecurity
- Assessments
- None detected in remarks — confirm with the listing agent.
Listing history 4 events
-
2026-06-21days on market $199,000 Active 5 DOM
-
2026-06-18days on market $199,000 Active 2 DOM
-
2026-06-16remarks 685-char remark
-
2026-06-16$199,000 Active 1 DOM
ⓘ Source: listings_history table (triggers on properties + properties_extension) + one-shot
backfill from property_details.listing_events for pre-trigger history.
Tax reassessment forecast FL · Resets to sale price
- Current annual tax
- $4,371 · $364/mo
- Projected year-2 tax
- $4,371 · $364/mo
- Expected delta
- $0/yr ($0/mo · 0.0%)
ⓘ Screening estimate from a state-policy table — verify with the county assessor before closing.
Nearby sold comps map
Loading sold comps map…
Walkable amenities ~0.75 mi
Loading nearby amenities…
Taxation est. · year 1
- Rental income
- $28,214
- − Mortgage interest
- −$11,147
- − Property taxes
- −$4,371
- − Insurance
- −$995
- − Repairs & maintenance
- −$2,257
- − Management
- −$2,257
- − HOA
- −$5,040
- − Depreciation
- −$5,789
- Taxable loss
- −$3,642
- Est. tax savings @ 24.0%
- +$874
- After-tax cash flow
- $235/yr
For passive investors: Depreciation is non-cash, so a rental often shows a tax loss while cash-flowing — sheltering income. Rental losses are passive: they offset passive income freely, and up to $25,000/yr can offset ordinary (W-2) income if you actively participate and your MAGI is under $100k (phasing out to $0 by $150k); unused losses carry forward. On sale, claimed depreciation is recaptured at up to 25%, and gains may owe capital-gains tax (a 1031 exchange can defer both). Figures are a year-1 estimate at your 24.0% rate — not tax advice; consult a CPA.
Schools (NCES district)
- District
- Broward
- NCES district ID
- 1200180
- Math proficiency
- 42% ▼ -18.00%
- Reading proficiency
- 53% ▼ -5.00%
- Median HH income
- $52,139
- Composite
- 40.88/100
- National rank
- #3621
- State rank
- #46 of 73 in FL
Livability — Fort Lauderdale
- Score
- 82/100
- State rank
- #78
- US rank
- #1293
Category grades
Schools grade is shown separately in the Schools card above.
Census & demographics
- Census place
- Fort Lauderdale, FL
- County
- Broward County · 1,963,430 people
- City population
- 235,769
- Metro
- Miami-Fort Lauderdale-Pompano Beach, FL
- Population (ZIP)
- 18,332
- Household income
- $84,920
- Rent vs Own
- Severe rent burden
- 1534.0
Population outlook (Broward County) Hauer SSP2
- Today (2025)
- 2,207,033 people
- By 2030
- 2,360,704 · +7.0%
- By 2040
- 2,661,208 · +20.6%
- By 2050
- 2,946,698 · +33.5%
- By 2075
- 3,602,273 · +63.2%
- By 2100
- 3,970,984 · +79.9%
Race, ethnicity, and origin ACS 2023
- Neighborhood character
- Diverse neighborhood (Simpson 0.63)
- Race & ethnicity
- White 56% Hispanic / Latino 19% Two or more races 17% Black 13% Asian 4%
- Hispanic origin (detail)
- Mexican 2% Puerto Rican 4% Cuban 3%
- Common ancestry
- Hispanic 5% Scotch-Irish 3% Romanian 2%
- Foreign-born
- 32% · Canada, Jamaica, Vietnam
- Languages at home
- 61% English-only · Spanish 20% Other Indo-European 6% French/Haitian/Cajun 5%
Political lean MEDSL · Broward
- 2024 margin
- D (+17.0) · D 58.0% · R 41.0%
- 2008→2024 swing
- -17.8pp toward R · 2008: 34.7pp · 2024: 17.0pp
- All cycles
- 2024: D+17.0 2020: D+29.8 2016: D+35.0 2012: D+34.9 2008: D+34.7
Not yet ingested
- Civics
- —
Market trends
- HPI YoY
- ▼ -522.22%
- Current HPI
- 348.0065
- Rent YoY
- ▲ 2.75%
- Metro
- Miami-Fort Lauderdale-Pompano Beach, FL
- State GDP YoY
- ▲ 3.28%
- F500 in state
- 36
Industry mix (Fortune 500 HQ in FL)
| Industry | F500 HQs | Revenue |
|---|---|---|
| Industrial Technology | 2 | $29B |
|
||
| Insurance | 2 | $17B |
|
||
| Retail | 1 | $60B |
|
||
| Technology Distribution | 1 | $58B |
|
||
| Homebuilding | 1 | $35B |
|
||
| Technology Manufacturing | 1 | $35B |
|
||
Price history
+637.0% since first listed29 events — show timeline
- 2026-06-16 Listed $199,000 MARMLS
- 2026-04-09 Listing Removed — MARMLS
- 2025-10-01 Rental Removed $1,500 MARMLS
- 2025-08-02 Listed for Rent $1,500 MARMLS
- 2025-06-26 Price Changed $249,900 MARMLS
- 2025-04-21 Listed $260,000 MARMLS
- 2024-09-12 Listing Removed — MARMLS
- 2024-08-29 Rental Removed $1,490 MARMLS
- 2024-08-26 Price Changed $1,490 MARMLS
- 2024-07-31 Price Changed $1,590 MARMLS
- 2024-07-03 Listed for Rent $1,700 MARMLS
- 2024-06-06 Price Changed $229,000 MARMLS
- 2024-05-17 Listed $235,000 MARMLS
- 2024-04-18 Listing Removed — MARMLS
- 2023-10-26 Listed $255,000 MARMLS
- 2022-11-02 Listing Removed — MARMLS
- 2022-09-27 Listed $265,000 MARMLS
- 2018-12-21 Sold (MLS) $128,000 MARMLS
- 2018-12-19 Sold (Public Records) $128,000 Public Records
- 2018-09-20 Price Changed $140,000 MARMLS
- 2018-09-16 Price Changed $145,000 MARMLS
- 2018-09-13 Price Changed $149,900 MARMLS
- 2018-09-04 Price Changed $150,000 MARMLS
- 2018-09-01 Price Changed $159,900 MARMLS
- 2018-08-18 Listed $160,000 MARMLS
- 2011-02-24 Sold (Public Records) $87,000 Public Records
- 1991-06-19 Sold (Public Records) $49,090 Public Records
- 1991-06-19 Sold (Public Records) $45,000 Public Records
- 1975-05-01 Sold (Public Records) $27,000 Public Records
Property tax history
+14.2%/yrLatest (2025): $4,371 · -6.0% YoY. Source: county tax records.
Cash-flow waterfall
monthlySold comps — $/sqft
last 12 mo · ≤1 miLoading sold comps…