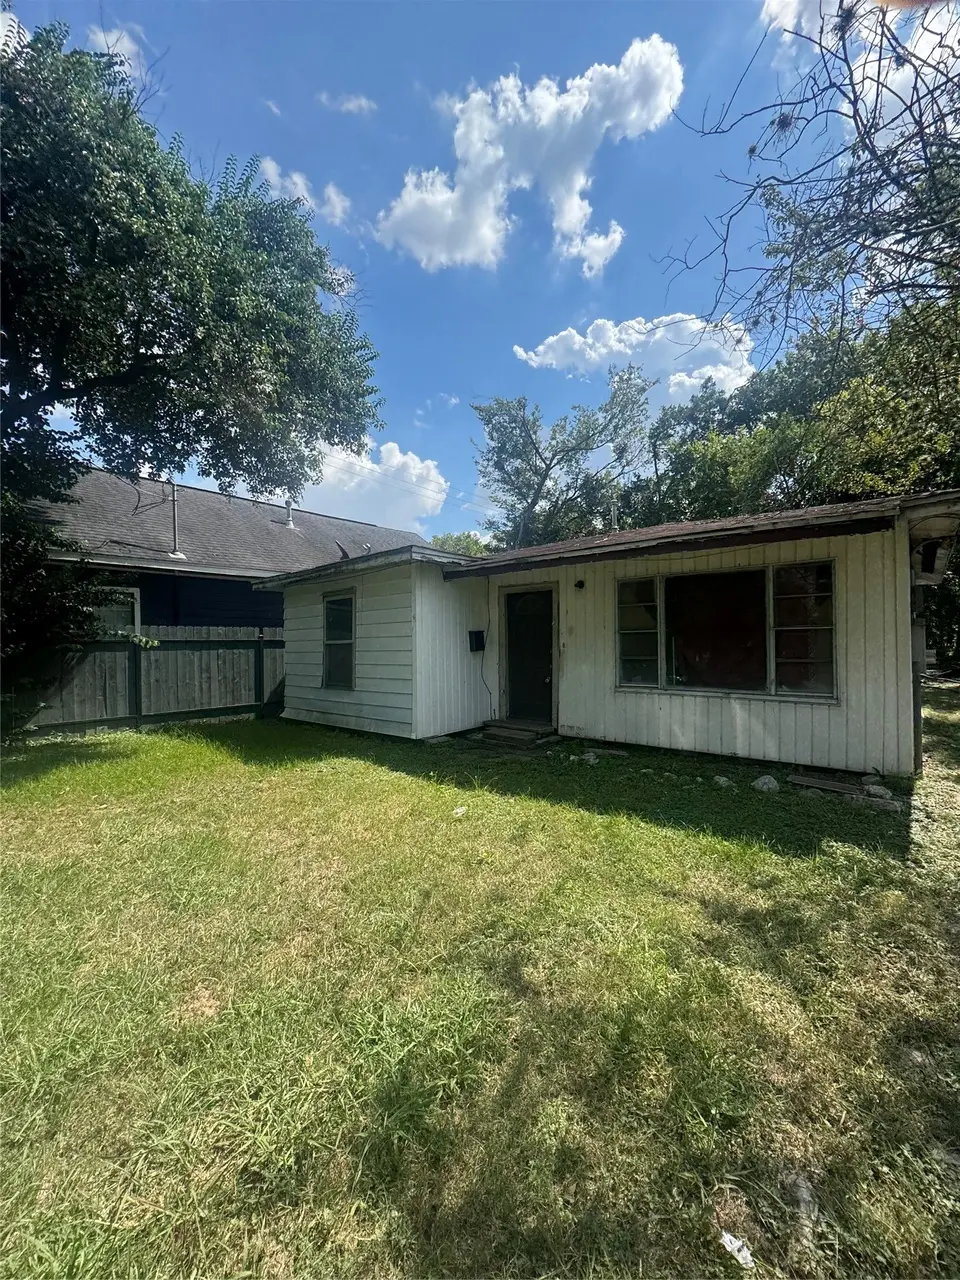
3018 Cactus St · Houston, TX
Flood risk 6/10 · Moderate
- FEMA flood zone
- AE
- Chance of flooding over 30 yrs
- 0.71%
- Est. flood insurance / yr
- $1,737 – $8,500
Fire risk 1/10 · Minimal
- Est. fire insurance / yr
- $1,222 – $2,270
Heat risk 9/10 · Severe
- Hot days now (above 109°F)
- 7 days/yr
- Hot days in 30 yrs
- 23 days/yr
Wind risk 9/10 · Severe
- Chance of severe wind over 30 yrs
- 99.0%
Air-quality risk 3/10 · Minor
- Unhealthy air days now
- 2 days/yr
- Unhealthy air days in 30 yrs
- 3 days/yr
Risk factors via First Street. Map © Google.
Why this score? — see what drove the A- grade
The composite is a weighted blend of 9 inputs, each scored 0–100. Each bar is that input's sub-score; the figure is the points it added to the 100-point composite (weight × sub-score).
- Cash flow +30.0/30.0
- ARV discount +15.0/15.0
- 1% rule +10.0/10.0
- DSCR +10.0/10.0
- Appreciation +6.9/10.0
- Livability +3.7/5.0
- Rent growth +3.3/5.0
- Schools +2.7/10.0
- Condition / age +2.5/5.0
$64,900
🖨 Deal sheet 📄 Offer letter ✓ Due diligence
Listing remarks MLS
Prime Location Near Downtown Houston!Discover the potential at 3018 Cactus Rd, Houston, TX — the perfect spot to build new or remodel just minutes from Downtown. Surrounded by new development and revitalized homes, this property offers a great opportunity to create your ideal home or investment project. Enjoy quick access to major highways, Midtown, East Downtown, and the University of Houston. Excellent opportunity for builders, investors, or buyers looking for a central location with growing value and convenience to city amenities.Schedule your private showing and see the potential for yourself!
Key facts
- 3,489 sq ft lot
- Built 1958
- Listed 251 days
Tags
Neighborhood map
What this means for you Summary
Snapshot
- This is a 3-bed/1.0-bath single-family listed at $65k.
Deal economics
- At list price, monthly cash flow is $-14 ($-169/yr) — negative.
- To cash-flow at today's rent, offer at most $62k (3.8% below list).
- Meets the 1% rule at list price ($1k rent vs $65k).
- Recommended offer: $57k (12.0% below list) — sets the bar for market timing.
- Cap rate 13.9% vs local median 3.2% in Houston — top-decile yield for the area; either an underpriced asset or a hidden risk that comps aren't pricing in. Stress-test before assuming the spread holds.
Location & tenants
- Location reads 74/100 on livability (#184 in TX, #4,771 nationally) — a middle-class / working-renter tenant base. Strengths: amenities A+, cost of living A+, housing A+; Watch: schools D, crime F.
- Houston ISD (urban): math 27% / reading 35% proficiency, ranked #593 of 826 in TX (top 72%) — families likely to look elsewhere, expect single-tenant / working-renter base with shorter leases; 71% free/reduced lunch — lower-income household profile, screen leases tightly.
- Market conditions: Rents rising (+3.1%/yr); 445 active listings in the ZIP; 24 comparable units currently listed for rent nearby; rentals lingering (median 44d on market — plan ~5-8 weeks vacancy on turnover, expect pricing pressure); 54% of comp listings sitting > 30 days — soft ceiling on asking rent; lower-income renter base — watch delinquency; 29,883 units permitted in Harris County in 2024 (8,621 in 5+ unit buildings).
- This rent runs 34% of the median local income ($39k/yr) — at the standard rent-burdened threshold; future hikes will face affordability resistance.
Forward outlook
- In year one you build about $3k of equity ($449 loan paydown + $3k appreciation (3.9% local appreciation)).
- Harris County population projected at +47% by 2050 — long-run rental-demand tailwind backs the buy-and-hold thesis.
- At projected returns (3.9% appreciation + 3.1% rent growth), your $18k cash investment doubles in ~6 years — after that, you're playing with house money.
Negotiation context
- It's been on market 251 days — a 12% lower offer ($57k) is reasonable based on typical stale-listing flexibility.
Risks & watch-outs
- Watch-outs: flood insurance adds $427/mo; built in 1958 — expect roof / HVAC / electrical / plumbing capex.
- Climate carrying-cost: in FEMA flood zone AE (mandatory federal flood insurance); severe wind risk, 99% chance of damaging wind over 30y; extreme-heat days projected 7→23/yr by 2055 (HVAC capex compounding) — expect insurance premiums to compound above CPI over the hold.
Questions for the listing agent
- What do current leases actually rent for vs. the listed asking? Can we see a recent rent roll and the last 12 months of T-12 income?
- It's been on market 251 days. Have you received any prior offers? Is the seller open to a 12% concession, seller financing, or rate buy-down credit?
- Built in 1958 — when were the roof, HVAC, electrical panel, plumbing, and water heater last replaced?
- What's the actual annual flood-insurance premium (NFIP or private), and is the property in a SFHA with mandatory coverage?
- Why hasn't it sold? Are there any deal-killer items the seller is aware of (foundation, flood, title, zoning, code violations)?
- Is there a deadline driving the sale (1031 exchange, divorce, estate, relocation)? That informs how much negotiation room exists.
- Schools are D-rated, which usually means shorter tenancies and higher turnover. Who's the typical renter profile here, and what's been the actual vacancy rate?
- Crime grade is F in this area — have there been break-ins, vandalism, or insurance claims at this property in the last 3 years? What carrier currently insures it and at what premium?
- What's the average days-on-market for RENTAL listings here right now (not sales)? A rising rental-DOM trend means longer vacancies and softer asking-rent achievability than the comps imply.
- What's the recent tenant-quality profile in this submarket — average credit score on applications, eviction rate, late-payment / NSF rate, and stable-employment percentage? A property-management company in the area should have these aggregated.
- How much new for-sale + rental construction is in the pipeline within 1–3 miles? Heavy new supply typically softens prices + rents 12–24 months out; constrained supply supports both.
Investment metrics
- 1% rule
- 1.71% ✓
- Cap rate
- 13.92%
- Cash-on-cash
- 27.24%
- DSCR
- 2.21
- GRM
- 4.9
CMA / ARV
- ARV (median comp)
- $122,145
- List price
- $64,900
- Delta
- -46.87%
- Verdict
- UNDERPRICED
- Comps
- 20 within 1.0 mi
Show comp detail 10 sales within ~0.75 mi
| Address | Dist | Beds/Ba | Sqft | Sold | Price | $/sf | Match |
|---|---|---|---|---|---|---|---|
| 3011 Retta St | 0.38mi | 3/1.0 | 792 (-5%) | 6mo | $85,000 | $107 | 69 |
| 3114 Kentucky St St | 0.44mi | 2/1.0 (-1) | 900 (+8%) | 17mo | $177,900 | $198 | 47 |
| 4010 Falls St | 0.59mi | 2/1.0 (-1) | 890 (+7%) | 12mo | $216,500 | $243 | 46 |
| 2705 Brewster St | 0.46mi | 2/1.0 (-1) | 720 (-14%) | 6mo | $85,000 | $118 | 46 |
| 4313 Engleford St | 0.74mi | 3/1.0 | 900 (+8%) | 11mo | $139,900 | $155 | 44 |
| 2902 Gregg St | 0.32mi | 2/2.0 (-1) | 720 (-14%) | 16mo | $153,000 | $213 | 40 |
| 3804 Lila St | 0.51mi | 2/2.0 (-1) | 732 (-12%) | 11mo | $120,000 | $164 | 38 |
| 2306 Staples St | 0.70mi | 2/1.0 (-1) | 912 (+9%) | 13mo | $135,000 | $148 | 36 |
| 3825 Ranch St | 0.63mi | 2/1.0 (-1) | 774 (-7%) | 23mo | $185,000 | $239 | 34 |
| 2315 Bringhurst St | 0.69mi | 2/1.0 (-1) | 930 (+11%) | 12mo | $59,000 | $63 | 34 |
Match score weights: distance 35% · size 25% · config 20% · recency 20%. Top-matched comps best support the ARV.
Projected returns pro-forma
3.89% appreciation · 3.08% rent growth · sell at horizon
- IRR
- 9.5%
- Equity multiple
- 1.57×
- Total profit
- $10,421
- Equity at exit
- $32,499
- IRR
- 11.7%
- Equity multiple
- 2.94×
- Total profit
- $35,175
- Equity at exit
- $52,834
Cash invested: $18,172 (down + closing). Projections, not guarantees.
Landlord ↔ Tenant lean methodology
- Overall (STATE)
- 87 Strongly Landlord-Friendly
- State Texas
- 87 Strongly Landlord-Friendly · R+5
- County
- — inherits STATE
- City
- — inherits STATE
ZIP-level market 77026
- Home prices YoY
- 1.5%
- Rents YoY
- 3.1%
- Active inventory
- 445
- Price-to-rent
- 4.9×
Monthly cashflow live
- Estimated rent
- $1,113 high interval (Pro) →
- Mortgage (P&I)
- −$340
- Tax from tax record
- −$99 /mo · $1,189/yr
- Insurance
- −$27
- Flood insurance flood zone
- −$427 /mo · $5,118/yr
- HOA
- −$0
- Vacancy / Maint / Mgmt
- −$234
- Net cashflow
- $-14
Break-even live
UW: 25.0% down · 7.5% · 30yr · 1.5% tax · 5.0% vac · 8.0% maint · 8.0% mgmt
Financing live
Cash to close
- Down payment
- $16,225
- Closing costs
- $1,947
- Reserves months
- —
- Total cash needed
- —
Loan-product check · same deal, 3 products live
Conventional
25% down · 7.5% · 30yr
- Down + closing
- —
- Monthly P&I
- —
- Monthly cashflow
- —
- DSCR
- —
- Eligible?
- —
Personal DTI + credit; lowest rate.
DSCR
20% down · 8.5% · 30yr
- Down + closing
- —
- Monthly P&I
- —
- Monthly cashflow
- —
- DSCR
- —
- Eligible?
- —
No personal income docs; deal must DSCR.
Hard money
10% down · 12.0% · 12mo
- Down + closing
- —
- Monthly P&I
- —
- Monthly cashflow
- —
- DSCR
- —
- Eligible?
- —
Short-term bridge; refi at stabilization.
Rent comps 24 comps
| Address | Beds | Baths | Sqft | Rent | $/sqft | DOM | Units | Dist |
|---|---|---|---|---|---|---|---|---|
| 3019 Florida St Houston, TX | 2.0 | 1.0 | 576 | $950 | $1.65 | 43d | 1 | 0.35mi |
| 1710 Shelby St Houston, TX | 2.0 | 1.0 | 688 | $1,250 | $1.82 | 43d | 1 | 0.73mi |
| 4203 Hirsch Rd Unit 5 Houston, TX | 2.0 | 1.0 | 758 | $950 | $1.25 | 43d | 1 | 0.74mi |
| 3502 Campbell St Houston, TX | 2.0 | 1.0 | 725 | $800 | $1.10 | 43d | 1 | 0.76mi |
| 4111 Cavalcade St Unit 5 Houston, TX | 2.0 | 1.0 | 757 | $825 | $1.09 | 43d | 1 | 0.76mi |
| 3031 Sumpter St Unit 50 Houston, TX | 2.0 | 1.0 | 732 | $1,200 | $1.64 | 24d | 1 | 0.91mi |
| 3805 Wipprecht St Houston, TX | 2.0 | 1.0 | 768 | $1,100 | $1.43 | 18d | 1 | 1.00mi |
| 3813 Wipprecht St Houston, TX | 2.0 | 1.0 | 750 | $1,200 | $1.60 | 24d | 1 | 1.00mi |
| 1714 Mary St Houston, TX | 2.0 | 2.0 | 1100 | $2,400 | $2.18 | 43d | 1 | 1.18mi |
| 2209 Gano St Unit 4 Houston, TX | 2.0 | 1.0 | 700 | $1,250 | $1.79 | 43d | 1 | 1.22mi |
| 2209 Gano St Unit 3 Houston, TX | 2.0 | 1.0 | 700 | $1,200 | $1.71 | 43d | 1 | 1.22mi |
| 3730 Lyons Ave Unit 216 Houston, TX | 3.0 | 2.0 | 1107 | $1,300 | $1.17 | 43d | 1 | 1.26mi |
| 2202 Solo St Houston, TX | 2.0 | 1.0 | 620 | $1,200 | $1.94 | 43d | 1 | 1.38mi |
| 4903 Noble St Houston, TX | 2.0 | 1.0 | 525 | $1,200 | $2.29 | 43d | 1 | 1.39mi |
| 5436 Makeig St Houston, TX | 2.0 | 1.0 | 749 | $650 | $0.87 | 24d | 1 | 1.42mi |
| 5430 Makeig St Houston, TX | 2.0 | 1.0 | 749 | $650 | $0.87 | 24d | 1 | 1.42mi |
| 5462 Makeig St Houston, TX | 2.0 | 1.0 | 749 | $650 | $0.87 | 24d | 1 | 1.45mi |
| 5504 Morwood St Houston, TX | 2.0 | 1.0 | 749 | $850 | $1.13 | 24d | 1 | 1.45mi |
| 5506 Crane St Apt 2 Houston, TX | 2.0 | 1.0 | 800 | $750 | $0.94 | 43d | 1 | 1.47mi |
| 5510 Morwood St Houston, TX | 2.0 | 1.0 | 749 | $650 | $0.87 | 24d | 1 | 1.48mi |
| 5117 Lavender St Houston, TX | 2.0–3.0 | 1.0 | 780 | $1,090 | $1.40 | 19d | 2 | 1.48mi |
| 5117 Lavender St Houston, TX | 2.0 | 1.0 | 740 | $1,040 | $1.41 | 7d | 4 | 1.48mi |
| 5117 Lavender St Houston, TX | 2.0 | 1.0 | 740 | $1,065 | $1.44 | 15d | 8 | 1.48mi |
| 5514 Morgood St Houston, TX | 2.0 | 1.0 | 749 | $650 | $0.87 | 43d | 1 | 1.49mi |
Listing history 17 events
-
2026-06-18days on market $64,900 Active 251 DOM
-
2026-06-17days on market $64,900 Active 250 DOM
-
2026-06-16days on market $64,900 Active 249 DOM
-
2026-06-15days on market $64,900 Active 248 DOM
-
2026-06-13days on market $64,900 Active 246 DOM
-
2026-06-10days on market $64,900 Active 242 DOM
-
2026-06-08days on market $64,900 Active 241 DOM
-
2026-06-07days on market $64,900 Active 240 DOM
-
2026-06-04days on market $64,900 Active 237 DOM
-
2026-05-31days on market $64,900 Active 234 DOM
-
2026-05-13price $64,900 610-char remark
Show marketing remark (610 chars)
Prime Location Near Downtown Houston!Discover the potential at 3018 Cactus Rd, Houston, TX — the perfect spot to build new or remodel just minutes from Downtown. Surrounded by new development and revitalized homes, this property offers a great opportunity to create your ideal home or investment project. Enjoy quick access to major highways, Midtown, East Downtown, and the University of Houston. Excellent opportunity for builders, investors, or buyers looking for a central location with growing value and convenience to city amenities.Schedule your private showing and see the potential for yourself!
-
2026-05-07price $69,999 610-char remark
Show marketing remark (610 chars)
Prime Location Near Downtown Houston!Discover the potential at 3018 Cactus Rd, Houston, TX — the perfect spot to build new or remodel just minutes from Downtown. Surrounded by new development and revitalized homes, this property offers a great opportunity to create your ideal home or investment project. Enjoy quick access to major highways, Midtown, East Downtown, and the University of Houston. Excellent opportunity for builders, investors, or buyers looking for a central location with growing value and convenience to city amenities.Schedule your private showing and see the potential for yourself!
-
2026-04-20price $79,999 610-char remark
Show marketing remark (610 chars)
Prime Location Near Downtown Houston!Discover the potential at 3018 Cactus Rd, Houston, TX — the perfect spot to build new or remodel just minutes from Downtown. Surrounded by new development and revitalized homes, this property offers a great opportunity to create your ideal home or investment project. Enjoy quick access to major highways, Midtown, East Downtown, and the University of Houston. Excellent opportunity for builders, investors, or buyers looking for a central location with growing value and convenience to city amenities.Schedule your private showing and see the potential for yourself!
-
2026-01-24price $89,900 610-char remark
Show marketing remark (610 chars)
Prime Location Near Downtown Houston!Discover the potential at 3018 Cactus Rd, Houston, TX — the perfect spot to build new or remodel just minutes from Downtown. Surrounded by new development and revitalized homes, this property offers a great opportunity to create your ideal home or investment project. Enjoy quick access to major highways, Midtown, East Downtown, and the University of Houston. Excellent opportunity for builders, investors, or buyers looking for a central location with growing value and convenience to city amenities.Schedule your private showing and see the potential for yourself!
-
2025-11-07price $104,999 610-char remark
Show marketing remark (610 chars)
Prime Location Near Downtown Houston!Discover the potential at 3018 Cactus Rd, Houston, TX — the perfect spot to build new or remodel just minutes from Downtown. Surrounded by new development and revitalized homes, this property offers a great opportunity to create your ideal home or investment project. Enjoy quick access to major highways, Midtown, East Downtown, and the University of Houston. Excellent opportunity for builders, investors, or buyers looking for a central location with growing value and convenience to city amenities.Schedule your private showing and see the potential for yourself!
-
2025-10-09$110,000 Active 610-char remark
Show marketing remark (610 chars)
Prime Location Near Downtown Houston!Discover the potential at 3018 Cactus Rd, Houston, TX — the perfect spot to build new or remodel just minutes from Downtown. Surrounded by new development and revitalized homes, this property offers a great opportunity to create your ideal home or investment project. Enjoy quick access to major highways, Midtown, East Downtown, and the University of Houston. Excellent opportunity for builders, investors, or buyers looking for a central location with growing value and convenience to city amenities.Schedule your private showing and see the potential for yourself!
-
1993-02-28soldstatus
ⓘ Source: listings_history table (triggers on properties + properties_extension) + one-shot
backfill from property_details.listing_events for pre-trigger history.
Tax reassessment forecast TX · Resets to sale price
- Current annual tax
- $1,189 · $99/mo
- Projected year-2 tax
- $1,189 · $99/mo
- Expected delta
- $0/yr ($0/mo · 0.0%)
ⓘ Screening estimate from a state-policy table — verify with the county assessor before closing.
Climate risk First Street
- Flood 6/10 Major FEMA zone AE · 71% chance over 30 yrs
- Wildfire 1/10 Low
- Heat 9/10 Extreme 7 d/yr ≥109°F today · 23 d/yr by 30 yrs out
- Wind 9/10 Extreme 99% chance of damaging wind over 30 yrs
- Air quality 3/10 Moderate 2 unhealthy d/yr today · 3 by 30 yrs out
Nearby sold comps map
Loading sold comps map…
Walkable amenities ~0.75 mi
Loading nearby amenities…
Taxation est. · year 1
- Rental income
- $13,351
- − Mortgage interest
- −$3,635
- − Property taxes
- −$1,189
- − Insurance
- −$5,443
- − Repairs & maintenance
- −$1,068
- − Management
- −$1,068
- − Depreciation
- −$1,888
- Taxable loss
- −$940
- Est. tax savings @ 24.0%
- +$226
- After-tax cash flow
- $57/yr
For passive investors: Depreciation is non-cash, so a rental often shows a tax loss while cash-flowing — sheltering income. Rental losses are passive: they offset passive income freely, and up to $25,000/yr can offset ordinary (W-2) income if you actively participate and your MAGI is under $100k (phasing out to $0 by $150k); unused losses carry forward. On sale, claimed depreciation is recaptured at up to 25%, and gains may owe capital-gains tax (a 1031 exchange can defer both). Figures are a year-1 estimate at your 24.0% rate — not tax advice; consult a CPA.
Schools (NCES district)
- District
- Houston ISD
- NCES district ID
- 4823640
- Math proficiency
- 27% ▼ -18.00%
- Reading proficiency
- 35% ▼ -6.00%
- Median HH income
- $46,054
- Composite
- 26.63/100
- National rank
- #7173
- State rank
- #593 of 826 in TX
Livability — Houston
- Score
- 74/100
- State rank
- #184
- US rank
- #4771
Category grades
Schools grade is shown separately in the Schools card above.
Census & demographics
- Census place
- Houston, TX
- County
- Harris County · 4,702,590 people
- City population
- 3,226,434
- Metro
- Houston-The Woodlands-Sugar Land, TX
- Population (ZIP)
- 21,981
- Household income
- $39,211
- Rent vs Own
- Severe rent burden
- 1531.0
Population outlook (Harris County) Hauer SSP2
- Today (2025)
- 5,571,493 people
- By 2030
- 6,089,821 · +9.3%
- By 2040
- 7,142,806 · +28.2%
- By 2050
- 8,185,864 · +46.9%
- By 2075
- 10,574,329 · +89.8%
- By 2100
- 12,109,958 · +117.4%
Race, ethnicity, and origin ACS 2023
- Neighborhood character
- Diverse neighborhood (Simpson 0.56)
- Race & ethnicity
- Black 49% Hispanic / Latino 44% Two or more races 18% White 5% Native American 1%
- Hispanic origin (detail)
- Mexican 34%
- Common ancestry
- Lithuanian 1%
- Foreign-born
- 15% · Canada
- Languages at home
- 61% English-only · Spanish 39%
Political lean MEDSL · Harris
- 2024 margin
- Lean D (+5.5) · D 52.0% · R 46.4% · Other 1.6%
- 2008→2024 swing
- +3.9pp toward D · 2008: 1.6pp · 2024: 5.5pp
- All cycles
- 2024: D+5.5 2020: D+13.3 2016: D+12.4 2012: D+0.1 2008: D+1.6
Not yet ingested
- Civics
- —
Market trends
- HPI YoY
- ▲ 3.89%
- Current HPI
- 267.5995
- Rent YoY
- ▲ 3.08%
- Metro
- Houston-The Woodlands-Sugar Land, TX
- State GDP YoY
- ▲ 3.95%
- F500 in state
- 110
Industry mix (Fortune 500 HQ in TX)
| Industry | F500 HQs | Revenue |
|---|---|---|
| Energy | 16 | $1,198B |
|
||
| Technology | 5 | $198B |
|
||
| Engineering / Construction | 4 | $72B |
|
||
| Energy Services | 3 | $60B |
|
||
| Utilities | 3 | $41B |
|
||
| Healthcare | 2 | $330B |
|
||
Price history
-41.0% since first listed7 events — show timeline
- 2026-05-13 Price Changed $64,900 HARMLS
- 2026-05-07 Price Changed $69,999 HARMLS
- 2026-04-20 Price Changed $79,999 HARMLS
- 2026-01-24 Price Changed $89,900 HARMLS
- 2025-11-07 Price Changed $104,999 HARMLS
- 2025-10-09 Listed $110,000 HARMLS
- 1993-02-28 Sold (Public Records) — Public Records
Property tax history
+3.1%/yrLatest (2025): $1,189 · +11.7% YoY. Source: county tax records.
Cash-flow waterfall
monthlySold comps — $/sqft
last 12 mo · ≤1 miLoading sold comps…