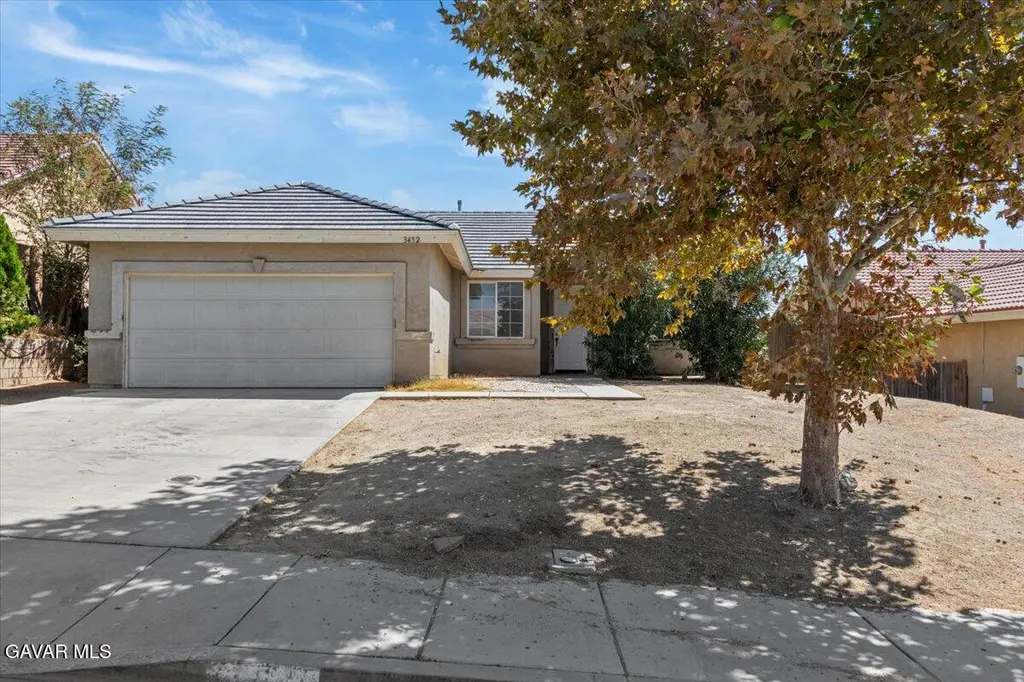
3432 Starjet St St · Rosamond, CA
Flood risk 1/10 · Minimal
- FEMA flood zone
- X (unshaded)
- Chance of flooding over 30 yrs
- 0.0%
- Est. flood insurance / yr
- $507 – $1,088
Fire risk 5/10 · Moderate
- Est. fire insurance / yr
- $659 – $1,223
Heat risk 7/10 · Major
- Hot days now (above 101°F)
- 6 days/yr
- Hot days in 30 yrs
- 17 days/yr
Wind risk 1/10 · Minimal
- Chance of severe wind over 30 yrs
- —
Air-quality risk 7/10 · Major
- Unhealthy air days now
- 14 days/yr
- Unhealthy air days in 30 yrs
- 18 days/yr
Risk factors via First Street. Map © Google.
Why this score? — see what drove the D- grade
The composite is a weighted blend of 9 inputs, each scored 0–100. Each bar is that input's sub-score; the figure is the points it added to the 100-point composite (weight × sub-score).
- ARV discount +10.6/15.0
- Cash flow +8.2/30.0
- Appreciation +6.2/10.0
- Rent growth +2.5/5.0
- Livability +2.5/5.0
- Condition / age +2.5/5.0
- DSCR +2.2/10.0
- Schools +2.2/10.0
- 1% rule +2.0/10.0
$396,000
🖨 Deal sheet 📄 Offer letter ✓ Due diligence
Listing remarks MLS
Welcome to 3432 Starjet St In the heart of Rosamond! This beautifully refreshed home is move-in ready and perfect a first-time buyer or anyone looking for a turnkey opportunity. Recently updated with brand-new flooring and fresh interior paint, the home offers a clean, modern feel with a bright and inviting atmosphere throughout.
Key facts
- Brand new flooring
- Fresh interior paint
- 6,969 sq ft lot
Tags
Neighborhood map
What this means for you Summary
Snapshot
- This is a 3-bed/2.0-bath single-family listed at $396k.
Deal economics
- At list price, monthly cash flow is $-368 ($-4k/yr) — negative.
- To cash-flow at today's rent, offer at most $331k (16.4% below list).
- To meet the 1% rule (rent ≥ 1% of price), the offer needs to be $276k (30.4% below list).
- Recommended offer: $276k (30.4% below list) — sets the bar for 1% rule.
- Cap rate 5.2% vs local median 4.3% in Rosamond — meaningfully above typical; check what's discounted (condition, days-on-market, listing class) to confirm the premium yield is real.
Location & tenants
- Location reads 49/100 on livability (#1,178 in CA) — a working-class tenant base; expect higher turnover. Strengths: housing A+; Watch: schools F, crime F, amenities F.
- Southern Kern Unified (town): math 25% / reading 25% proficiency, ranked #387 of 517 in CA (top 75%) — low school quality limits family demand, transient renter base, plan for 1-2y turnover; 67% free/reduced lunch — lower-income household profile, screen leases tightly.
- Market conditions: 458 active listings in the ZIP; 22 comparable units currently listed for rent nearby; rentals at typical pace (median 15d on market — plan ~3-4 weeks tenant-placement turnaround); solid renter incomes; 3,244 units permitted in Kern County in 2024 (73 in 5+ unit buildings).
- This rent runs 43% of the median local income ($77k/yr) — at the standard rent-burdened threshold; future hikes will face affordability resistance.
Forward outlook
- In year one you build about $12k of equity ($3k loan paydown + $10k appreciation (2.4% local appreciation)).
- Kern County population projected at +17% by 2050 — long-run rental-demand tailwind backs the buy-and-hold thesis.
- By year 3, paydown + projected appreciation supports a ~$31k cash-out refi (75% LTV) — recoverable capital for the next deal without selling this one.
Negotiation context
- It's been on market 268 days — a 12% lower offer ($348k) is reasonable based on typical stale-listing flexibility.
- 4 sale attempts since 17y ago; this cycle's ask has dropped $23k (5%) from the opening price — seller is motivated, your offer sets the floor, not the list.
- Current owner paid $125k; list at $396k implies a 217% gain — meaningful room to come down on a strong offer.
Risks & watch-outs
- Climate carrying-cost: moderate wildfire risk; extreme-heat days projected 6→17/yr by 2055 (HVAC capex compounding) — expect insurance premiums to compound above CPI over the hold.
Questions for the listing agent
- What do current leases actually rent for vs. the listed asking? Can we see a recent rent roll and the last 12 months of T-12 income?
- It's been on market 268 days. Have you received any prior offers? Is the seller open to a 30% concession, seller financing, or rate buy-down credit?
- Why hasn't it sold? Are there any deal-killer items the seller is aware of (foundation, flood, title, zoning, code violations)?
- Is there a deadline driving the sale (1031 exchange, divorce, estate, relocation)? That informs how much negotiation room exists.
- Schools are F-rated, which usually means shorter tenancies and higher turnover. Who's the typical renter profile here, and what's been the actual vacancy rate?
- Crime grade is F in this area — have there been break-ins, vandalism, or insurance claims at this property in the last 3 years? What carrier currently insures it and at what premium?
- The area grade is low — what's the realistic commute time and amenity access for the typical tenant pool here? Any planned neighborhood developments (good or bad) we should know about?
- What's the average days-on-market for RENTAL listings here right now (not sales)? A rising rental-DOM trend means longer vacancies and softer asking-rent achievability than the comps imply.
- What's the recent tenant-quality profile in this submarket — average credit score on applications, eviction rate, late-payment / NSF rate, and stable-employment percentage? A property-management company in the area should have these aggregated.
- How much new for-sale + rental construction is in the pipeline within 1–3 miles? Heavy new supply typically softens prices + rents 12–24 months out; constrained supply supports both.
Investment metrics
- 1% rule
- 0.70% ✗
- Cap rate
- 5.18%
- Cash-on-cash
- -3.98%
- DSCR
- 0.82
- GRM
- 12.0
CMA / ARV
- ARV (median comp)
- $424,960
- List price
- $396,000
- Delta
- -6.81%
- Verdict
- FAIR
- Comps
- 20 within 1.0 mi
Show comp detail 12 sales within ~0.75 mi
| Address | Dist | Beds/Ba | Sqft | Sold | Price | $/sf | Match |
|---|---|---|---|---|---|---|---|
| 3252 Voyager | 0.22mi | 3/2.0 | 1,473 (+3%) | 2mo | $360,000 | $244 | 83 |
| 2318 Horizon Dr | 0.34mi | 3/2.0 | 1,418 (-1%) | 1mo | $339,900 | $240 | 82 |
| 2716 Westland Dr | 0.18mi | 3/2.0 | 1,330 (-7%) | 2mo | $389,000 | $292 | 78 |
| 3425 Topgun St | 0.08mi | 4/2.0 (+1) | 1,349 (-6%) | 4mo | $390,000 | $289 | 78 |
| 2424 Sunset Ridge Dr | 0.28mi | 3/2.0 | 1,287 (-10%) | 1mo | $325,000 | $253 | 69 |
| 3407 Amber St | 0.50mi | 3/2.0 | 1,375 (-4%) | 5mo | $380,000 | $276 | 66 |
| 3212 Marble | 0.65mi | 3/2.0 | 1,375 (-4%) | 2mo | $415,000 | $302 | 61 |
| 3332 Clark St | 0.13mi | 4/2.0 (+1) | 1,639 (+14%) | 6mo | $410,000 | $250 | 60 |
| 3125 Edwards | 0.60mi | 4/2.0 (+1) | 1,522 (+6%) | 1mo | $430,000 | $283 | 56 |
| 3025 Melvin St | 0.61mi | 4/2.0 (+1) | 1,522 (+6%) | 5mo | $421,000 | $277 | 52 |
| 3236 Shelley St | 0.52mi | 4/2.0 (+1) | 1,300 (-9%) | 6mo | $388,000 | $298 | 50 |
| 3112 Edwards Ave | 0.60mi | 3/2.0 | 1,231 (-14%) | 6mo | $379,000 | $308 | 44 |
Match score weights: distance 35% · size 25% · config 20% · recency 20%. Top-matched comps best support the ARV.
Projected returns pro-forma
2.4% appreciation · 3.0% rent growth · sell at horizon
- IRR
- 1.9%
- Equity multiple
- 1.11×
- Total profit
- $11,893
- Equity at exit
- $164,945
- IRR
- 5.7%
- Equity multiple
- 1.82×
- Total profit
- $90,812
- Equity at exit
- $244,439
Cash invested: $110,880 (down + closing). Projections, not guarantees.
Landlord ↔ Tenant lean methodology
- Overall (STATE)
- 18 Strongly Tenant-Friendly
- State California
- 18 Strongly Tenant-Friendly · D+13
- County
- — inherits STATE
- City
- — inherits STATE
ZIP-level market 93560
- Home prices YoY
- 0.6%
- Active inventory
- 458
- Price-to-rent
- 12.0×
Monthly cashflow live
- Estimated rent
- $2,756 high interval (Pro) →
- Mortgage (P&I)
- −$2,077
- Tax from tax record
- −$303 /mo · $3,641/yr
- Insurance
- −$165
- HOA
- −$0
- Vacancy / Maint / Mgmt
- −$579
- Net cashflow
- $-368
Break-even live
UW: 25.0% down · 7.5% · 30yr · 1.5% tax · 5.0% vac · 8.0% maint · 8.0% mgmt
Financing live
Cash to close
- Down payment
- $99,000
- Closing costs
- $11,880
- Reserves months
- —
- Total cash needed
- —
Loan-product check · same deal, 3 products live
Conventional
25% down · 7.5% · 30yr
- Down + closing
- —
- Monthly P&I
- —
- Monthly cashflow
- —
- DSCR
- —
- Eligible?
- —
Personal DTI + credit; lowest rate.
DSCR
20% down · 8.5% · 30yr
- Down + closing
- —
- Monthly P&I
- —
- Monthly cashflow
- —
- DSCR
- —
- Eligible?
- —
No personal income docs; deal must DSCR.
Hard money
10% down · 12.0% · 12mo
- Down + closing
- —
- Monthly P&I
- —
- Monthly cashflow
- —
- DSCR
- —
- Eligible?
- —
Short-term bridge; refi at stabilization.
Rent comps 22 comps
| Address | Beds | Baths | Sqft | Rent | $/sqft | DOM | Units | Dist |
|---|---|---|---|---|---|---|---|---|
| 3317 Dale Ct Rosamond, CA | 3.0 | 2.0 | 1330 | $800 | $0.60 | 1d | 1 | 0.12mi |
| 2436 Horizon Dr Rosamond, CA | 3.0 | 2.0 | 1416 | $4,500 | $3.18 | 43d | 1 | 0.24mi |
| 2416 W Valley Vis Rosamond, CA | 3.0 | 2.0 | 1343 | $2,250 | $1.68 | 15d | 1 | 0.24mi |
| 2608 Starbrite Ave Rosamond, CA | 4.0 | 2.0 | 1542 | $2,795 | $1.81 | 1d | 1 | 0.27mi |
| 2516 Starbrite Ave Rosamond, CA | 3.0 | 2.0 | 1542 | $2,900 | $1.88 | 1d | 1 | 0.28mi |
| 2300 Panorama Ln Rosamond, CA | 2.0 | 2.0 | 1121 | $2,300 | $2.05 | 43d | 1 | 0.37mi |
| 3424 Amber St Rosamond, CA | 3.0 | 2.0 | 1664 | $2,500 | $1.50 | 1d | 1 | 0.50mi |
| 3172 Shelley St Rosamond, CA | 4.0 | 2.0 | 1192 | $2,300 | $1.93 | 21d | 1 | 0.51mi |
| 2910 B St Rosamond, CA | 2.0 | 1.5 | 1775 | $1,542 | $0.87 | 19d | 1 | 0.72mi |
| 2821 Desert St Unit C Rosamond, CA | 2.0 | 1.0 | 975 | $1,795 | $1.84 | 1d | 1 | 0.91mi |
| 1838 Center St Unit A Rosamond, CA | 3.0 | 2.5 | 1495 | $2,000 | $1.34 | 1d | 1 | 1.04mi |
| 1838 Center St Unit A Rosamond, CA | 3.0 | 2.5 | 1475 | $2,000 | $1.36 | 10d | 1 | 1.04mi |
| 2051 Candice Ave Rosamond, CA | 3.0 | 2.0 | 1345 | $2,395 | $1.78 | 15d | 1 | 1.13mi |
| 3400 15th St W Unit 21 Rosamond, CA | 2.0 | 1.0 | 950 | $1,495 | $1.57 | 10d | 1 | 1.14mi |
| 3400 15th St W Rosamond, CA | 2.0 | 1.0 | 1000 | $1,498 | $1.50 | 1d | 4 | 1.15mi |
| 3400 15th St W Unit 118 Rosamond, CA | 2.0 | 1.5 | 1050 | $1,600 | $1.52 | 10d | 1 | 1.15mi |
| 3700 Mount Lassen Ave Rosamond, CA | 3.0 | 2.0 | 1504 | $2,500 | $1.66 | 43d | 1 | 1.24mi |
| 3017 Via Bella Rosa Ave Rosamond, CA | 4.0 | 2.0 | 1820 | $2,800 | $1.54 | 43d | 1 | 1.38mi |
| 3624 Garnet Ave Rosamond, CA | 3.0 | 2.0 | 1509 | $2,499 | $1.66 | 43d | 1 | 1.42mi |
| 3424 Brabham Ave Rosamond, CA | 3.0 | 2.0 | 1364 | $2,150 | $1.58 | 43d | 1 | 1.45mi |
| 3124 Via Bella Rosa Ave Rosamond, CA | 4.0 | 2.0 | 1809 | $3,200 | $1.77 | 43d | 1 | 1.45mi |
| 3356 Firebush Ave Rosamond, CA | 4.0 | 2.0 | 1612 | $2,550 | $1.58 | 20d | 1 | 1.49mi |
Listing history 28 events
-
2026-06-18days on market $396,000 Active 268 DOM
-
2026-06-17days on market $396,000 Active 267 DOM
-
2026-06-16days on market $396,000 Active 266 DOM
-
2026-06-15days on market $396,000 Active 265 DOM
-
2026-06-13days on market $396,000 Active 263 DOM
-
2026-06-13days on market $396,000 Active 262 DOM
-
2026-06-10price $396,000 Active 259 DOM
-
2026-06-09days on market $405,000 Active 259 DOM
-
2026-06-08days on market $405,000 Active 258 DOM
-
2026-06-07days on market $405,000 Active 257 DOM
-
2026-06-04days on market $405,000 Active 254 DOM
-
2026-06-03days on market $405,000 Active 253 DOM
-
2026-06-02days on market $405,000 Active 252 DOM
-
2026-06-01days on market $405,000 Active 251 DOM
-
2026-05-31days on market $405,000 Active 250 DOM
-
2026-04-29status Active 332-char remark
Show marketing remark (332 chars)
Welcome to 3432 Starjet St In the heart of Rosamond! This beautifully refreshed home is move-in ready and perfect a first-time buyer or anyone looking for a turnkey opportunity. Recently updated with brand-new flooring and fresh interior paint, the home offers a clean, modern feel with a bright and inviting atmosphere throughout.
-
2026-04-23status Pending 332-char remark
Show marketing remark (332 chars)
Welcome to 3432 Starjet St In the heart of Rosamond! This beautifully refreshed home is move-in ready and perfect a first-time buyer or anyone looking for a turnkey opportunity. Recently updated with brand-new flooring and fresh interior paint, the home offers a clean, modern feel with a bright and inviting atmosphere throughout.
-
2026-02-11price $405,000 332-char remark
Show marketing remark (332 chars)
Welcome to 3432 Starjet St In the heart of Rosamond! This beautifully refreshed home is move-in ready and perfect a first-time buyer or anyone looking for a turnkey opportunity. Recently updated with brand-new flooring and fresh interior paint, the home offers a clean, modern feel with a bright and inviting atmosphere throughout.
-
2025-10-10price $414,000 332-char remark
Show marketing remark (332 chars)
Welcome to 3432 Starjet St In the heart of Rosamond! This beautifully refreshed home is move-in ready and perfect a first-time buyer or anyone looking for a turnkey opportunity. Recently updated with brand-new flooring and fresh interior paint, the home offers a clean, modern feel with a bright and inviting atmosphere throughout.
-
2025-09-16$419,000 Active 332-char remark
Show marketing remark (332 chars)
Welcome to 3432 Starjet St In the heart of Rosamond! This beautifully refreshed home is move-in ready and perfect a first-time buyer or anyone looking for a turnkey opportunity. Recently updated with brand-new flooring and fresh interior paint, the home offers a clean, modern feel with a bright and inviting atmosphere throughout.
-
2009-08-14soldstatus $125,000
-
2009-08-13soldstatus $125,000 239-char remark
Show marketing remark (239 chars)
This is a short sale listing- listing price is not guaranteed. Bring your best offer today. Don't miss out on this great opportunity! This single story home built in 2005 offers 1,433 sq ft of living space with 3 bedrooms and 2 full baths.
-
2009-08-13soldstatus $125,000
Show marketing remark (239 chars)
This is a short sale listing- listing price is not guaranteed. Bring your best offer today. Don't miss out on this great opportunity! This single story home built in 2005 offers 1,433 sq ft of living space with 3 bedrooms and 2 full baths.
-
2009-02-26$119,999 239-char remark
Show marketing remark (239 chars)
This is a short sale listing- listing price is not guaranteed. Bring your best offer today. Don't miss out on this great opportunity! This single story home built in 2005 offers 1,433 sq ft of living space with 3 bedrooms and 2 full baths.
-
2009-02-26$119,999
Show marketing remark (239 chars)
This is a short sale listing- listing price is not guaranteed. Bring your best offer today. Don't miss out on this great opportunity! This single story home built in 2005 offers 1,433 sq ft of living space with 3 bedrooms and 2 full baths.
-
2004-08-10soldstatus $540,000
-
2004-07-02soldstatus $224,500
-
2003-06-06soldstatus $39,000
ⓘ Source: listings_history table (triggers on properties + properties_extension) + one-shot
backfill from property_details.listing_events for pre-trigger history.
Tax reassessment forecast CA · Resets to sale price
- Current annual tax
- $3,641 · $303/mo
- Projected year-2 tax
- $3,641 · $303/mo
- Expected delta
- $0/yr ($0/mo · 0.0%)
ⓘ Screening estimate from a state-policy table — verify with the county assessor before closing.
Climate risk First Street
- Flood 1/10 Low FEMA zone X (unshaded) · 0% chance over 30 yrs
- Wildfire 5/10 Major
- Heat 7/10 Severe 6 d/yr ≥101°F today · 17 d/yr by 30 yrs out
- Wind 1/10 Low
- Air quality 7/10 Severe 14 unhealthy d/yr today · 18 by 30 yrs out
Nearby sold comps map
Loading sold comps map…
Walkable amenities ~0.75 mi
Loading nearby amenities…
Taxation est. · year 1
- Rental income
- $33,077
- − Mortgage interest
- −$22,182
- − Property taxes
- −$3,641
- − Insurance
- −$1,980
- − Repairs & maintenance
- −$2,646
- − Management
- −$2,646
- − Depreciation
- −$11,520
- Taxable loss
- −$11,539
- Est. tax savings @ 24.0%
- +$2,769
- After-tax cash flow
- $-1,641/yr
For passive investors: Depreciation is non-cash, so a rental often shows a tax loss while cash-flowing — sheltering income. Rental losses are passive: they offset passive income freely, and up to $25,000/yr can offset ordinary (W-2) income if you actively participate and your MAGI is under $100k (phasing out to $0 by $150k); unused losses carry forward. On sale, claimed depreciation is recaptured at up to 25%, and gains may owe capital-gains tax (a 1031 exchange can defer both). Figures are a year-1 estimate at your 24.0% rate — not tax advice; consult a CPA.
Schools (NCES district)
- District
- Southern Kern Unified
- NCES district ID
- 0637620
- Math proficiency
- 25% ▲ 7.00%
- Reading proficiency
- 25% ▼ -8.00%
- Median HH income
- $54,523
- Composite
- 22.5/100
- National rank
- #8093
- State rank
- #387 of 517 in CA
Livability — Rosamond
- Score
- 49/100
- State rank
- #1178
- US rank
- #25952
Category grades
Schools grade is shown separately in the Schools card above.
Census & demographics
- Census place
- Rosamond, CA
- County
- Kern County · 710,371 people
- City population
- 22,119
- Metro
- Bakersfield, CA
- Population (ZIP)
- 22,119
- Household income
- $77,431
- Rent vs Own
- Severe rent burden
- 425.0
Population outlook (Kern County) Hauer SSP2
- Today (2025)
- 947,286 people
- By 2030
- 978,984 · +3.3%
- By 2040
- 1,045,018 · +10.3%
- By 2050
- 1,105,232 · +16.7%
- By 2075
- 1,229,538 · +29.8%
- By 2100
- 1,238,059 · +30.7%
Race, ethnicity, and origin ACS 2023
- Neighborhood character
- Diverse neighborhood (Simpson 0.68)
- Race & ethnicity
- Hispanic / Latino 45% White 32% Two or more races 17% Black 13% Asian 3% Native American 1%
- Hispanic origin (detail)
- Mexican 35%
- Common ancestry
- Portuguese 2% Italian 2% Lithuanian 1%
- Foreign-born
- 13% · Canada
- Languages at home
- 68% English-only · Spanish 28% Other Indo-European 2% Other Asian/Pacific 1%
Political lean MEDSL · Kern
- 2024 margin
- Strong R (+21.1) · D 38.2% · R 59.3% · Other 2.5%
- 2008→2024 swing
- -3.3pp toward R · 2008: -17.8pp · 2024: -21.1pp
- All cycles
- 2024: R+21.1 2020: R+10.2 2016: R+15.0 2012: R+20.9 2008: R+17.8
Not yet ingested
- Civics
- —
Market trends
- HPI YoY
- ▲ 2.40%
- Current HPI
- 403.7206
- Rent YoY
- —
- Metro
- Bakersfield, CA
- State GDP YoY
- ▲ 3.21%
- F500 in state
- 116
Industry mix (Fortune 500 HQ in CA)
| Industry | F500 HQs | Revenue |
|---|---|---|
| Technology | 27 | $1,492B |
|
||
| Financial Services | 3 | $174B |
|
||
| Retail | 3 | $44B |
|
||
| Insurance | 3 | $26B |
|
||
| Media / Entertainment | 2 | $115B |
|
||
| Pharmaceuticals / Biotech | 2 | $62B |
|
||
Price history
+938.5% since first listed13 events — show timeline
- 2026-04-29 Relisted — AVMLS
- 2026-04-23 Pending — AVMLS
- 2026-02-11 Price Changed $405,000 AVMLS
- 2025-10-10 Price Changed $414,000 AVMLS
- 2025-09-16 Listed $419,000 AVMLS
- 2009-08-14 Sold (Public Records) $125,000 Public Records
- 2009-08-13 Sold (MLS) $125,000 CRMLS
- 2009-08-13 Sold (MLS) $125,000 AVMLS
- 2009-02-26 Listed $119,999 CRMLS
- 2009-02-26 Listed $119,999 AVMLS
- 2004-08-10 Sold (Public Records) $540,000 Public Records
- 2004-07-02 Sold (Public Records) $224,500 Public Records
- 2003-06-06 Sold (Public Records) $39,000 Public Records
Property tax history
+4.7%/yrLatest (2025): $3,641 · +7.3% YoY. Source: county tax records.
Cash-flow waterfall
monthlySold comps — $/sqft
last 12 mo · ≤1 miLoading sold comps…