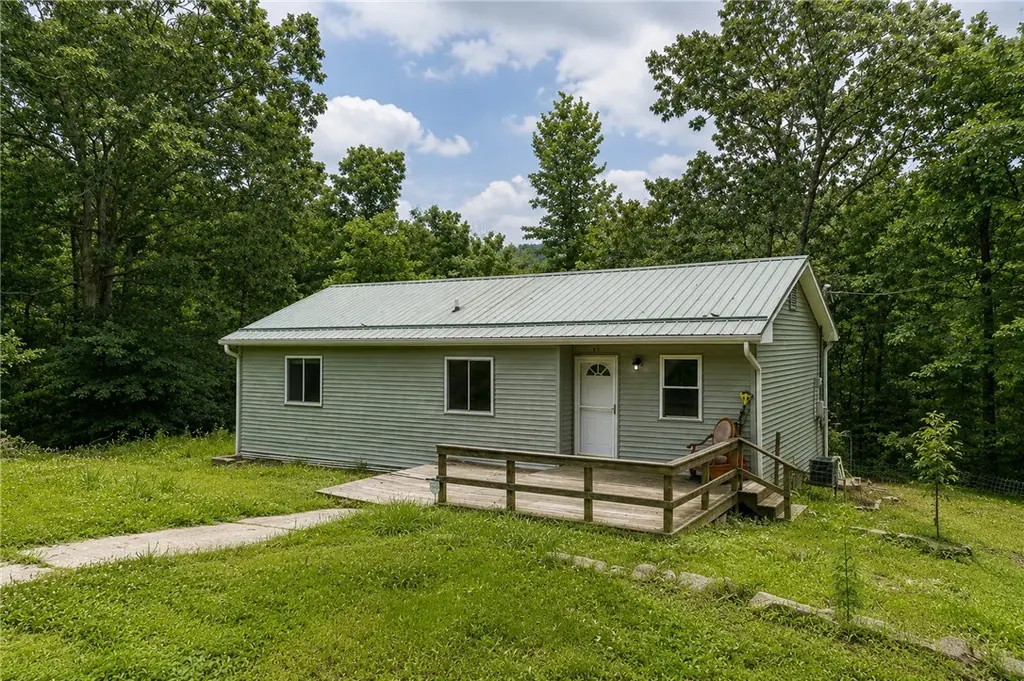
2178 Highway 295 · Elkins, AR
Flood risk 1/10 · Minimal
- FEMA flood zone
- A
- Chance of flooding over 30 yrs
- 0.0%
- Est. flood insurance / yr
- $1,009 – $1,996
Fire risk 5/10 · Moderate
- Est. fire insurance / yr
- $1,499 – $2,785
Heat risk 4/10 · Minor
- Hot days now (above 102°F)
- 7 days/yr
- Hot days in 30 yrs
- 22 days/yr
Wind risk 2/10 · Minimal
- Chance of severe wind over 30 yrs
- 1.0%
Air-quality risk 2/10 · Minimal
- Unhealthy air days now
- 0 days/yr
- Unhealthy air days in 30 yrs
- 1 days/yr
Risk factors via First Street. Map © Google.
Why this score? — see what drove the D+ grade
The composite is a weighted blend of 9 inputs, each scored 0–100. Each bar is that input's sub-score; the figure is the points it added to the 100-point composite (weight × sub-score).
- Cash flow +13.0/30.0
- ARV discount +7.5/15.0
- Appreciation +6.6/10.0
- DSCR +3.9/10.0
- 1% rule +3.7/10.0
- Livability +3.2/5.0
- Schools +2.7/10.0
- Rent growth +2.5/5.0
- Condition / age +2.5/5.0
$190,000
🖨 Deal sheet 📄 Offer letter ✓ Due diligence
Listing remarks MLS
Just on the Edge of the National Forest would make a great weekend cabin for going riding 4 wheelers or side by sides in the National Forest. Bank owned home Sold as is this 3 bed 2 bath home has hard wood floors in the living room and bedrooms tile floors in the wet areas. sits on 3.25 acres with a view of the creek behind the home. All Arvest employees and affiliates and their relatives are not eligible to purchase this home. All offers must have proof of funds or a pre qual letter from lender
Key facts
- Updated siding
- Fresh paint
- Updated flooring
Tags
Property features AI
Finance
- HOA & community: Monthly association fee; Community has park and trails/paths
Exterior
- Parking: Concrete driveway
- Security: Security system; Fire alarm; Smoke detectors
- Utilities: Electricity available; Natural gas available; Public water; Public sewer
- Home design: Single-story home
- Construction: Vinyl siding; Metal roof; Slab foundation; Built with vinyl siding
- Exterior features: Concrete driveway; Deck; Outbuilding; Storage; Creek on property; Open and wooded areas; Near park; Outside city limits; Not in a subdivision; Rural lot
Interior
- Kitchen: Electric cooktop; Microwave; Microwave hood fan; Dishwasher; Refrigerator
- Flooring: Luxury vinyl plank
- Bathrooms: 2 full bathrooms
- Heating & cooling: Central heating; Central air conditioning
- Interior features: Ceiling fans; Split bedroom layout
- Laundry & utility: Washer hookup; Dryer hookup; Washer; Dryer; Gas water heater
Neighborhood map
What this means for you Summary
Snapshot
- This is a 3-bed/1.0-bath single-family listed at $190k.
Deal economics
- At list price, monthly cash flow is $-135 ($-2k/yr) — negative.
- To cash-flow at today's rent, offer at most $171k (10.2% below list).
- To meet the 1% rule (rent ≥ 1% of price), the offer needs to be $165k (13.1% below list).
- Recommended offer: $165k (13.1% below list) — sets the bar for 1% rule.
- Cap rate 6.2% vs local median 4.2% in Elkins — top-decile yield for the area; either an underpriced asset or a hidden risk that comps aren't pricing in. Stress-test before assuming the spread holds.
Location & tenants
- Location reads 64/100 on livability (#186 in AR) — a middle-class / working-renter tenant base. Strengths: cost of living A+, housing A+; Watch: schools D, amenities F, commute F.
- Huntsville School District (rural): math 35% / reading 29% proficiency, ranked #141 of 238 in AR (top 59%) — families likely to look elsewhere, expect single-tenant / working-renter base with shorter leases.
- Market conditions: 131 active listings in the ZIP; solid renter incomes; 29 units permitted in Madison County in 2024 (0 in 5+ unit buildings).
Forward outlook
- In year one you build about $8k of equity ($1k loan paydown + $6k appreciation (3.3% local appreciation)).
- Madison County population projected to shrink 9% by 2050 — rents likely to lag national; underwrite the cash flow, not the appreciation.
- By year 5, paydown + projected appreciation supports a ~$32k cash-out refi (75% LTV) — recoverable capital for the next deal without selling this one.
Negotiation context
- Only 2 days on market — expect competitive offers; lowballing is unlikely to land.
- 2 sale attempts since 10y ago with the ask held roughly flat each time — persistent listings suggest the price (not the market) is what's stuck; bring a comps-based counter.
- Current owner paid $67k; list at $190k implies a 184% gain — meaningful room to come down on a strong offer.
Risks & watch-outs
- Watch-outs: flood insurance adds $125/mo.
- Climate carrying-cost: in FEMA flood zone A (mandatory federal flood insurance); moderate wildfire risk — expect insurance premiums to compound above CPI over the hold.
Questions for the listing agent
- What do current leases actually rent for vs. the listed asking? Can we see a recent rent roll and the last 12 months of T-12 income?
- What's the actual annual flood-insurance premium (NFIP or private), and is the property in a SFHA with mandatory coverage?
- Is there a deadline driving the sale (1031 exchange, divorce, estate, relocation)? That informs how much negotiation room exists.
- Schools are D-rated, which usually means shorter tenancies and higher turnover. Who's the typical renter profile here, and what's been the actual vacancy rate?
- The area grade is low — what's the realistic commute time and amenity access for the typical tenant pool here? Any planned neighborhood developments (good or bad) we should know about?
- What's the average days-on-market for RENTAL listings here right now (not sales)? A rising rental-DOM trend means longer vacancies and softer asking-rent achievability than the comps imply.
- What's the recent tenant-quality profile in this submarket — average credit score on applications, eviction rate, late-payment / NSF rate, and stable-employment percentage? A property-management company in the area should have these aggregated.
- How much new for-sale + rental construction is in the pipeline within 1–3 miles? Heavy new supply typically softens prices + rents 12–24 months out; constrained supply supports both.
Investment metrics
- 1% rule
- 0.87% ✗
- Cap rate
- 6.23%
- Cash-on-cash
- -0.21%
- DSCR
- 0.99
- GRM
- 9.6
CMA / ARV
No comps found within radius.
Projected returns pro-forma
3.26% appreciation · 3.0% rent growth · sell at horizon
- IRR
- 5.5%
- Equity multiple
- 1.32×
- Total profit
- $17,032
- Equity at exit
- $88,210
- IRR
- 8.4%
- Equity multiple
- 2.31×
- Total profit
- $69,609
- Equity at exit
- $138,143
Cash invested: $53,200 (down + closing). Projections, not guarantees.
Landlord ↔ Tenant lean methodology
- Overall (STATE)
- 92 Strongly Landlord-Friendly
- State Arkansas
- 92 Strongly Landlord-Friendly · R+14
- County
- — inherits STATE
- City
- — inherits STATE
ZIP-level market 72727
- Home prices YoY
- 1.1%
- Active inventory
- 131
- Price-to-rent
- 9.6×
Monthly cashflow live
- Estimated rent
- $1,650 medium interval (Pro) →
- Mortgage (P&I)
- −$996
- Tax est. 1.5%
- −$238 /mo · $2,850/yr
- Insurance
- −$79
- Flood insurance flood zone
- −$125 /mo · $1,502/yr
- HOA
- −$0
- Vacancy / Maint / Mgmt
- −$347
- Net cashflow
- $-135
Break-even live
UW: 25.0% down · 7.5% · 30yr · 1.5% tax · 5.0% vac · 8.0% maint · 8.0% mgmt
Financing live
Cash to close
- Down payment
- $47,500
- Closing costs
- $5,700
- Reserves months
- —
- Total cash needed
- —
Loan-product check · same deal, 3 products live
Conventional
25% down · 7.5% · 30yr
- Down + closing
- —
- Monthly P&I
- —
- Monthly cashflow
- —
- DSCR
- —
- Eligible?
- —
Personal DTI + credit; lowest rate.
DSCR
20% down · 8.5% · 30yr
- Down + closing
- —
- Monthly P&I
- —
- Monthly cashflow
- —
- DSCR
- —
- Eligible?
- —
No personal income docs; deal must DSCR.
Hard money
10% down · 12.0% · 12mo
- Down + closing
- —
- Monthly P&I
- —
- Monthly cashflow
- —
- DSCR
- —
- Eligible?
- —
Short-term bridge; refi at stabilization.
Listing history 4 events
-
2026-06-03status $190,000 Pending 2 DOM
-
2026-06-02days on market $190,000 Active 2 DOM
-
2026-06-01remarks 640-char remark
-
2026-06-01$190,000 Active 1 DOM
ⓘ Source: listings_history table (triggers on properties + properties_extension) + one-shot
backfill from property_details.listing_events for pre-trigger history.
Climate risk First Street
- Flood 1/10 Low FEMA zone A · 0% chance over 30 yrs
- Wildfire 5/10 Major
- Heat 4/10 Moderate 7 d/yr ≥102°F today · 22 d/yr by 30 yrs out
- Wind 2/10 Low 100% chance of damaging wind over 30 yrs
- Air quality 2/10 Low 0 unhealthy d/yr today · 1 by 30 yrs out
Nearby sold comps map
Loading sold comps map…
Walkable amenities ~0.75 mi
Loading nearby amenities…
Taxation est. · year 1
- Rental income
- $19,803
- − Mortgage interest
- −$10,643
- − Property taxes
- −$2,850
- − Insurance
- −$2,452
- − Repairs & maintenance
- −$1,584
- − Management
- −$1,584
- − Depreciation
- −$5,527
- Taxable loss
- −$4,838
- Est. tax savings @ 24.0%
- +$1,161
- After-tax cash flow
- $-453/yr
For passive investors: Depreciation is non-cash, so a rental often shows a tax loss while cash-flowing — sheltering income. Rental losses are passive: they offset passive income freely, and up to $25,000/yr can offset ordinary (W-2) income if you actively participate and your MAGI is under $100k (phasing out to $0 by $150k); unused losses carry forward. On sale, claimed depreciation is recaptured at up to 25%, and gains may owe capital-gains tax (a 1031 exchange can defer both). Figures are a year-1 estimate at your 24.0% rate — not tax advice; consult a CPA.
Schools (NCES district)
- District
- Huntsville School District
- NCES district ID
- 0508130
- Math proficiency
- 35% ▼ -7.00%
- Reading proficiency
- 29% ▼ -7.00%
- Median HH income
- $37,770
- Composite
- 26.72/100
- National rank
- #7146
- State rank
- #141 of 238 in AR
Livability — Elkins
- Score
- 64/100
- State rank
- #186
- US rank
- #14848
Category grades
Schools grade is shown separately in the Schools card above.
Census & demographics
- County
- Washington County · 252,056 people
- City population
- 6,703
- Metro
- Fayetteville-Springdale-Rogers, AR
- Population (ZIP)
- 6,703
- Household income
- $75,402
- Rent vs Own
- Severe rent burden
- 5.0
Population outlook (Madison County) Hauer SSP2
- Today (2025)
- 15,655 people
- By 2030
- 15,418 · -1.5%
- By 2040
- 14,824 · -5.3%
- By 2050
- 14,198 · -9.3%
- By 2075
- 12,827 · -18.1%
- By 2100
- 10,871 · -30.6%
Race, ethnicity, and origin ACS 2023
- Neighborhood character
- Predominantly White (78%)
- Race & ethnicity
- White 78% Two or more races 12% Hispanic / Latino 10%
- Hispanic origin (detail)
- Mexican 6%
- Common ancestry
- Italian 2% Lithuanian 2% Romanian 2%
- Foreign-born
- 4% · Canada
- Languages at home
- 95% English-only · Spanish 5%
Political lean MEDSL · Madison
- 2024 margin
- Solid R (+58.6) · D 19.9% · R 78.5% · Other 1.7%
- 2008→2024 swing
- -29.7pp toward R · 2008: -28.9pp · 2024: -58.6pp
- All cycles
- 2024: R+58.6 2020: R+55.7 2016: R+49.1 2012: R+32.9 2008: R+28.9
Not yet ingested
- Civics
- —
Market trends
- HPI YoY
- ▲ 3.26%
- Current HPI
- 310.3549
- Rent YoY
- —
- Metro
- Fayetteville-Springdale-Rogers, AR
- State GDP YoY
- ▲ 3.80%
- F500 in state
- 10
Industry mix (Fortune 500 HQ in AR)
| Industry | F500 HQs | Revenue |
|---|---|---|
| Retail | 1 | $681B |
|
||
| Food / Agriculture | 1 | $53B |
|
||
| Retail / Energy | 1 | $22B |
|
||
| Transportation / Logistics | 1 | $12B |
|
||
| Energy | 1 | $4B |
|
||
Price history
+406.7% since first listed5 events — show timeline
- 2026-05-31 Listed $190,000 NWARMLS
- 2017-05-02 Sold (MLS) $67,000 NWARMLS
- 2016-03-17 Listed $69,000 NWARMLS
- 2012-02-16 Sold (Public Records) $65,000 Public Records
- 2003-11-20 Sold (Public Records) $37,500 Public Records
Property tax history
+0.9%/yrLatest (2025): $37 · +0.0% YoY. Source: county tax records.
Cash-flow waterfall
monthlySold comps — $/sqft
last 12 mo · ≤1 miLoading sold comps…