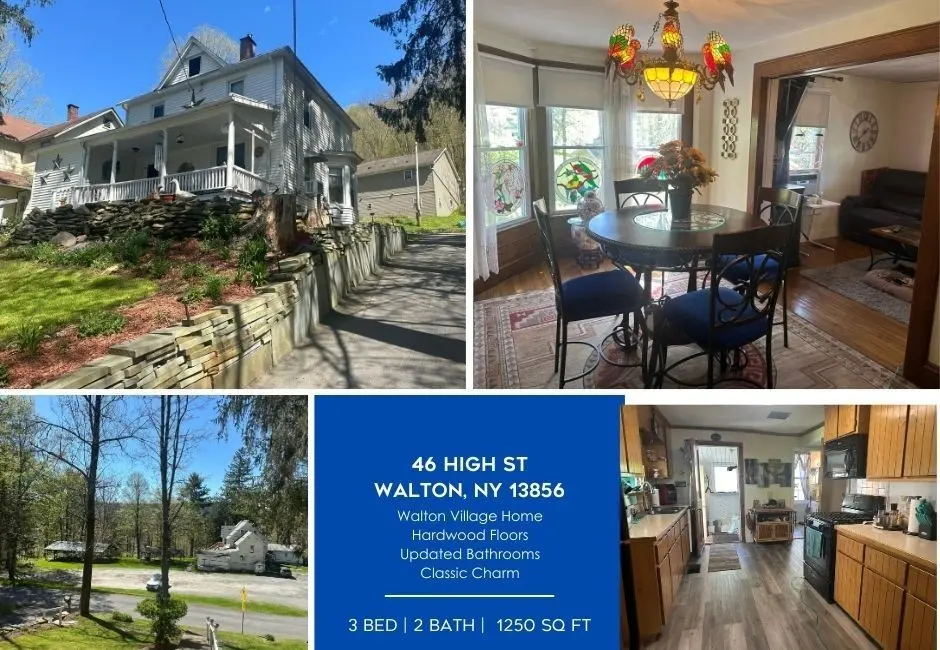
46 High St · Walton, NY
Flood risk 1/10 · Minimal
- FEMA flood zone
- X (unshaded)
- Chance of flooding over 30 yrs
- 0.0%
- Est. flood insurance / yr
- $473 – $860
Fire risk 1/10 · Minimal
- Est. fire insurance / yr
- $691 – $1,283
Heat risk 2/10 · Minimal
- Hot days now (above 90°F)
- 7 days/yr
- Hot days in 30 yrs
- 17 days/yr
Wind risk 2/10 · Minimal
- Chance of severe wind over 30 yrs
- 1.0%
Air-quality risk 2/10 · Minimal
- Unhealthy air days now
- 0 days/yr
- Unhealthy air days in 30 yrs
- 1 days/yr
Risk factors via First Street. Map © Google.
Why this score? — see what drove the B grade
The composite is a weighted blend of 9 inputs, each scored 0–100. Each bar is that input's sub-score; the figure is the points it added to the 100-point composite (weight × sub-score).
- Cash flow +30.0/30.0
- 1% rule +10.0/10.0
- DSCR +10.0/10.0
- Appreciation +7.9/10.0
- Schools +3.5/10.0
- Livability +3.5/5.0
- Rent growth +2.5/5.0
- Condition / age +2.5/5.0
- ARV discount +2.4/15.0
$172,500
🖨 Deal sheet (PDF) 📄 Offer letter ✓ Due diligence
Listing remarks
Nestled on the top of High St sits this captivating two-story home welcoming you with its charming allure and meticulous attention to detail. As you approach the property, a beautifully paved driveway guides you towards the covered front porch, where you can envision moments of relaxation and connection with the surrounding neighborhood. The well-maintained yard exudes a sense of pride in ownership with blue stone and many garden beds. Step inside featuring 4 Bedrooms and 2 Bathrooms. You're greeted by a warm and inviting ambiance, accentuated by the seamless blend of modern updates and timeless charm. New Floors stretch across the spacious interior, adding an element of sophistication to t
Key facts
- Covered front porch
- Well maintained yard
- New floors
Tags
Property features AI
Exterior
- Parking: 2-car garage; Carport
- Utilities: Electricity connected; Public water connected; Sewer connected
- Home design: 2-story house; Existing (previously built) construction
- Construction: Vinyl siding; Block and stone foundation
- Exterior features: Blacktop driveway; Rectangular lot; Main thoroughfare frontage
Interior
- Kitchen: Gas cooktop; Gas oven; Gas range; Dishwasher; Refrigerator; Electric water heater
- Bedrooms: One main-level bedroom
- Flooring: Hardwood; Vinyl; Varies
- Bathrooms: Two full bathrooms; One bathroom on the main level
- Heating & cooling: Gas forced-air heating
- Interior features: Separate/formal living room; Country kitchen; Full basement; Living room; Family room
- Laundry & utility: Washer and dryer; Laundry on main level
Neighborhood map
What this means for you Summary
Snapshot
- This is a 3-bed/2.5-bath single-family listed at $172k.
Deal economics
- At list price, monthly cash flow is $891 ($11k/yr) — positive.
- The deal already cash-flows at list — no discount required.
- Meets the 1% rule at list price ($3k rent vs $172k).
- Recommended offer: $167k (3.0% below list) — sets the bar for market timing.
- Cap rate 12.5% vs local median 7.8% in Walton — top-decile yield for the area; either an underpriced asset or a hidden risk that comps aren't pricing in. Stress-test before assuming the spread holds.
Location & tenants
- Location reads 70/100 on livability (#443 in NY) — a middle-class / working-renter tenant base. Strengths: cost of living A+, health & safety A+; Watch: amenities F, commute F, employment F.
- Walton Central School District (town): math 36% / reading 47% proficiency, ranked #510 of 590 in NY (top 86%) — families likely to look elsewhere, expect single-tenant / working-renter base with shorter leases.
- Zoned schools: Townsend Elementary School (math 32% / reading 42%, grade F, #1,519 of 2,108 statewide, top 74%, 367 students, 47% FRL); Walton Middle School (math 17% / reading 42%, grade F, #550 of 729 statewide, top 77%, 189 students, 54% FRL); Walton High School (math 84% / reading 90%, grade A, #308 of 1,100 statewide, top 28%, 283 students, 50% FRL) — zoned schools at 51% FRL track the district average.
- Market conditions: 56 active listings in the ZIP; 66 units permitted in Delaware County in 2024 (0 in 5+ unit buildings).
Forward outlook
- In year one you build about $11k of equity ($1k loan paydown + $10k appreciation (5.8% local appreciation)).
- Delaware County population projected at -27% by 2050 — secular population decline; favor cash flow + early exit over multi-decade hold.
- At projected returns (5.8% appreciation + 3.0% rent growth), your $48k cash investment doubles in ~3 years — after that, you're playing with house money.
- By year 4, paydown + projected appreciation supports a ~$38k cash-out refi (75% LTV) — recoverable capital for the next deal without selling this one.
Negotiation context
- It's been on market 38 days — a 3% lower offer ($167k) is reasonable based on typical stale-listing flexibility.
- 4 sale attempts since 7y ago with the ask held roughly flat each time — persistent listings suggest the price (not the market) is what's stuck; bring a comps-based counter.
Risks & watch-outs
- Watch-outs: property tax is 2.7% of price; built in 1910 — expect roof / HVAC / electrical / plumbing capex.
Questions for the listing agent
- It's been on market 38 days. Have you received any prior offers? Is the seller open to a 3% concession, seller financing, or rate buy-down credit?
- Built in 1910 — when were the roof, HVAC, electrical panel, plumbing, and water heater last replaced?
- Property tax is high relative to price — has the assessment been appealed recently, and will the sale trigger a re-assessment?
- Is there a deadline driving the sale (1031 exchange, divorce, estate, relocation)? That informs how much negotiation room exists.
- Schools are D-rated, which usually means shorter tenancies and higher turnover. Who's the typical renter profile here, and what's been the actual vacancy rate?
- What's the average days-on-market for RENTAL listings here right now (not sales)? A rising rental-DOM trend means longer vacancies and softer asking-rent achievability than the comps imply.
- What's the recent tenant-quality profile in this submarket — average credit score on applications, eviction rate, late-payment / NSF rate, and stable-employment percentage? A property-management company in the area should have these aggregated.
- How much new for-sale + rental construction is in the pipeline within 1–3 miles? Heavy new supply typically softens prices + rents 12–24 months out; constrained supply supports both.
Investment metrics
- 1% rule
- 1.65% ✓
- Cap rate
- 12.49%
- Cash-on-cash
- 22.15%
- DSCR
- 1.99
- GRM
- 5.0
CMA / ARV
- ARV (median comp)
- $154,837
- List price
- $172,500
- Delta
- 11.41%
- Verdict
- OVERPRICED
- Comps
- 20 within 1.0 mi
Show comp detail 5 sales within ~0.75 mi
| Address | Dist | Beds/Ba | Sqft | Sold | Price | $/sf | Match |
|---|---|---|---|---|---|---|---|
| 82 Griswold St | 0.24mi | 3/1.0 | 1,188 (-0%) | 12mo | $132,355 | $111 | 72 |
| 14 Maple St | 0.46mi | 2/1.0 (-1) | 1,152 (-3%) | 4mo | $151,000 | $131 | 59 |
| 10 Camp Ave | 0.69mi | 3/1.0 | 1,232 (+3%) | 1mo | $118,700 | $96 | 56 |
| 23 Shepard St | 0.54mi | 3/1.0 | 1,160 (-3%) | 12mo | $35,000 | $30 | 54 |
| 51 Stockton Ave | 0.54mi | 4/2.0 (+1) | 1,104 (-7%) | 8mo | $215,000 | $195 | 49 |
Match score weights: distance 35% · size 25% · config 20% · recency 20%. Top-matched comps best support the ARV.
Projected returns pro-forma
5.79% appreciation · 3.0% rent growth · sell at horizon
- IRR
- 33.6%
- Equity multiple
- 3.17×
- Total profit
- $104,620
- Equity at exit
- $106,204
- IRR
- 31.4%
- Equity multiple
- 6.47×
- Total profit
- $264,149
- Equity at exit
- $190,693
Cash invested: $48,300 (down + closing). Projections, not guarantees.
Landlord ↔ Tenant lean methodology
- Overall (STATE)
- 15 Strongly Tenant-Friendly
- State New York
- 15 Strongly Tenant-Friendly · D+10
- County
- — inherits STATE
- City
- — inherits STATE
ZIP-level market 13856
- Home prices YoY
- 1.8%
- Active inventory
- 56
- Price-to-rent
- 5.0×
Monthly cashflow live
- Estimated rent
- $2,849 medium interval (Pro) →
- Mortgage (P&I)
- −$905
- Tax from tax record
- −$383 /mo · $4,593/yr
- Insurance
- −$72
- HOA
- −$0
- Lot rent
- −$0
- Vacancy / Maint / Mgmt
- −$598
- Net cashflow
- $891
Break-even live
Sensitivity live
| Price | -10% $989 | -5% $940 | +0% $891 | +5% $843 | +10% $794 |
|---|---|---|---|---|---|
| Rent | -10% $666 | -5% $779 | +0% $891 | +5% $1,004 | +10% $1,116 |
| Rate | -1.0pp $978 | -0.5pp $935 | base $891 | +0.5pp $847 | +1.0pp $801 |
UW: 25.0% down · 7.5% · 30yr · 1.5% tax · 5.0% vac · 8.0% maint · 8.0% mgmt
Financing live
Cash to close
- Down payment
- $43,125
- Closing costs
- $5,175
- Reserves months
- —
- Total cash needed
- —
Loan-product check · same deal, 3 products live
Conventional
25% down · 7.5% · 30yr
- Down + closing
- —
- Monthly P&I
- —
- Monthly cashflow
- —
- DSCR
- —
- Eligible?
- —
Personal DTI + credit; lowest rate.
DSCR
20% down · 8.5% · 30yr
- Down + closing
- —
- Monthly P&I
- —
- Monthly cashflow
- —
- DSCR
- —
- Eligible?
- —
No personal income docs; deal must DSCR.
Hard money
10% down · 12.0% · 12mo
- Down + closing
- —
- Monthly P&I
- —
- Monthly cashflow
- —
- DSCR
- —
- Eligible?
- —
Short-term bridge; refi at stabilization.
Listing history 23 events
-
2026-06-22days on market $172,500 Active 38 DOM
-
2026-06-21days on market $172,500 Active 37 DOM
-
2026-06-21days on market $172,500 Active 36 DOM
-
2026-06-18days on market $172,500 Active 34 DOM
-
2026-06-17days on market $172,500 Active 33 DOM
-
2026-06-16days on market $172,500 Active 32 DOM
-
2026-06-15days on market $172,500 Active 31 DOM
-
2026-06-13days on market $172,500 Active 29 DOM
-
2026-06-12days on market $172,500 Active 28 DOM
-
2026-06-09days on market $172,500 Active 25 DOM
-
2026-06-08days on market $172,500 Active 24 DOM
-
2026-06-07days on market $172,500 Active 23 DOM
-
2026-06-07days on market $172,500 Active 22 DOM
-
2026-06-04days on market $172,500 Active 19 DOM
-
2026-06-02days on market $172,500 Active 18 DOM
-
2026-06-01days on market $172,500 Active 17 DOM
-
2026-05-31days on market $172,500 Active 16 DOM
-
2026-05-15$172,500 Active 1194-char remark
-
2024-07-30historical
-
2024-05-05$185,000 Active
-
2022-03-03historical
-
2022-01-12$115,000
-
2019-03-11$99,900
ⓘ Source: listings_history table (triggers on properties + properties_extension) + one-shot
backfill from property_details.listing_events for pre-trigger history.
Tax reassessment forecast NY · Partial reset (capped growth)
- Current annual tax
- $4,593 · $383/mo
- Projected year-2 tax
- $4,593 · $383/mo
- Expected delta
- $0/yr ($0/mo · 0.0%)
ⓘ Screening estimate from a state-policy table — verify with the county assessor before closing.
Climate risk First Street
- Flood 1/10 Low FEMA zone X (unshaded) · 0% chance over 30 yrs
- Wildfire 1/10 Low
- Heat 2/10 Low 7 d/yr ≥90°F today · 17 d/yr by 30 yrs out
- Wind 2/10 Low 100% chance of damaging wind over 30 yrs
- Air quality 2/10 Low 0 unhealthy d/yr today · 1 by 30 yrs out
Nearby sold comps map
Loading sold comps map…
Walkable amenities ~0.75 mi
Loading nearby amenities…
Taxation est. · year 1
- Rental income
- $34,186
- − Mortgage interest
- −$9,663
- − Property taxes
- −$4,593
- − Insurance
- −$862
- − Repairs & maintenance
- −$2,735
- − Management
- −$2,735
- − Depreciation
- −$5,018
- Taxable income
- $8,580
- Est. tax owed @ 24.0%
- −$2,059
- After-tax cash flow
- $8,637/yr
For passive investors: Depreciation is non-cash, so a rental often shows a tax loss while cash-flowing — sheltering income. Rental losses are passive: they offset passive income freely, and up to $25,000/yr can offset ordinary (W-2) income if you actively participate and your MAGI is under $100k (phasing out to $0 by $150k); unused losses carry forward. On sale, claimed depreciation is recaptured at up to 25%, and gains may owe capital-gains tax (a 1031 exchange can defer both). Figures are a year-1 estimate at your 24.0% rate — not tax advice; consult a CPA.
Schools (NCES district)
- District
- Walton Central School District
- NCES district ID
- 3629820
- Math proficiency
- 36% ▬ 0.00%
- Reading proficiency
- 47% ▲ 3.00%
- Median HH income
- $41,231
- Composite
- 34.86/100
- National rank
- #5088
- State rank
- #510 of 590 in NY
Livability — Walton
- Score
- 70/100
- State rank
- #443
- US rank
- #7789
Category grades
Schools grade is shown separately in the Schools card above.
Census & demographics
- Census place
- Walton, NY
- Population (ZIP)
- 5,915
Population outlook (Delaware County) Hauer SSP2
- Today (2025)
- 42,668 people
- By 2030
- 40,337 · -5.5%
- By 2040
- 35,514 · -16.8%
- By 2050
- 31,265 · -26.7%
- By 2075
- 24,455 · -42.7%
- By 2100
- 19,529 · -54.2%
Race, ethnicity, and origin ACS 2023
- Neighborhood character
- Predominantly White (90%)
- Race & ethnicity
- White 90% Black 5% Two or more races 5% Hispanic / Latino 2%
- Common ancestry
- Iranian 7% Slovak 3% Lithuanian 3%
- Foreign-born
- 3% · Canada, Philippines
- Languages at home
- 94% English-only · Spanish 2% Other Indo-European 1% French/Haitian/Cajun 1%
Political lean MEDSL · Delaware
- 2024 margin
- R (+19.8) · D 40.1% · R 59.9%
- 2008→2024 swing
- -14.6pp toward R · 2008: -5.2pp · 2024: -19.8pp
- All cycles
- 2024: R+19.8 2020: R+18.4 2016: R+29.2 2012: R+9.6 2008: R+5.2
Not yet ingested
- Civics
- —
Market trends
- HPI YoY
- ▲ 5.79%
- Current HPI
- 331.9799
- Rent YoY
- —
- Metro
- —
- State GDP YoY
- ▲ 2.60%
- F500 in state
- 92
Industry mix (Fortune 500 HQ in NY)
| Industry | F500 HQs | Revenue |
|---|---|---|
| Financial Services | 10 | $950B |
|
||
| Consumer Goods | 9 | $162B |
|
||
| Insurance | 4 | $225B |
|
||
| Telecommunications | 2 | $144B |
|
||
| Pharmaceuticals | 2 | $112B |
|
||
| Media / Entertainment | 2 | $69B |
|
||
Price history
+72.7% since first listed6 events — show timeline
- 2026-05-15 Listed $172,500 UNYREIS
- 2024-07-30 Listing Removed — UNYREIS
- 2024-05-05 Listed $185,000 UNYREIS
- 2022-03-03 Listing Removed — UNYREIS
- 2022-01-12 Listed $115,000 UNYREIS
- 2019-03-11 Listed $99,900 UNYREIS
Property tax history
+2.8%/yrLatest (2025): $4,593 · -4.8% YoY. Source: county tax records.
Cash-flow waterfall
monthlySold comps — $/sqft
last 12 mo · ≤1 miLoading sold comps…