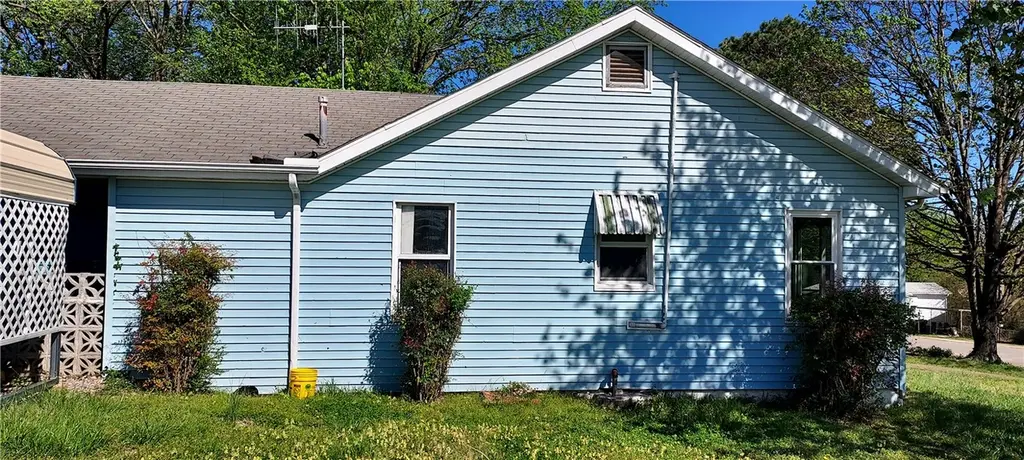
725 W Holt Ave · Harrison, AR
Flood risk 1/10 · Minimal
- FEMA flood zone
- X (unshaded)
- Chance of flooding over 30 yrs
- 0.0%
- Est. flood insurance / yr
- $507 – $1,088
Fire risk 4/10 · Minor
- Est. fire insurance / yr
- $1,499 – $2,785
Heat risk 4/10 · Minor
- Hot days now (above 104°F)
- 7 days/yr
- Hot days in 30 yrs
- 21 days/yr
Wind risk 2/10 · Minimal
- Chance of severe wind over 30 yrs
- 2.0%
Air-quality risk 1/10 · Minimal
- Unhealthy air days now
- 0 days/yr
- Unhealthy air days in 30 yrs
- 0 days/yr
Risk factors via First Street. Map © Google.
Why this score? — see what drove the B+ grade
The composite is a weighted blend of 9 inputs, each scored 0–100. Each bar is that input's sub-score; the figure is the points it added to the 100-point composite (weight × sub-score).
- Cash flow +28.5/30.0
- ARV discount +15.0/15.0
- DSCR +10.0/10.0
- 1% rule +7.0/10.0
- Schools +4.5/10.0
- Appreciation +4.0/10.0
- Livability +3.5/5.0
- Rent growth +2.5/5.0
- Condition / age +2.5/5.0
$63,600
🖨 Deal sheet 📄 Offer letter ✓ Due diligence
Listing remarks
As Is Where Is. With a little vision this could be a very nice little house. Corner lot with a nice sized yard. Very convenient to all Harrison has to offer. Come take a look won't last long. Buyer to verify all numbers & utilities.
Key facts
- 7,405 sq ft lot
- Listed 5 days
Property features AI
Finance
- Other: No additional financial or investor details provided
- Financial info: Annual tax amount listed (excluded from detailed financial grouping)
- HOA & community: HOA/association fee frequency: Monthly; Near hospital; Near schools
Exterior
- Parking: Driveway parking (gravel)
- Security: No security features listed
- Utilities: Electricity available; Public water; Public sewer
- Home design: Single-story; Age unknown
- Construction: Vinyl siding; Asphalt shingle roof; Crawlspace foundation
- Exterior features: Gravel driveway; Corner lot; Public paved road frontage
Interior
- Kitchen: No kitchen appliance details provided
- Bedrooms: Bedroom count not specified
- Flooring: Vinyl
- Bathrooms: 1 full bathroom
- Heating & cooling: Heating and cooling details not provided
- Interior features: Vinyl flooring; No additional interior features listed
- Laundry & utility: No hot water (appliance noted)
Neighborhood map
What this means for you Summary
Snapshot
- This is a 2-bed/1.0-bath single-family listed at $64k.
Deal economics
- At list price, monthly cash flow is $208 ($2k/yr) — positive.
- The deal already cash-flows at list — no discount required.
- Meets the 1% rule at list price ($761 rent vs $64k).
- Cap rate 10.2% vs local median 3.0% in Harrison — top-decile yield for the area; either an underpriced asset or a hidden risk that comps aren't pricing in. Stress-test before assuming the spread holds.
Location & tenants
- Location reads 70/100 on livability (#52 in AR) — a middle-class / working-renter tenant base. Strengths: cost of living A+, housing A+, health & safety A+; Watch: amenities F, commute F, employment F.
- Harrison School District (town): math 53% / reading 54% proficiency, ranked #11 of 238 in AR (top 5%) — acceptable for families but not a draw, mixed tenant base, ~2y average lease.
- Market conditions: 437 active listings in the ZIP; 2 comparable units currently listed for rent nearby; 92 units permitted in Boone County in 2024 (72 in 5+ unit buildings).
Forward outlook
- Local home prices are declining (-1.9%/yr); year-one equity from $440 of loan paydown is wiped out by about $1k of value loss. Plan a longer hold.
- Boone County population projected to shrink 8% by 2050 — rents likely to lag national; underwrite the cash flow, not the appreciation.
- At projected returns (-1.9% appreciation + 3.0% rent growth), your $18k cash investment doubles in ~8 years — after that, you're playing with house money.
Negotiation context
- Only 5 days on market — expect competitive offers; lowballing is unlikely to land.
Questions for the listing agent
- Is there a deadline driving the sale (1031 exchange, divorce, estate, relocation)? That informs how much negotiation room exists.
- What's the average days-on-market for RENTAL listings here right now (not sales)? A rising rental-DOM trend means longer vacancies and softer asking-rent achievability than the comps imply.
- What's the recent tenant-quality profile in this submarket — average credit score on applications, eviction rate, late-payment / NSF rate, and stable-employment percentage? A property-management company in the area should have these aggregated.
- How much new for-sale + rental construction is in the pipeline within 1–3 miles? Heavy new supply typically softens prices + rents 12–24 months out; constrained supply supports both.
Investment metrics
- 1% rule
- 1.20% ✓
- Cap rate
- 10.21%
- Cash-on-cash
- 13.99%
- DSCR
- 1.62
- GRM
- 7.0
CMA / ARV
- ARV (on-the-fly)
- $124,200
- Comps found
- 12
Show comp detail 12 sales within ~0.75 mi
| Address | Dist | Beds/Ba | Sqft | Sold | Price | $/sf | Match |
|---|---|---|---|---|---|---|---|
| 725 W Holt Ave | 0.00mi | 2/1.0 | 920 (0%) | 0mo | $74,000 | $80 | 100 |
| 1003 Maple St | 0.15mi | 3/1.0 (+1) | 896 (-3%) | 13mo | $90,000 | $100 | 73 |
| 617 W Holt Ave | 0.10mi | 2/1.0 | 864 (-6%) | 16mo | $81,000 | $94 | 72 |
| 1011 N Pine | 0.27mi | 2/1.0 | 820 (-11%) | 1mo | $97,000 | $118 | 69 |
| 410 N Maple St | 0.35mi | 2/1.5 | 984 (+7%) | 2mo | $130,000 | $132 | 68 |
| 705 Oak St | 0.18mi | 2/1.0 | 792 (-14%) | 4mo | $112,000 | $141 | 65 |
| 224 N Allen St | 0.57mi | 2/1.0 | 978 (+6%) | 0mo | $145,000 | $148 | 62 |
| 119 N Oak St | 0.60mi | 2/1.0 | 864 (-6%) | 1mo | $124,000 | $144 | 61 |
| 404 N Maple St | 0.38mi | 2/1.0 | 1,028 (+12%) | 6mo | $140,000 | $136 | 58 |
| 1022 Ridge Ave | 0.56mi | 3/1.0 (+1) | 1,004 (+9%) | 6mo | $76,000 | $76 | 49 |
| 424 N Olive St | 0.75mi | 2/1.0 | 960 (+4%) | 13mo | $130,000 | $135 | 47 |
| 723 W Stephenson Ave | 0.63mi | 3/1.0 (+1) | 816 (-11%) | 14mo | $112,000 | $137 | 35 |
Match score weights: distance 35% · size 25% · config 20% · recency 20%. Top-matched comps best support the ARV.
Projected returns pro-forma
-1.92% appreciation · 3.0% rent growth · sell at horizon
- IRR
- 7.8%
- Equity multiple
- 1.33×
- Total profit
- $5,809
- Equity at exit
- $12,582
- IRR
- 15.3%
- Equity multiple
- 2.38×
- Total profit
- $24,620
- Equity at exit
- $10,972
Cash invested: $17,808 (down + closing). Projections, not guarantees.
Landlord ↔ Tenant lean methodology
- Overall (STATE)
- 92 Strongly Landlord-Friendly
- State Arkansas
- 92 Strongly Landlord-Friendly · R+14
- County
- — inherits STATE
- City
- — inherits STATE
ZIP-level market 72601
- Home prices YoY
- -0.8%
- Active inventory
- 437
- Price-to-rent
- 7.0×
Monthly cashflow live
- Estimated rent
- $761 medium interval (Pro) →
- Mortgage (P&I)
- −$334
- Tax from tax record
- −$34 /mo · $407/yr
- Insurance
- −$26
- HOA
- −$0
- Vacancy / Maint / Mgmt
- −$160
- Net cashflow
- $208
Break-even live
UW: 25.0% down · 7.5% · 30yr · 1.5% tax · 5.0% vac · 8.0% maint · 8.0% mgmt
Financing live
Cash to close
- Down payment
- $15,900
- Closing costs
- $1,908
- Reserves months
- —
- Total cash needed
- —
Loan-product check · same deal, 3 products live
Conventional
25% down · 7.5% · 30yr
- Down + closing
- —
- Monthly P&I
- —
- Monthly cashflow
- —
- DSCR
- —
- Eligible?
- —
Personal DTI + credit; lowest rate.
DSCR
20% down · 8.5% · 30yr
- Down + closing
- —
- Monthly P&I
- —
- Monthly cashflow
- —
- DSCR
- —
- Eligible?
- —
No personal income docs; deal must DSCR.
Hard money
10% down · 12.0% · 12mo
- Down + closing
- —
- Monthly P&I
- —
- Monthly cashflow
- —
- DSCR
- —
- Eligible?
- —
Short-term bridge; refi at stabilization.
Rent comps 2 comps
| Address | Beds | Baths | Sqft | Rent | $/sqft | DOM | Units | Dist |
|---|---|---|---|---|---|---|---|---|
| 1101 N Cherry St Unit A Harrison, AR | 2.0 | 1.0 | 1000 | $750 | $0.75 | 44d | 1 | 0.19mi |
| 1502 Dawson Dr Harrison, AR | 1.0 | 1.0 | 660 | $825 | $1.25 | 44d | 1 | 0.82mi |
Listing history 4 events
-
2026-05-12status Pending
-
2026-05-07$63,600 Active
-
2007-11-14soldstatus $60,000
-
2005-04-15soldstatus $41,000
ⓘ Source: listings_history table (triggers on properties + properties_extension) + one-shot
backfill from property_details.listing_events for pre-trigger history.
Tax reassessment forecast AR · Resets to sale price
- Current annual tax
- $407 · $34/mo
- Projected year-2 tax
- $407 · $34/mo
- Expected delta
- $0/yr ($0/mo · 0.0%)
ⓘ Screening estimate from a state-policy table — verify with the county assessor before closing.
Climate risk First Street
- Flood 1/10 Low FEMA zone X (unshaded) · 0% chance over 30 yrs
- Wildfire 4/10 Moderate
- Heat 4/10 Moderate 7 d/yr ≥104°F today · 21 d/yr by 30 yrs out
- Wind 2/10 Low 2% chance of damaging wind over 30 yrs
- Air quality 1/10 Low 0 unhealthy d/yr today · 0 by 30 yrs out
Nearby sold comps map
Loading sold comps map…
Walkable amenities ~0.75 mi
Loading nearby amenities…
Taxation est. · year 1
- Rental income
- $9,137
- − Mortgage interest
- −$3,563
- − Property taxes
- −$407
- − Insurance
- −$318
- − Repairs & maintenance
- −$731
- − Management
- −$731
- − Depreciation
- −$1,850
- Taxable income
- $1,537
- Est. tax owed @ 24.0%
- −$369
- After-tax cash flow
- $2,122/yr
For passive investors: Depreciation is non-cash, so a rental often shows a tax loss while cash-flowing — sheltering income. Rental losses are passive: they offset passive income freely, and up to $25,000/yr can offset ordinary (W-2) income if you actively participate and your MAGI is under $100k (phasing out to $0 by $150k); unused losses carry forward. On sale, claimed depreciation is recaptured at up to 25%, and gains may owe capital-gains tax (a 1031 exchange can defer both). Figures are a year-1 estimate at your 24.0% rate — not tax advice; consult a CPA.
Schools (NCES district)
- District
- Harrison School District
- NCES district ID
- 0507380
- Math proficiency
- 53% ▼ -9.00%
- Reading proficiency
- 54% ▼ -6.00%
- Median HH income
- $37,726
- Composite
- 44.51/100
- National rank
- #2796
- State rank
- #11 of 238 in AR
Livability — Harrison
- Score
- 70/100
- State rank
- #52
- US rank
- #7654
Category grades
Schools grade is shown separately in the Schools card above.
Census & demographics
- Census place
- Harrison, AR
- Population (ZIP)
- 30,180
Population outlook (Boone County) Hauer SSP2
- Today (2025)
- 37,238 people
- By 2030
- 36,808 · -1.2%
- By 2040
- 35,597 · -4.4%
- By 2050
- 34,197 · -8.2%
- By 2075
- 30,503 · -18.1%
- By 2100
- 25,797 · -30.7%
Race, ethnicity, and origin ACS 2023
- Neighborhood character
- Predominantly White (93%)
- Race & ethnicity
- White 93% Two or more races 4% Hispanic / Latino 3%
- Common ancestry
- Lithuanian 3% Slovak 2% Serbian 2%
- Foreign-born
- 1% · Canada
- Languages at home
- 97% English-only · Spanish 2%
Political lean MEDSL · Boone
- 2024 margin
- Solid R (+65.0) · D 16.7% · R 81.6% · Other 1.7%
- 2008→2024 swing
- -25.3pp toward R · 2008: -39.7pp · 2024: -65.0pp
- All cycles
- 2024: R+65.0 2020: R+61.9 2016: R+58.5 2012: R+48.0 2008: R+39.7
Not yet ingested
- Civics
- —
Market trends
- HPI YoY
- ▼ -1.92%
- Current HPI
- 247.043
- Rent YoY
- —
- Metro
- —
- State GDP YoY
- ▲ 3.80%
- F500 in state
- 10
Industry mix (Fortune 500 HQ in AR)
| Industry | F500 HQs | Revenue |
|---|---|---|
| Retail | 1 | $681B |
|
||
| Food / Agriculture | 1 | $53B |
|
||
| Retail / Energy | 1 | $22B |
|
||
| Transportation / Logistics | 1 | $12B |
|
||
| Energy | 1 | $4B |
|
||
Price history
+55.1% since first listed4 events — show timeline
- 2026-05-12 Pending — NWARMLS
- 2026-05-07 Listed $63,600 NWARMLS
- 2007-11-14 Sold (Public Records) $60,000 Public Records
- 2005-04-15 Sold (Public Records) $41,000 Public Records
Property tax history
+2.1%/yrLatest (2025): $407 · +0.0% YoY. Source: county tax records.
Cash-flow waterfall
monthlySold comps — $/sqft
last 12 mo · ≤1 miLoading sold comps…