 Duplex
17 Elm St · Piermont, NY
Flood risk 1/10 · Minimal
- FEMA flood zone
- X (unshaded)
- Chance of flooding over 30 yrs
- 0.0%
- Est. flood insurance / yr
- $473 – $860
Fire risk 3/10 · Minor
- Est. fire insurance / yr
- $691 – $1,283
Heat risk 6/10 · Moderate
- Hot days now (above 101°F)
- 7 days/yr
- Hot days in 30 yrs
- 15 days/yr
Wind risk 6/10 · Moderate
- Chance of severe wind over 30 yrs
- 27.0%
Air-quality risk 4/10 · Minor
- Unhealthy air days now
- 4 days/yr
- Unhealthy air days in 30 yrs
- 6 days/yr
Risk factors via First Street. Map © Google.
Why this score? — see what drove the C- grade
The composite is a weighted blend of 9 inputs, each scored 0–100. Each bar is that input's sub-score; the figure is the points it added to the 100-point composite (weight × sub-score).
- Cash flow +15.7/30.0
- ARV discount +15.0/15.0
- Schools +5.5/10.0
- 1% rule +4.9/10.0
- DSCR +4.8/10.0
- Livability +3.4/5.0
- Rent growth +2.5/5.0
- Condition / age +2.5/5.0
- Appreciation +0.0/10.0
$629,000
🖨 Deal sheet 📄 Offer letter ✓ Due diligence
Multi-family units
County records classify this as Multi-Family (2-4 Unit). Listing-text estimate: 2 units. confirmed
Listing remarks MLS
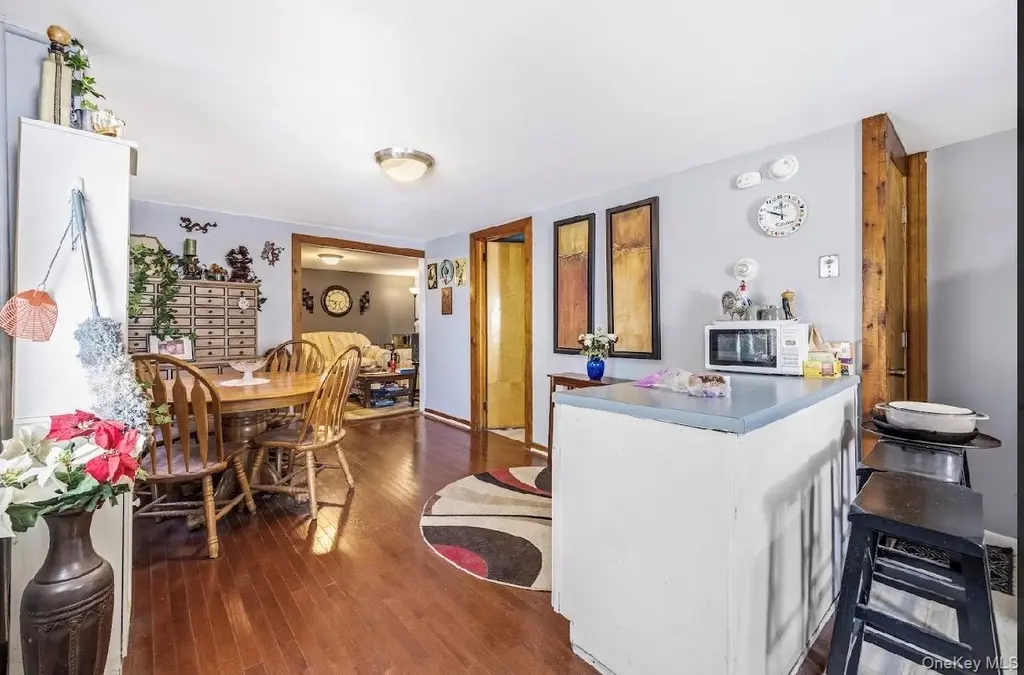
GREAT OPPORTUNITY to live or invest in this home in the quaint village of Piermont. This 2-family home has two separate apartments, The lower-level unit has 2 bedrooms and 1 bath. The upper-level unit has 1 bedroom. Separate electric and gas meter for each unit. Driveway shared between units. Just a short walk to restaurants, farmers market, art galleries, and Tallman pool club.
Key facts
- 2 family home
- Separate apartments
- 1,307 sq ft lot
Tags
Neighborhood map
What this means for you Summary
Snapshot
- This is a 2 × 3-bed/2.0-bath units multifamily listed at $629k.
Deal economics
- At list price, monthly cash flow is $271 ($3k/yr) — positive. Per door: $135/mo.
- The deal already cash-flows at list — no discount required.
- To meet the 1% rule (rent ≥ 1% of price), the offer needs to be $624k (0.8% below list).
- Recommended offer: $610k (3.0% below list) — sets the bar for market timing.
- Cap rate 6.8% vs local median 0.4% in Piermont — top-decile yield for the area; either an underpriced asset or a hidden risk that comps aren't pricing in. Stress-test before assuming the spread holds.
Location & tenants
- Location reads 67/100 on livability (#571 in NY) — a middle-class / working-renter tenant base. Strengths: crime A+, employment A+, housing B; Watch: schools C-, amenities F, commute F.
- South Orangetown Central School District (suburban): math 52% / reading 66% proficiency, ranked #183 of 590 in NY (top 31%) — acceptable for families but not a draw, mixed tenant base, ~2y average lease; only 8% free/reduced lunch — higher-income household profile.
- Market conditions: 29 active listings in the ZIP; 4 comparable units currently listed for rent nearby; rentals at typical pace (median 19d on market — plan ~3-4 weeks tenant-placement turnaround); high-income renter base; 429 units permitted in Rockland County in 2024 (231 in 5+ unit buildings).
- At $6,240/mo this rent would consume 52% of the median local household income ($145k/yr) (locally 82% of renters already pay >50% of income on rent) — very limited rent-growth headroom before tenants either downsize or default.
Forward outlook
- Local home prices are declining (-3.0%/yr); year-one equity from $4k of loan paydown is wiped out by about $19k of value loss. Plan a longer hold.
- Rockland County population projected at +7% by 2050 — modest demand growth; plan on rents tracking national, not racing it.
Negotiation context
- It's been on market 54 days — a 3% lower offer ($610k) is reasonable based on typical stale-listing flexibility.
Risks & watch-outs
- Watch-outs: built in 1910 — expect roof / HVAC / electrical / plumbing capex.
- Climate carrying-cost: major wind risk, 27% chance of damaging wind over 30y; extreme-heat days projected 7→15/yr by 2055 (HVAC capex compounding) — expect insurance premiums to compound above CPI over the hold.
Questions for the listing agent
- It's been on market 54 days. Have you received any prior offers? Is the seller open to a 3% concession, seller financing, or rate buy-down credit?
- Can we see the unit-by-unit rent roll, current vacancy, and any below-market leases? What's the average tenancy length?
- What capital expenditures (roof, boiler, parking lot, exteriors) have been made in the last 5 years, and what's planned in the next 2?
- Built in 1910 — when were the roof, HVAC, electrical panel, plumbing, and water heater last replaced?
- Is there a deadline driving the sale (1031 exchange, divorce, estate, relocation)? That informs how much negotiation room exists.
- What's the average days-on-market for RENTAL listings here right now (not sales)? A rising rental-DOM trend means longer vacancies and softer asking-rent achievability than the comps imply.
- What's the recent tenant-quality profile in this submarket — average credit score on applications, eviction rate, late-payment / NSF rate, and stable-employment percentage? A property-management company in the area should have these aggregated.
- How much new apartment / multifamily construction is in the pipeline within 1–3 miles? Heavy new supply (>2% of stock underway) typically softens rents 12–24 months out; light construction supports rent growth.
Investment metrics
- 1% rule
- 0.99% ✗
- Cap rate
- 6.81%
- Cash-on-cash
- 1.84%
- DSCR
- 1.08
- GRM
- 8.4
CMA / ARV
- ARV (median comp)
- $1,040,225
- List price
- $629,000
- Delta
- -39.53%
- Verdict
- UNDERPRICED
- Comps
- 6 within 1.0 mi
Projected returns pro-forma
-3.0% appreciation · 3.0% rent growth · sell at horizon
- IRR
- -13.3%
- Equity multiple
- 0.52×
- Total profit
- $-84,398
- Equity at exit
- $93,786
- IRR
- -4.3%
- Equity multiple
- 0.72×
- Total profit
- $-50,131
- Equity at exit
- $54,384
Cash invested: $176,120 (down + closing). Projections, not guarantees.
Landlord ↔ Tenant lean methodology
- Overall (STATE)
- 15 Strongly Tenant-Friendly
- State New York
- 15 Strongly Tenant-Friendly · D+10
- County
- — inherits STATE
- City
- — inherits STATE
ZIP-level market 10968
- Home prices YoY
- -24.4%
- Active inventory
- 29
- Price-to-rent
- 16.8×
Monthly cashflow live
- Estimated rent
- $6,240 medium interval (Pro) →
- Mortgage (P&I)
- −$3,299
- Tax from tax record
- −$1,098 /mo · $13,179/yr
- Insurance
- −$262
- HOA
- −$0
- Vacancy / Maint / Mgmt
- −$1,310
- Net cashflow
- $271
Break-even live
2-unit breakdown (identical units grouped — click to expand)
| Units | Beds | Baths | Est. rent |
|---|---|---|---|
| 2× units | 3 | 2 | $6,240 |
| #1 | 3 | 2 | $3,120 |
| #2 | 3 | 2 | $3,120 |
| Total (2 units) | $6,240 | ||
UW: 25.0% down · 7.5% · 30yr · 1.5% tax · 5.0% vac · 8.0% maint · 8.0% mgmt
Financing live
Cash to close
- Down payment
- $157,250
- Closing costs
- $18,870
- Reserves months
- —
- Total cash needed
- —
Loan-product check · same deal, 3 products live
Conventional
25% down · 7.5% · 30yr
- Down + closing
- —
- Monthly P&I
- —
- Monthly cashflow
- —
- DSCR
- —
- Eligible?
- —
Personal DTI + credit; lowest rate.
DSCR
20% down · 8.5% · 30yr
- Down + closing
- —
- Monthly P&I
- —
- Monthly cashflow
- —
- DSCR
- —
- Eligible?
- —
No personal income docs; deal must DSCR.
Hard money
10% down · 12.0% · 12mo
- Down + closing
- —
- Monthly P&I
- —
- Monthly cashflow
- —
- DSCR
- —
- Eligible?
- —
Short-term bridge; refi at stabilization.
Rent comps 4 comps
| Address | Beds | Baths | Sqft | Rent | $/sqft | DOM | Units | Dist |
|---|---|---|---|---|---|---|---|---|
| 351 Piermont Ave Piermont, NY | 3.0 | 1.5 | 1694 | $5,295 | $3.13 | 1d | 1 | 0.27mi |
| 306 Piermont Ave Piermont, NY | 3.0 | 2.0 | 1375 | $3,950 | $2.87 | 19d | 1 | 0.36mi |
| 1 W Lawrence Park Dr #12 Piermont, NY | 2.0 | 2.0 | 1400 | $2,850 | $2.04 | 13d | 1 | 0.69mi |
| 1 W Lawrence Park Dr #12 Piermont, NY | 2.0 | 1.5 | 1200 | $2,850 | $2.38 | 24d | 1 | 0.69mi |
Listing history 2 events
-
2026-05-06status Pending 384-char remark
Show marketing remark (384 chars)
GREAT OPPORTUNITY to live or invest in this home in the quaint village of Piermont. This 2-family home has two separate apartments, The lower-level unit has 2 bedrooms and 1 bath. The upper-level unit has 1 bedroom. Separate electric and gas meter for each unit. Driveway shared between units. Just a short walk to restaurants, farmers market, art galleries, and Tallman pool club.
-
2026-03-13$629,000 Active 384-char remark
Show marketing remark (384 chars)
GREAT OPPORTUNITY to live or invest in this home in the quaint village of Piermont. This 2-family home has two separate apartments, The lower-level unit has 2 bedrooms and 1 bath. The upper-level unit has 1 bedroom. Separate electric and gas meter for each unit. Driveway shared between units. Just a short walk to restaurants, farmers market, art galleries, and Tallman pool club.
ⓘ Source: listings_history table (triggers on properties + properties_extension) + one-shot
backfill from property_details.listing_events for pre-trigger history.
Tax reassessment forecast NY · Partial reset (capped growth)
- Current annual tax
- $13,179 · $1,098/mo
- Projected year-2 tax
- $13,179 · $1,098/mo
- Expected delta
- $0/yr ($0/mo · 0.0%)
ⓘ Screening estimate from a state-policy table — verify with the county assessor before closing.
Climate risk First Street
- Flood 1/10 Low FEMA zone X (unshaded) · 0% chance over 30 yrs
- Wildfire 3/10 Moderate
- Heat 6/10 Major 7 d/yr ≥101°F today · 15 d/yr by 30 yrs out
- Wind 6/10 Major 27% chance of damaging wind over 30 yrs
- Air quality 4/10 Moderate 4 unhealthy d/yr today · 6 by 30 yrs out
Nearby sold comps map
Loading sold comps map…
Walkable amenities ~0.75 mi
Loading nearby amenities…
Taxation est. · year 1
- Rental income
- $74,880
- − Mortgage interest
- −$35,234
- − Property taxes
- −$13,179
- − Insurance
- −$3,145
- − Repairs & maintenance
- −$5,990
- − Management
- −$5,990
- − Depreciation
- −$18,298
- Taxable loss
- −$6,957
- Est. tax savings @ 24.0%
- +$1,670
- After-tax cash flow
- $4,918/yr
For passive investors: Depreciation is non-cash, so a rental often shows a tax loss while cash-flowing — sheltering income. Rental losses are passive: they offset passive income freely, and up to $25,000/yr can offset ordinary (W-2) income if you actively participate and your MAGI is under $100k (phasing out to $0 by $150k); unused losses carry forward. On sale, claimed depreciation is recaptured at up to 25%, and gains may owe capital-gains tax (a 1031 exchange can defer both). Figures are a year-1 estimate at your 24.0% rate — not tax advice; consult a CPA.
Schools (NCES district)
- District
- South Orangetown Central School District
- NCES district ID
- 3627450
- Math proficiency
- 52% ▼ -15.00%
- Reading proficiency
- 66% ▲ 4.00%
- Median HH income
- $102,606
- Composite
- 55.22/100
- National rank
- #1270
- State rank
- #183 of 590 in NY
Livability — Piermont
- Score
- 67/100
- State rank
- #571
- US rank
- #10275
Category grades
Schools grade is shown separately in the Schools card above.
Census & demographics
- Census place
- Piermont, NY
- County
- Rockland County · 98,828 people
- City population
- 2,456
- Metro
- New York-Newark-Jersey City, NY-NJ-PA
- Population (ZIP)
- 2,456
- Household income
- $145,000
- Rent vs Own
- Severe rent burden
- 82.0
Population outlook (Rockland County) Hauer SSP2
- Today (2025)
- 339,642 people
- By 2030
- 345,987 · +1.9%
- By 2040
- 357,178 · +5.2%
- By 2050
- 362,456 · +6.7%
- By 2075
- 367,281 · +8.1%
- By 2100
- 328,211 · -3.4%
Race, ethnicity, and origin ACS 2023
- Neighborhood character
- Predominantly White (82%)
- Race & ethnicity
- White 82% Asian 10% Hispanic / Latino 5% Two or more races 3% Black 1%
- Common ancestry
- Romanian 7% Scotch-Irish 5% Lithuanian 4%
- Foreign-born
- 12% · South Korea, Canada, China
- Languages at home
- 87% English-only · Korean 6% Other Indo-European 2% Spanish 2%
Political lean MEDSL · Rockland
- 2024 margin
- R (+11.8) · D 44.1% · R 55.9%
- 2008→2024 swing
- -17.7pp toward R · 2008: 5.9pp · 2024: -11.8pp
- All cycles
- 2024: R+11.8 2020: D+1.7 2016: D+5.1 2012: D+6.6 2008: D+5.9
Not yet ingested
- Civics
- —
Market trends
- HPI YoY
- ▼ -72.10%
- Current HPI
- 223.2897
- Rent YoY
- —
- Metro
- New York-Newark-Jersey City, NY-NJ-PA
- State GDP YoY
- ▲ 2.60%
- F500 in state
- 92
Industry mix (Fortune 500 HQ in NY)
| Industry | F500 HQs | Revenue |
|---|---|---|
| Financial Services | 10 | $950B |
|
||
| Consumer Goods | 9 | $162B |
|
||
| Insurance | 4 | $225B |
|
||
| Telecommunications | 2 | $144B |
|
||
| Pharmaceuticals | 2 | $112B |
|
||
| Media / Entertainment | 2 | $69B |
|
||
Price history
2 events — show timeline
- 2026-05-06 Pending — OneKey® MLS as Distributed by MLS Grid
- 2026-03-13 Listed $629,000 OneKey® MLS as Distributed by MLS Grid
Property tax history
+6.6%/yrLatest (2025): $13,179 · +66.8% YoY. Source: county tax records.
Cash-flow waterfall
monthlySold comps — $/sqft
last 12 mo · ≤1 miLoading sold comps…