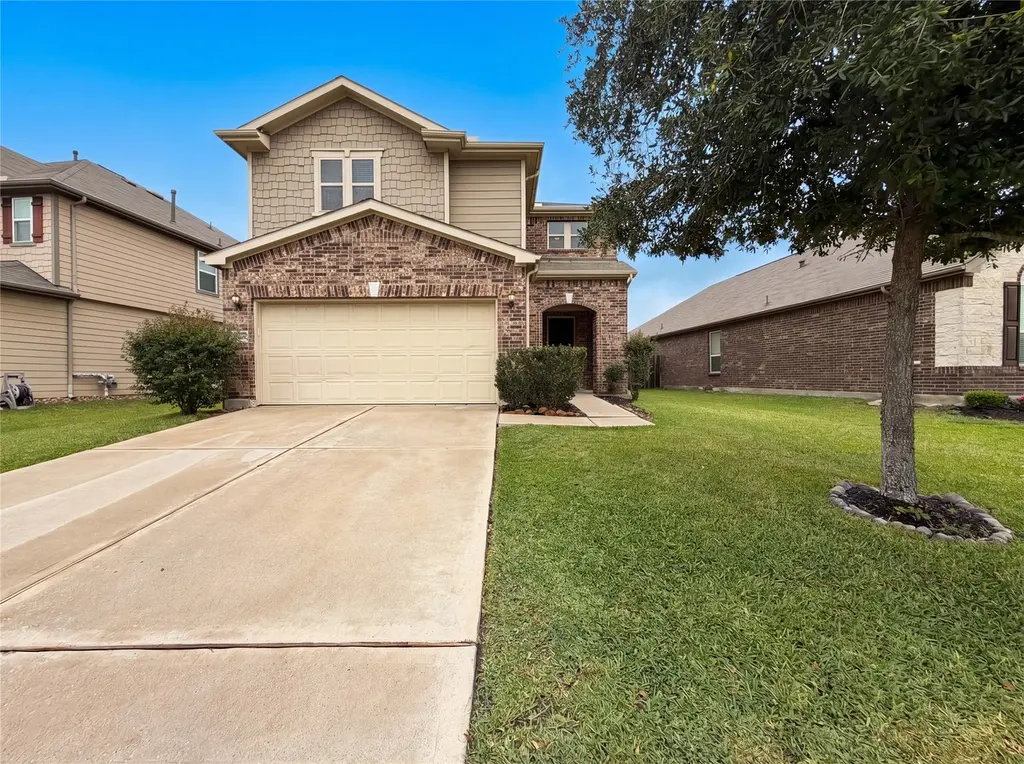
4022 Lake Cypress Cir · Houston, TX
Flood risk 3/10 · Minor
- FEMA flood zone
- X (unshaded)
- Chance of flooding over 30 yrs
- 0.1%
- Est. flood insurance / yr
- $507 – $1,088
Fire risk 3/10 · Minor
- Est. fire insurance / yr
- $1,222 – $2,270
Heat risk 9/10 · Severe
- Hot days now (above 111°F)
- 7 days/yr
- Hot days in 30 yrs
- 24 days/yr
Wind risk 8/10 · Major
- Chance of severe wind over 30 yrs
- 99.0%
Air-quality risk 3/10 · Minor
- Unhealthy air days now
- 3 days/yr
- Unhealthy air days in 30 yrs
- 3 days/yr
Risk factors via First Street. Map © Google.
Why this score? — see what drove the B+ grade
The composite is a weighted blend of 9 inputs, each scored 0–100. Each bar is that input's sub-score; the figure is the points it added to the 100-point composite (weight × sub-score).
- Cash flow +30.0/30.0
- ARV discount +12.5/15.0
- 1% rule +10.0/10.0
- DSCR +10.0/10.0
- Appreciation +3.9/10.0
- Livability +3.7/5.0
- Rent growth +2.5/5.0
- Condition / age +2.5/5.0
- Schools +2.0/10.0
$297,000
🖨 Deal sheet 📄 Offer letter ✓ Due diligence
Listing remarks MLS
Meet 4022 Lake Cypress Cir, recently updated with fresh interior paint, partial flooring replacement, and new flooring throughout. The kitchen includes an accent backsplash and island. The primary bedroom contains a walk in closet. its bathroom features double sinks and a separate tub and shower. Outside, a covered patio and fenced in backyard are present. Thoughtful updates and functional features make this home a must-see. Included 100-Day Home Warranty with buyer activation.
Key facts
- Fenced in backyard
- Covered patio
- Walk in closet
Tags
Neighborhood map
What this means for you Summary
Snapshot
- This is a 5-bed/3.0-bath single-family listed at $297k.
Deal economics
- At list price, monthly cash flow is $4k ($44k/yr) — positive.
- The deal already cash-flows at list — no discount required.
- Meets the 1% rule at list price ($8k rent vs $297k).
- Recommended offer: $279k (6.0% below list) — sets the bar for market timing.
- Cap rate 21.0% vs local median 3.2% in Houston — top-decile yield for the area; either an underpriced asset or a hidden risk that comps aren't pricing in. Stress-test before assuming the spread holds.
Location & tenants
- Location reads 74/100 on livability (#184 in TX, #4,771 nationally) — a middle-class / working-renter tenant base. Strengths: amenities A+, cost of living A+, housing A+; Watch: schools D, crime F.
- Spring ISD (suburban): math 19% / reading 26% proficiency, ranked #730 of 826 in TX (top 88%) — low school quality limits family demand, transient renter base, plan for 1-2y turnover; 66% free/reduced lunch — lower-income household profile, screen leases tightly.
- Market conditions: 117 active listings in the ZIP; 2 comparable units currently listed for rent nearby; 29,883 units permitted in Harris County in 2024 (8,621 in 5+ unit buildings).
Forward outlook
- Local home prices are declining (-2.1%/yr); year-one equity from $2k of loan paydown is wiped out by about $6k of value loss. Plan a longer hold.
- Harris County population projected at +47% by 2050 — long-run rental-demand tailwind backs the buy-and-hold thesis.
- At projected returns (-2.1% appreciation + 3.0% rent growth), your $83k cash investment doubles in ~3 years — after that, you're playing with house money.
Negotiation context
- It's been on market 63 days — a 6% lower offer ($279k) is reasonable based on typical stale-listing flexibility.
- 2 sale attempts since 9y ago; this cycle's ask has dropped $20k (6%) from the opening price — seller is motivated, your offer sets the floor, not the list.
Risks & watch-outs
- Watch-outs: property tax is 2.7% of price.
- Climate carrying-cost: severe wind risk, 99% chance of damaging wind over 30y; extreme-heat days projected 7→24/yr by 2055 (HVAC capex compounding) — expect insurance premiums to compound above CPI over the hold.
Questions for the listing agent
- It's been on market 63 days. Have you received any prior offers? Is the seller open to a 6% concession, seller financing, or rate buy-down credit?
- Property tax is high relative to price — has the assessment been appealed recently, and will the sale trigger a re-assessment?
- What does the HOA fee cover, when was the last increase, and are there any pending special assessments or reserve-fund shortfalls?
- Why hasn't it sold? Are there any deal-killer items the seller is aware of (foundation, flood, title, zoning, code violations)?
- Is there a deadline driving the sale (1031 exchange, divorce, estate, relocation)? That informs how much negotiation room exists.
- Schools are D-rated, which usually means shorter tenancies and higher turnover. Who's the typical renter profile here, and what's been the actual vacancy rate?
- Crime grade is F in this area — have there been break-ins, vandalism, or insurance claims at this property in the last 3 years? What carrier currently insures it and at what premium?
- What's the average days-on-market for RENTAL listings here right now (not sales)? A rising rental-DOM trend means longer vacancies and softer asking-rent achievability than the comps imply.
- What's the recent tenant-quality profile in this submarket — average credit score on applications, eviction rate, late-payment / NSF rate, and stable-employment percentage? A property-management company in the area should have these aggregated.
- How much new for-sale + rental construction is in the pipeline within 1–3 miles? Heavy new supply typically softens prices + rents 12–24 months out; constrained supply supports both.
Investment metrics
- 1% rule
- 2.58% ✓
- Cap rate
- 20.98%
- Cash-on-cash
- 52.44%
- DSCR
- 3.33
- GRM
- 3.2
CMA / ARV
- ARV (median comp)
- $334,191
- List price
- $297,000
- Delta
- -11.13%
- Verdict
- UNDERPRICED
- Comps
- 20 within 1.0 mi
Show comp detail 12 sales within ~0.75 mi
| Address | Dist | Beds/Ba | Sqft | Sold | Price | $/sf | Match |
|---|---|---|---|---|---|---|---|
| 4022 Streambed Trl | 0.18mi | 4/2.5 (-1) | 2,792 (+3%) | 2mo | $325,000 | $116 | 78 |
| 4215 False Cypress Ln | 0.22mi | 4/2.5 (-1) | 2,596 (-4%) | 3mo | $285,000 | $110 | 73 |
| 3915 Glenheather Dr | 0.15mi | 4/2.5 (-1) | 2,450 (-10%) | 2mo | $319,900 | $131 | 68 |
| 15007 Walters Rd | 0.53mi | 4/2.5 (-1) | 2,730 (+0%) | 1mo | $279,900 | $103 | 67 |
| 4118 Streambed Trl | 0.18mi | 4/2.5 (-1) | 2,979 (+10%) | 6mo | $359,999 | $121 | 64 |
| 4418 Windmill Run Dr | 0.70mi | 4/3.0 (-1) | 2,760 (+2%) | 0mo | $332,000 | $120 | 60 |
| 4206 Tulip Oak Dr | 0.24mi | 4/2.5 (-1) | 2,362 (-13%) | 2mo | $310,000 | $131 | 59 |
| 3614 Shanemoss Ct | 0.60mi | 4/2.5 (-1) | 2,852 (+5%) | 2mo | $299,990 | $105 | 55 |
| 14543 Overland Hollow Dr | 0.69mi | 4/3.0 (-1) | 2,606 (-4%) | 5mo | $334,900 | $129 | 52 |
| 15406 Falling Creek Dr | 0.61mi | 4/2.5 (-1) | 2,950 (+9%) | 3mo | $315,000 | $107 | 47 |
| 15515 San Milo Dr | 0.62mi | 4/3.5 (-1) | 3,056 (+12%) | 2mo | $345,000 | $113 | 42 |
| 15302 Walters Rd | 0.73mi | 4/2.5 (-1) | 3,059 (+13%) | 4mo | $215,000 | $70 | 35 |
Match score weights: distance 35% · size 25% · config 20% · recency 20%. Top-matched comps best support the ARV.
Projected returns pro-forma
-2.14% appreciation · 3.0% rent growth · sell at horizon
- IRR
- 51.5%
- Equity multiple
- 3.34×
- Total profit
- $194,541
- Equity at exit
- $55,852
- IRR
- 56.1%
- Equity multiple
- 6.75×
- Total profit
- $478,455
- Equity at exit
- $45,998
Cash invested: $83,160 (down + closing). Projections, not guarantees.
Landlord ↔ Tenant lean methodology
- Overall (STATE)
- 87 Strongly Landlord-Friendly
- State Texas
- 87 Strongly Landlord-Friendly · R+5
- County
- — inherits STATE
- City
- — inherits STATE
ZIP-level market 77068
- Home prices YoY
- -1.0%
- Active inventory
- 117
- Price-to-rent
- 3.2×
Monthly cashflow live
- Estimated rent
- $7,666 medium interval (Pro) →
- Mortgage (P&I)
- −$1,558
- Tax from tax record
- −$665 /mo · $7,975/yr
- Insurance
- −$124
- HOA
- −$76
- Vacancy / Maint / Mgmt
- −$1,610
- Net cashflow
- $3,634
Break-even live
UW: 25.0% down · 7.5% · 30yr · 1.5% tax · 5.0% vac · 8.0% maint · 8.0% mgmt
Financing live
Cash to close
- Down payment
- $74,250
- Closing costs
- $8,910
- Reserves months
- —
- Total cash needed
- —
Loan-product check · same deal, 3 products live
Conventional
25% down · 7.5% · 30yr
- Down + closing
- —
- Monthly P&I
- —
- Monthly cashflow
- —
- DSCR
- —
- Eligible?
- —
Personal DTI + credit; lowest rate.
DSCR
20% down · 8.5% · 30yr
- Down + closing
- —
- Monthly P&I
- —
- Monthly cashflow
- —
- DSCR
- —
- Eligible?
- —
No personal income docs; deal must DSCR.
Hard money
10% down · 12.0% · 12mo
- Down + closing
- —
- Monthly P&I
- —
- Monthly cashflow
- —
- DSCR
- —
- Eligible?
- —
Short-term bridge; refi at stabilization.
Rent comps 2 comps
| Address | Beds | Baths | Sqft | Rent | $/sqft | DOM | Units | Dist |
|---|---|---|---|---|---|---|---|---|
| 4622 Falling Sun Dr Houston, TX | 4.0 | 3.0 | 2485 | $2,500 | $1.01 | 43d | 1 | 0.79mi |
| 5135 Westerham Pl Unit 1262307P Houston, TX | 5.0 | 3.5 | 3358 | $17,582 | $5.24 | 22d | 1 | 1.34mi |
HOA detail
- Monthly dues
- $76 · $912/yr
Listing history 21 events
-
2026-06-18days on market $297,000 Active 63 DOM
-
2026-06-17days on market $297,000 Active 62 DOM
-
2026-06-16days on market $297,000 Active 61 DOM
-
2026-06-15days on market $297,000 Active 60 DOM
-
2026-06-13days on market $297,000 Active 58 DOM
-
2026-06-13pricedays on market $297,000 Active 57 DOM
-
2026-06-09days on market $302,000 Active 54 DOM
-
2026-06-08days on market $302,000 Active 53 DOM
-
2026-06-07days on market $302,000 Active 52 DOM
-
2026-06-04days on market $302,000 Active 49 DOM
-
2026-06-03days on market $302,000 Active 48 DOM
-
2026-06-02days on market $302,000 Active 47 DOM
-
2026-06-01days on market $302,000 Active 46 DOM
-
2026-05-31days on market $302,000 Active 45 DOM
-
2026-05-07price $307,000 482-char remark
Show marketing remark (482 chars)
Meet 4022 Lake Cypress Cir, recently updated with fresh interior paint, partial flooring replacement, and new flooring throughout. The kitchen includes an accent backsplash and island. The primary bedroom contains a walk in closet. its bathroom features double sinks and a separate tub and shower. Outside, a covered patio and fenced in backyard are present. Thoughtful updates and functional features make this home a must-see. Included 100-Day Home Warranty with buyer activation.
-
2026-04-16$317,000 Active 482-char remark
Show marketing remark (482 chars)
Meet 4022 Lake Cypress Cir, recently updated with fresh interior paint, partial flooring replacement, and new flooring throughout. The kitchen includes an accent backsplash and island. The primary bedroom contains a walk in closet. its bathroom features double sinks and a separate tub and shower. Outside, a covered patio and fenced in backyard are present. Thoughtful updates and functional features make this home a must-see. Included 100-Day Home Warranty with buyer activation.
-
2026-03-31soldstatus
-
2017-07-28soldstatus Sold 469-char remark
Show marketing remark (469 chars)
Look no further for the stylish living of Houston luxury find it here in Cypress Creek Crossing. This is the lifestyle that defines family-friendly living shopping and entertainment, recreation park, and nearby schools. Enjoy your weekends and weekdays away on the nature trail or spend quality family time from the comfort of your open floor plan including a granite-topped gourmet kitchen and great room. This new, gorgeous home is drenched with charm and comfort.
-
2017-06-12status Pending 469-char remark
Show marketing remark (469 chars)
Look no further for the stylish living of Houston luxury find it here in Cypress Creek Crossing. This is the lifestyle that defines family-friendly living shopping and entertainment, recreation park, and nearby schools. Enjoy your weekends and weekdays away on the nature trail or spend quality family time from the comfort of your open floor plan including a granite-topped gourmet kitchen and great room. This new, gorgeous home is drenched with charm and comfort.
-
2017-06-05price $214,995 469-char remark
Show marketing remark (469 chars)
Look no further for the stylish living of Houston luxury find it here in Cypress Creek Crossing. This is the lifestyle that defines family-friendly living shopping and entertainment, recreation park, and nearby schools. Enjoy your weekends and weekdays away on the nature trail or spend quality family time from the comfort of your open floor plan including a granite-topped gourmet kitchen and great room. This new, gorgeous home is drenched with charm and comfort.
-
2017-02-24$219,156 Active 469-char remark
Show marketing remark (469 chars)
Look no further for the stylish living of Houston luxury find it here in Cypress Creek Crossing. This is the lifestyle that defines family-friendly living shopping and entertainment, recreation park, and nearby schools. Enjoy your weekends and weekdays away on the nature trail or spend quality family time from the comfort of your open floor plan including a granite-topped gourmet kitchen and great room. This new, gorgeous home is drenched with charm and comfort.
ⓘ Source: listings_history table (triggers on properties + properties_extension) + one-shot
backfill from property_details.listing_events for pre-trigger history.
Tax reassessment forecast TX · Resets to sale price
- Current annual tax
- $7,975 · $665/mo
- Projected year-2 tax
- $7,975 · $665/mo
- Expected delta
- $0/yr ($0/mo · 0.0%)
ⓘ Screening estimate from a state-policy table — verify with the county assessor before closing.
Climate risk First Street
- Flood 3/10 Moderate FEMA zone X (unshaded) · 10% chance over 30 yrs
- Wildfire 3/10 Moderate
- Heat 9/10 Extreme 7 d/yr ≥111°F today · 24 d/yr by 30 yrs out
- Wind 8/10 Severe 99% chance of damaging wind over 30 yrs
- Air quality 3/10 Moderate 3 unhealthy d/yr today · 3 by 30 yrs out
Nearby sold comps map
Loading sold comps map…
Walkable amenities ~0.75 mi
Loading nearby amenities…
Taxation est. · year 1
- Rental income
- $91,988
- − Mortgage interest
- −$16,637
- − Property taxes
- −$7,975
- − Insurance
- −$1,485
- − Repairs & maintenance
- −$7,359
- − Management
- −$7,359
- − HOA
- −$912
- − Depreciation
- −$8,640
- Taxable income
- $41,621
- Est. tax owed @ 24.0%
- −$9,989
- After-tax cash flow
- $33,619/yr
For passive investors: Depreciation is non-cash, so a rental often shows a tax loss while cash-flowing — sheltering income. Rental losses are passive: they offset passive income freely, and up to $25,000/yr can offset ordinary (W-2) income if you actively participate and your MAGI is under $100k (phasing out to $0 by $150k); unused losses carry forward. On sale, claimed depreciation is recaptured at up to 25%, and gains may owe capital-gains tax (a 1031 exchange can defer both). Figures are a year-1 estimate at your 24.0% rate — not tax advice; consult a CPA.
Schools (NCES district)
- District
- Spring ISD
- NCES district ID
- 4841220
- Math proficiency
- 19% ▼ -13.00%
- Reading proficiency
- 26% ▼ -6.00%
- Median HH income
- $51,584
- Composite
- 20.12/100
- National rank
- #8643
- State rank
- #730 of 826 in TX
Livability — Houston
- Score
- 74/100
- State rank
- #184
- US rank
- #4771
Category grades
Schools grade is shown separately in the Schools card above.
Census & demographics
- City population
- 3,226,434
- Population (ZIP)
- 12,289
Population outlook (Harris County) Hauer SSP2
- Today (2025)
- 5,571,493 people
- By 2030
- 6,089,821 · +9.3%
- By 2040
- 7,142,806 · +28.2%
- By 2050
- 8,185,864 · +46.9%
- By 2075
- 10,574,329 · +89.8%
- By 2100
- 12,109,958 · +117.4%
Race, ethnicity, and origin ACS 2023
- Neighborhood character
- Highly diverse neighborhood (Simpson 0.72)
- Race & ethnicity
- Hispanic / Latino 35% Black 31% White 23% Two or more races 11% Asian 6% Native American 1%
- Hispanic origin (detail)
- Mexican 27%
- Common ancestry
- Scandinavian 2% Romanian 1% Serbian 1%
- Foreign-born
- 21% · Canada, Vietnam, China
- Languages at home
- 65% English-only · Spanish 28% Vietnamese 4% Chinese 1%
Political lean MEDSL · Harris
- 2024 margin
- Lean D (+5.5) · D 52.0% · R 46.4% · Other 1.6%
- 2008→2024 swing
- +3.9pp toward D · 2008: 1.6pp · 2024: 5.5pp
- All cycles
- 2024: D+5.5 2020: D+13.3 2016: D+12.4 2012: D+0.1 2008: D+1.6
Not yet ingested
- Civics
- —
Market trends
- HPI YoY
- ▼ -2.14%
- Current HPI
- 206.5475
- Rent YoY
- —
- Metro
- —
- State GDP YoY
- ▲ 3.95%
- F500 in state
- 110
Industry mix (Fortune 500 HQ in TX)
| Industry | F500 HQs | Revenue |
|---|---|---|
| Energy | 16 | $1,198B |
|
||
| Technology | 5 | $198B |
|
||
| Engineering / Construction | 4 | $72B |
|
||
| Energy Services | 3 | $60B |
|
||
| Utilities | 3 | $41B |
|
||
| Healthcare | 2 | $330B |
|
||
Price history
+40.1% since first listed7 events — show timeline
- 2026-05-07 Price Changed $307,000 HARMLS
- 2026-04-16 Listed $317,000 HARMLS
- 2026-03-31 Sold (Public Records) — Public Records
- 2017-07-28 Sold (MLS) — HARMLS
- 2017-06-12 Pending — HARMLS
- 2017-06-05 Price Changed $214,995 HARMLS
- 2017-02-24 Listed $219,156 HARMLS
Property tax history
+27.0%/yrLatest (2025): $7,975 · +4.4% YoY. Source: county tax records.
Cash-flow waterfall
monthlySold comps — $/sqft
last 12 mo · ≤1 miLoading sold comps…