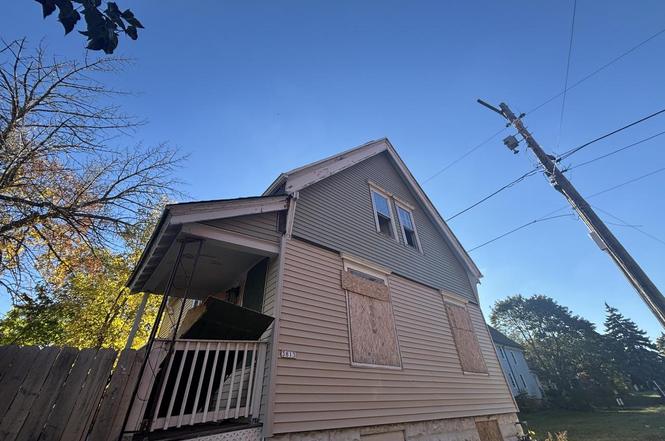
3813 W Wright St · Milwaukee, WI
Flood risk 6/10 · Moderate
- FEMA flood zone
- X (unshaded)
- Chance of flooding over 30 yrs
- 0.74%
- Est. flood insurance / yr
- $473 – $860
Fire risk 1/10 · Minimal
- Est. fire insurance / yr
- $636 – $1,182
Heat risk 2/10 · Minimal
- Hot days now (above 98°F)
- 7 days/yr
- Hot days in 30 yrs
- 13 days/yr
Wind risk 2/10 · Minimal
- Chance of severe wind over 30 yrs
- —
Air-quality risk 2/10 · Minimal
- Unhealthy air days now
- 2 days/yr
- Unhealthy air days in 30 yrs
- 2 days/yr
Risk factors via First Street. Map © Google.
Why this score? — see what drove the B- grade
The composite is a weighted blend of 9 inputs, each scored 0–100. Each bar is that input's sub-score; the figure is the points it added to the 100-point composite (weight × sub-score).
- Cash flow +30.0/30.0
- 1% rule +10.0/10.0
- DSCR +10.0/10.0
- ARV discount +7.5/15.0
- Livability +4.0/5.0
- Rent growth +3.5/5.0
- Condition / age +2.5/5.0
- Schools +1.2/10.0
- Appreciation +0.0/10.0
$45,000
🖨 Deal sheet 📄 Offer letter ✓ Due diligence
Listing remarks MLS
Attn Investors and or 1st time home buyers. Cheaper than rent, or add a nice property to your portfolio. Great cash flow
Key facts
- 1,306 sq ft lot
- Built 1910
- Listed 6 days
Neighborhood map
What this means for you Summary
Snapshot
- This is a 4-bed/1.0-bath single-family listed at $45k.
Deal economics
- At list price, monthly cash flow is $710 ($9k/yr) — positive.
- The deal already cash-flows at list — no discount required.
- Meets the 1% rule at list price ($1k rent vs $45k).
- Cap rate 25.2% vs local median 5.1% in Milwaukee — top-decile yield for the area; either an underpriced asset or a hidden risk that comps aren't pricing in. Stress-test before assuming the spread holds.
Location & tenants
- Location reads 81/100 on livability (#55 in WI, #1,534 nationally) — a professional / high-income tenant draw. Strengths: amenities A+, commute A+, cost of living A+; Watch: employment D+, schools F, crime F.
- Milwaukee School District (urban): math 10% / reading 18% proficiency, ranked #337 of 342 in WI (top 98%) — low school quality limits family demand, transient renter base, plan for 1-2y turnover; 77% free/reduced lunch — lower-income household profile, screen leases tightly.
- Market conditions: Rents rising (+3.8%/yr); 142 active listings in the ZIP; 36 comparable units currently listed for rent nearby; rentals at typical pace (median 17d on market — plan ~3-4 weeks tenant-placement turnaround); 1,017 units permitted in Milwaukee County in 2024 (803 in 5+ unit buildings).
- This rent runs 33% of the median local income ($48k/yr) — at the standard rent-burdened threshold; future hikes will face affordability resistance.
Forward outlook
- Local home prices are declining (-3.0%/yr); year-one equity from $311 of loan paydown is wiped out by about $1k of value loss. Plan a longer hold.
- Milwaukee County population projected at +4% by 2050 — modest demand growth; plan on rents tracking national, not racing it.
- At projected returns (-3.0% appreciation + 3.8% rent growth), your $13k cash investment doubles in ~2 years — after that, you're playing with house money.
Negotiation context
- Only 6 days on market — expect competitive offers; lowballing is unlikely to land.
- 3 sale attempts since 7y ago with the ask held roughly flat each time — persistent listings suggest the price (not the market) is what's stuck; bring a comps-based counter.
Risks & watch-outs
- Watch-outs: built in 1910 — expect roof / HVAC / electrical / plumbing capex.
- Climate carrying-cost: major flood risk — expect insurance premiums to compound above CPI over the hold.
Questions for the listing agent
- Built in 1910 — when were the roof, HVAC, electrical panel, plumbing, and water heater last replaced?
- Is there a deadline driving the sale (1031 exchange, divorce, estate, relocation)? That informs how much negotiation room exists.
- Schools are F-rated, which usually means shorter tenancies and higher turnover. Who's the typical renter profile here, and what's been the actual vacancy rate?
- Crime grade is F in this area — have there been break-ins, vandalism, or insurance claims at this property in the last 3 years? What carrier currently insures it and at what premium?
- What's the average days-on-market for RENTAL listings here right now (not sales)? A rising rental-DOM trend means longer vacancies and softer asking-rent achievability than the comps imply.
- What's the recent tenant-quality profile in this submarket — average credit score on applications, eviction rate, late-payment / NSF rate, and stable-employment percentage? A property-management company in the area should have these aggregated.
- How much new for-sale + rental construction is in the pipeline within 1–3 miles? Heavy new supply typically softens prices + rents 12–24 months out; constrained supply supports both.
Investment metrics
- 1% rule
- 2.94% ✓
- Cap rate
- 25.21%
- Cash-on-cash
- 67.57%
- DSCR
- 4.01
- GRM
- 2.8
CMA / ARV
- ARV (on-the-fly)
- $121,636
- Comps found
- 12
Show comp detail 12 sales within ~0.75 mi
| Address | Dist | Beds/Ba | Sqft | Sold | Price | $/sf | Match |
|---|---|---|---|---|---|---|---|
| 2807 N 36th St | 0.43mi | 3/1.0 (-1) | 1,297 (+0%) | 8mo | $70,000 | $54 | 68 |
| 2464 N 34th St | 0.28mi | 3/2.0 (-1) | 1,280 (-1%) | 10mo | $195,000 | $152 | 68 |
| 2444 N 38th St | 0.06mi | 3/1.0 (-1) | 1,118 (-14%) | 4mo | $105,000 | $94 | 66 |
| 2865 N 36th St | 0.50mi | 3/2.0 (-1) | 1,292 (-0%) | 2mo | $132,000 | $102 | 66 |
| 2114 N 34th St | 0.49mi | 4/1.0 | 1,278 (-1%) | 12mo | $85,000 | $67 | 65 |
| 2401 N 37th St | 0.13mi | 4/1.5 | 1,457 (+13%) | 8mo | $133,000 | $91 | 64 |
| 3615 W Center St | 0.28mi | 4/2.0 | 1,450 (+12%) | 3mo | $81,000 | $56 | 61 |
| 2408 N 47th St | 0.55mi | 4/1.5 | 1,258 (-3%) | 9mo | $112,000 | $89 | 60 |
| 3052 N 40th St | 0.72mi | 3/1.0 (-1) | 1,240 (-4%) | 4mo | $75,000 | $60 | 51 |
| 2745 N 33rd St | 0.45mi | 3/2.0 (-1) | 1,200 (-7%) | 9mo | $120,000 | $100 | 50 |
| 3801 W Sarnow St | 0.67mi | 3/1.0 (-1) | 1,116 (-14%) | 1mo | $105,000 | $94 | 40 |
| 2446 N 46th St | 0.48mi | 4/2.0 | 1,485 (+15%) | 12mo | $215,000 | $145 | 39 |
Match score weights: distance 35% · size 25% · config 20% · recency 20%. Top-matched comps best support the ARV.
Projected returns pro-forma
-3.0% appreciation · 3.82% rent growth · sell at horizon
- IRR
- 67.9%
- Equity multiple
- 4.10×
- Total profit
- $39,035
- Equity at exit
- $6,710
- IRR
- 72.3%
- Equity multiple
- 8.69×
- Total profit
- $96,918
- Equity at exit
- $3,891
Cash invested: $12,600 (down + closing). Projections, not guarantees.
Landlord ↔ Tenant lean methodology
- Overall (STATE)
- 73 Landlord-Friendly
- State Wisconsin
- 73 Landlord-Friendly · R+2
- County
- — inherits STATE
- City
- — inherits STATE
ZIP-level market 53210
- Home prices YoY
- -21.5%
- Rents YoY
- 3.8%
- Active inventory
- 142
- Price-to-rent
- 2.8×
Monthly cashflow live
- Estimated rent
- $1,324 high interval (Pro) →
- Mortgage (P&I)
- −$236
- Tax from tax record
- −$81 /mo · $976/yr
- Insurance
- −$19
- HOA
- −$0
- Vacancy / Maint / Mgmt
- −$278
- Net cashflow
- $710
Break-even live
UW: 25.0% down · 7.5% · 30yr · 1.5% tax · 5.0% vac · 8.0% maint · 8.0% mgmt
Financing live
Cash to close
- Down payment
- $11,250
- Closing costs
- $1,350
- Reserves months
- —
- Total cash needed
- —
Loan-product check · same deal, 3 products live
Conventional
25% down · 7.5% · 30yr
- Down + closing
- —
- Monthly P&I
- —
- Monthly cashflow
- —
- DSCR
- —
- Eligible?
- —
Personal DTI + credit; lowest rate.
DSCR
20% down · 8.5% · 30yr
- Down + closing
- —
- Monthly P&I
- —
- Monthly cashflow
- —
- DSCR
- —
- Eligible?
- —
No personal income docs; deal must DSCR.
Hard money
10% down · 12.0% · 12mo
- Down + closing
- —
- Monthly P&I
- —
- Monthly cashflow
- —
- DSCR
- —
- Eligible?
- —
Short-term bridge; refi at stabilization.
Rent comps 36 comps
| Address | Beds | Baths | Sqft | Rent | $/sqft | DOM | Units | Dist |
|---|---|---|---|---|---|---|---|---|
| 2403-2405 N 39th St Unit 2403 Lower Milwaukee, WI | 3.0 | 1.0 | 1200 | $995 | $0.83 | 10d | 1 | 0.10mi |
| 2403-2405 N 39th St Unit 2405 Upper Milwaukee, WI | 3.0 | 1.0 | 1141 | $995 | $0.87 | 10d | 1 | 0.10mi |
| 2251 N 41st St Unit Lower Milwaukee, WI | 3.0 | 1.0 | 1187 | $1,198 | $1.01 | 14d | 1 | 0.29mi |
| 2232 N 44th St Unit 2234 Upper Milwaukee, WI | 3.0 | 1.0 | 1000 | $1,195 | $1.20 | 44d | 1 | 0.43mi |
| 2713 N 44th St Milwaukee, WI | 3.0 | 1.0 | 1450 | $1,350 | $0.93 | 44d | 1 | 0.47mi |
| 2201 N 32nd St Unit 2201 Milwaukee, WI | 3.0 | 1.0 | 1100 | $1,195 | $1.09 | 16d | 1 | 0.51mi |
| 2001 N 38th St #2003 Milwaukee, WI | 3.0 | 1.0 | 1326 | $950 | $0.72 | 2d | 1 | 0.51mi |
| 3100 W Center St Milwaukee, WI | 3.0 | 2.0 | 1174 | $1,531 | $1.30 | 1d | 1 | 0.52mi |
| 2809 W Clarke St Unit 12811 Milwaukee, WI | 3.0 | 1.0 | 1400 | $1,200 | $0.86 | 17d | 1 | 0.67mi |
| 2409 N 49th St Milwaukee, WI | 3.0 | 1.0 | 1335 | $1,248 | $0.93 | 44d | 1 | 0.68mi |
| 2137 N 47th St Milwaukee, WI | 5.0 | 2.0 | 1723 | $1,850 | $1.07 | 14d | 1 | 0.68mi |
| 2629 N 49th St Milwaukee, WI | 3.0 | 1.0 | 1200 | $1,350 | $1.12 | 44d | 1 | 0.70mi |
| 2629 N 50th St Unit Upper Milwaukee, WI | 3.0 | 1.0 | 1258 | $1,375 | $1.09 | 3d | 1 | 0.76mi |
| 2438 N 51st St Unit 2 Milwaukee, WI | 3.0 | 1.0 | 1300 | $1,650 | $1.27 | 23d | 1 | 0.77mi |
| 2870 N 29th St #2872 Milwaukee, WI | 3.0 | 1.0 | 1300 | $1,250 | $0.96 | 44d | 1 | 0.81mi |
| 3122 N 42nd St Milwaukee, WI | 3.0 | 1.0 | 1323 | $1,495 | $1.13 | 4d | 1 | 0.83mi |
| 3123 N 42nd St Milwaukee, WI | 4.0 | 1.0 | 1500 | $1,700 | $1.13 | 23d | 1 | 0.83mi |
| 1639 N 33rd St Milwaukee, WI | 3.0 | 1.0 | 1424 | $950 | $0.67 | 23d | 1 | 0.87mi |
| 2765 N 26th St Unit 1 Milwaukee, WI | 3.0 | 1.0 | 1125 | $1,200 | $1.07 | 4d | 1 | 0.87mi |
| 2976 N 49th St Milwaukee, WI | 3.0 | 1.0 | 1700 | $1,300 | $0.76 | 17d | 1 | 0.90mi |
| 1515 N 32nd St Unit 1515 Milwaukee, WI | 3.0 | 1.0 | 1200 | $1,245 | $1.04 | 4d | 1 | 1.01mi |
| 2308 W Clarke St Milwaukee, WI | 4.0 | 2.0 | 1545 | $1,750 | $1.13 | 23d | 1 | 1.04mi |
| 2741 N 23rd St Unit 2 Milwaukee, WI | 3.0 | 1.0 | 1000 | $1,100 | $1.10 | 17d | 1 | 1.09mi |
| 2741 N 23rd St Milwaukee, WI | 3.0 | 1.0 | 900 | $1,050 | $1.17 | 14d | 1 | 1.09mi |
| 2945 N 23rd St Milwaukee, WI | 3.0 | 1.0 | 1014 | $1,195 | $1.18 | 44d | 1 | 1.20mi |
| 3155 N 52nd St Milwaukee, WI | 3.0 | 2.0 | 1300 | $1,400 | $1.08 | 44d | 1 | 1.21mi |
| 2821 W Concordia Ave Milwaukee, WI | 3.0 | 1.5 | 1098 | $1,595 | $1.45 | 2d | 1 | 1.22mi |
| 2119 W Brown St Milwaukee, WI | 3.0 | 1.0 | 1754 | $995 | $0.57 | 3d | 1 | 1.26mi |
| 2704 W Concordia Ave Unit Na Milwaukee, WI | 5.0 | 2.0 | 1856 | $2,500 | $1.35 | 23d | 1 | 1.29mi |
| 3012 N 57th St Unit Lower Milwaukee, WI | 3.0 | 1.0 | 1130 | $1,398 | $1.24 | 4d | 1 | 1.30mi |
| 3388 N 27th St Unit 3388 Front House Milwaukee, WI | 4.0 | 1.0 | 1212 | $1,550 | $1.28 | 4d | 1 | 1.40mi |
| 1239 N 26th St Unit 1 Milwaukee, WI | 3.0 | 1.0 | 1300 | $1,400 | $1.08 | 44d | 1 | 1.42mi |
| 1239 N 26th St Unit 1 Milwaukee, WI | 3.0 | 1.0 | 1300 | $1,400 | $1.08 | 44d | 1 | 1.42mi |
| 1235 N 26th St Milwaukee, WI | 3.0 | 1.0 | 900 | $950 | $1.06 | 44d | 1 | 1.43mi |
| 2610 W Juneau Ave Unit 2610 Milwaukee, WI | 3.0 | 1.0 | 893 | $1,400 | $1.57 | 23d | 1 | 1.46mi |
| 2478-2480 W Juneau Ave Unit 2478 Milwaukee, WI | 4.0 | 1.0 | 1375 | $1,495 | $1.09 | 23d | 1 | 1.50mi |
Listing history 14 events
-
2025-11-06status Pending
-
2025-10-31$45,000 Active
-
2021-06-10soldstatus $41,000 Sold 120-char remark
Show marketing remark (120 chars)
Attn Investors and or 1st time home buyers. Cheaper than rent, or add a nice property to your portfolio. Great cash flow
-
2021-05-27historical Contingent 120-char remark
Show marketing remark (120 chars)
Attn Investors and or 1st time home buyers. Cheaper than rent, or add a nice property to your portfolio. Great cash flow
-
2021-05-01$41,000 Active 120-char remark
Show marketing remark (120 chars)
Attn Investors and or 1st time home buyers. Cheaper than rent, or add a nice property to your portfolio. Great cash flow
-
2019-07-25soldstatus $16,000 Sold 125-char remark
Show marketing remark (125 chars)
LONG TERM INVESTOR LIQUIDATING RENTAL OPPORTUNITY. PROPERTY BEING SOLD IN ''AS-IS'' CONDITION. THIS PROPERTY IS LAND-LOCKED.
-
2019-07-15status Pending 125-char remark
Show marketing remark (125 chars)
LONG TERM INVESTOR LIQUIDATING RENTAL OPPORTUNITY. PROPERTY BEING SOLD IN ''AS-IS'' CONDITION. THIS PROPERTY IS LAND-LOCKED.
-
2019-07-10price $16,900 125-char remark
Show marketing remark (125 chars)
LONG TERM INVESTOR LIQUIDATING RENTAL OPPORTUNITY. PROPERTY BEING SOLD IN ''AS-IS'' CONDITION. THIS PROPERTY IS LAND-LOCKED.
-
2019-05-21price $17,900 125-char remark
Show marketing remark (125 chars)
LONG TERM INVESTOR LIQUIDATING RENTAL OPPORTUNITY. PROPERTY BEING SOLD IN ''AS-IS'' CONDITION. THIS PROPERTY IS LAND-LOCKED.
-
2019-05-09price $19,500 125-char remark
Show marketing remark (125 chars)
LONG TERM INVESTOR LIQUIDATING RENTAL OPPORTUNITY. PROPERTY BEING SOLD IN ''AS-IS'' CONDITION. THIS PROPERTY IS LAND-LOCKED.
-
2019-04-06price $19,900 125-char remark
Show marketing remark (125 chars)
LONG TERM INVESTOR LIQUIDATING RENTAL OPPORTUNITY. PROPERTY BEING SOLD IN ''AS-IS'' CONDITION. THIS PROPERTY IS LAND-LOCKED.
-
2019-03-19price $22,900 125-char remark
Show marketing remark (125 chars)
LONG TERM INVESTOR LIQUIDATING RENTAL OPPORTUNITY. PROPERTY BEING SOLD IN ''AS-IS'' CONDITION. THIS PROPERTY IS LAND-LOCKED.
-
2019-03-11$29,900 Active 125-char remark
Show marketing remark (125 chars)
LONG TERM INVESTOR LIQUIDATING RENTAL OPPORTUNITY. PROPERTY BEING SOLD IN ''AS-IS'' CONDITION. THIS PROPERTY IS LAND-LOCKED.
-
1989-12-01soldstatus $22,200
ⓘ Source: listings_history table (triggers on properties + properties_extension) + one-shot
backfill from property_details.listing_events for pre-trigger history.
Tax reassessment forecast WI · Partial reset (capped growth)
- Current annual tax
- $976 · $81/mo
- Projected year-2 tax
- $976 · $81/mo
- Expected delta
- $0/yr ($0/mo · 0.0%)
ⓘ Screening estimate from a state-policy table — verify with the county assessor before closing.
Climate risk First Street
- Flood 6/10 Major FEMA zone X (unshaded) · 74% chance over 30 yrs
- Wildfire 1/10 Low
- Heat 2/10 Low 7 d/yr ≥98°F today · 13 d/yr by 30 yrs out
- Wind 2/10 Low
- Air quality 2/10 Low 2 unhealthy d/yr today · 2 by 30 yrs out
Nearby sold comps map
Loading sold comps map…
Walkable amenities ~0.75 mi
Loading nearby amenities…
Taxation est. · year 1
- Rental income
- $15,882
- − Mortgage interest
- −$2,521
- − Property taxes
- −$976
- − Insurance
- −$225
- − Repairs & maintenance
- −$1,271
- − Management
- −$1,271
- − Depreciation
- −$1,309
- Taxable income
- $8,311
- Est. tax owed @ 24.0%
- −$1,995
- After-tax cash flow
- $6,520/yr
For passive investors: Depreciation is non-cash, so a rental often shows a tax loss while cash-flowing — sheltering income. Rental losses are passive: they offset passive income freely, and up to $25,000/yr can offset ordinary (W-2) income if you actively participate and your MAGI is under $100k (phasing out to $0 by $150k); unused losses carry forward. On sale, claimed depreciation is recaptured at up to 25%, and gains may owe capital-gains tax (a 1031 exchange can defer both). Figures are a year-1 estimate at your 24.0% rate — not tax advice; consult a CPA.
Schools (NCES district)
- District
- Milwaukee School District
- NCES district ID
- 5509600
- Math proficiency
- 10% ▼ -5.00%
- Reading proficiency
- 18% ▬ 0.00%
- Median HH income
- $36,339
- Composite
- 11.61/100
- National rank
- #9696
- State rank
- #337 of 342 in WI
Livability — Milwaukee
- Score
- 81/100
- State rank
- #55
- US rank
- #1534
Category grades
Schools grade is shown separately in the Schools card above.
Census & demographics
- Census place
- Milwaukee, WI
- County
- Milwaukee County · 926,379 people
- City population
- 573,768
- Metro
- Milwaukee-Waukesha, WI
- Population (ZIP)
- 23,922
- Household income
- $48,217
- Rent vs Own
- Severe rent burden
- 1730.0
Population outlook (Milwaukee County) Hauer SSP2
- Today (2025)
- 995,758 people
- By 2030
- 1,009,124 · +1.3%
- By 2040
- 1,028,128 · +3.3%
- By 2050
- 1,040,066 · +4.4%
- By 2075
- 1,057,849 · +6.2%
- By 2100
- 1,039,774 · +4.4%
Race, ethnicity, and origin ACS 2023
- Neighborhood character
- Predominantly Black (71%)
- Race & ethnicity
- Black 71% White 17% Hispanic / Latino 6% Two or more races 6% Asian 2%
- Hispanic origin (detail)
- Mexican 3% Puerto Rican 1%
- Common ancestry
- Romanian 2% Portuguese 1% Italian 1%
- Foreign-born
- 3% · Canada, Philippines
- Languages at home
- 94% English-only · Spanish 3% Other Asian/Pacific 2%
Political lean MEDSL · Milwaukee
- 2024 margin
- Solid D (+38.5) · D 68.3% · R 29.8% · Other 1.8%
- 2008→2024 swing
- +2.7pp toward D · 2008: 35.9pp · 2024: 38.5pp
- All cycles
- 2024: D+38.5 2020: D+39.9 2016: D+37.5 2012: D+34.6 2008: D+35.9
Not yet ingested
- Civics
- —
Market trends
- HPI YoY
- ▼ -76.77%
- Current HPI
- 280.0133
- Rent YoY
- ▲ 3.82%
- Metro
- Milwaukee-Waukesha, WI
- State GDP YoY
- ▲ 2.10%
- F500 in state
- 20
Industry mix (Fortune 500 HQ in WI)
| Industry | F500 HQs | Revenue |
|---|---|---|
| Industrial Machinery | 4 | $23B |
|
||
| Industrial Technology | 2 | $36B |
|
||
| Insurance | 1 | $36B |
|
||
| Professional Services | 1 | $19B |
|
||
| Utilities | 1 | $9B |
|
||
| Consumer Goods | 1 | $3B |
|
||
Price history
+102.7% since first listed14 events — show timeline
- 2025-11-06 Pending — METROMLS
- 2025-10-31 Listed $45,000 METROMLS
- 2021-06-10 Sold (MLS) $41,000 METROMLS
- 2021-05-27 Contingent — METROMLS
- 2021-05-01 Listed $41,000 METROMLS
- 2019-07-25 Sold (MLS) $16,000 METROMLS
- 2019-07-15 Pending — METROMLS
- 2019-07-10 Price Changed $16,900 METROMLS
- 2019-05-21 Price Changed $17,900 METROMLS
- 2019-05-09 Price Changed $19,500 METROMLS
- 2019-04-06 Price Changed $19,900 METROMLS
- 2019-03-19 Price Changed $22,900 METROMLS
- 2019-03-11 Listed $29,900 METROMLS
- 1989-12-01 Sold (Public Records) $22,200 Public Records
Property tax history
+3.0%/yrLatest (2024): $976 · +11.3% YoY. Source: county tax records.
Cash-flow waterfall
monthlySold comps — $/sqft
last 12 mo · ≤1 miLoading sold comps…