10 Mayflower Dr · Old Orchard Beach, ME
Flood risk 1/10 · Minimal
- FEMA flood zone
- X
- Chance of flooding over 30 yrs
- 0.0%
- Est. flood insurance / yr
- $507 – $1,088
Fire risk 1/10 · Minimal
- Est. fire insurance / yr
- $669 – $1,243
Heat risk 4/10 · Minor
- Hot days now (above 89°F)
- 7 days/yr
- Hot days in 30 yrs
- 17 days/yr
Wind risk 6/10 · Moderate
- Chance of severe wind over 30 yrs
- 66.0%
Air-quality risk 2/10 · Minimal
- Unhealthy air days now
- 1 days/yr
- Unhealthy air days in 30 yrs
- 1 days/yr
Risk factors via First Street. Map © Google.
Why this score? — see what drove the D+ grade
The composite is a weighted blend of 9 inputs, each scored 0–100. Each bar is that input's sub-score; the figure is the points it added to the 100-point composite (weight × sub-score).
- Cash flow +11.1/30.0
- 1% rule +9.4/10.0
- ARV discount +7.5/15.0
- Schools +6.7/10.0
- Rent growth +3.7/5.0
- Livability +3.4/5.0
- DSCR +3.2/10.0
- Condition / age +2.5/5.0
- Appreciation +0.0/10.0
$145,000
🖨 Deal sheet (PDF) 📄 Offer letter ✓ Due diligence
Listing remarks
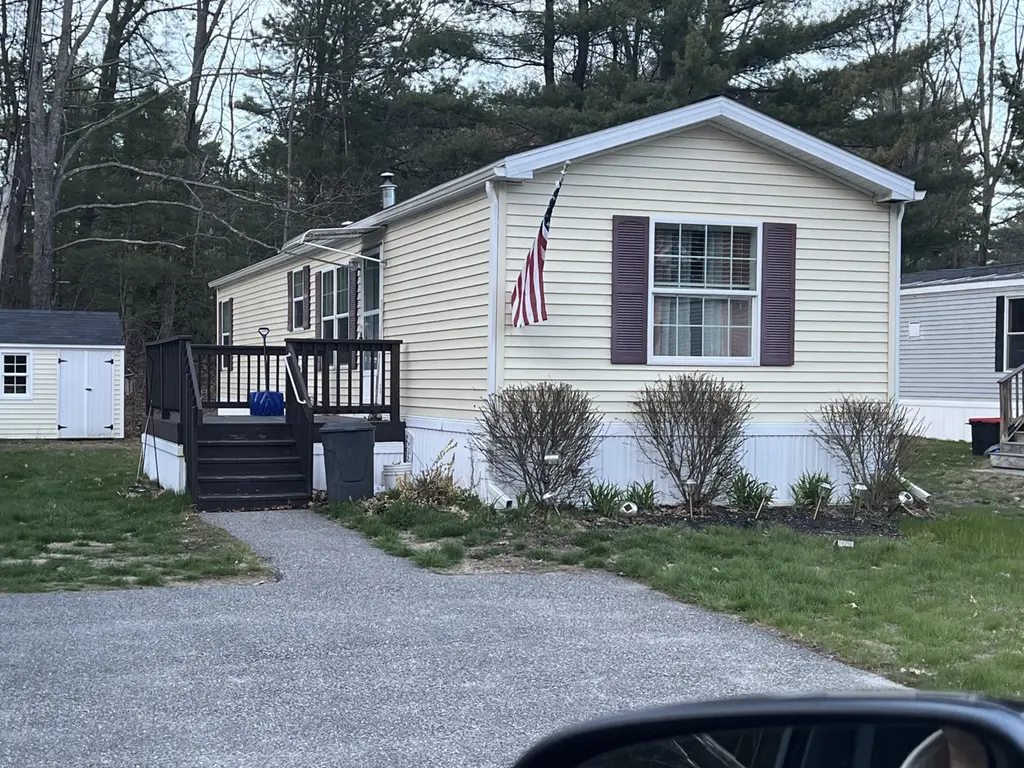
2 bedroom 1.5 bathroom affordable living with all that OOB has to offer. Beaches, Nightlife, dining, Amusement park.
Key facts
- Parking
- Built 2013
- Listed 37 days
Property features AI
Finance
- Financial info: Property has a land lease
- HOA & community: Association present; $776 monthly fee
Exterior
- Parking: Paved parking with 1–4 spaces
- Utilities: Public water; Public sewer; Electric service with circuit breakers; Electric water heater
- Home design: Mobile Home (Single Wide); Modular structure; Entry on first level; Shingle roof
- Construction: Vinyl siding; Built in 2013; Slab foundation
- Exterior features: Porch; Shed(s); Located in a mobile home park; Near golf course, public beach, and town; Neighborhood setting; Level lot; Paved road access
Interior
- Kitchen: Electric range; Microwave; Dishwasher; Refrigerator
- Bedrooms: Bedroom 1 on the first floor; Bedroom 2 on the first floor
- Flooring: Vinyl; Luxury vinyl
- Bathrooms: 1 full bathroom; 1 half bathroom
- Heating & cooling: Forced air heating
- Interior features: First-floor primary bedroom with bath; Total of 4 rooms
- Laundry & utility: Washer and dryer on the main level
Neighborhood map
What this means for you Summary
Snapshot
- This is a 2-bed/1.5-bath manufactured listed at $145k.
Deal economics
- At list price, monthly cash flow is $-59 ($-712/yr) — negative.
- To cash-flow at today's rent, offer at most $135k (7.2% below list).
- Meets the 1% rule at list price ($2k rent vs $145k).
- Recommended offer: $135k (7.2% below list) — sets the bar for cash-flow.
- Cap rate 5.8% vs local median 2.0% in Old Orchard Beach — top-decile yield for the area; either an underpriced asset or a hidden risk that comps aren't pricing in. Stress-test before assuming the spread holds.
Location & tenants
- Location reads 68/100 on livability (#88 in ME) — a middle-class / working-renter tenant base. Strengths: crime A+, housing A+, cost of living B+; Watch: amenities F, commute F, health & safety F.
- RSU 23 (suburban): math 78% / reading 80% proficiency, ranked #87 of 112 in ME (top 78%) — strong family-tenant draw, lease renewals of 3-5y typical.
- Zoned schools: Jameson Elementary School (184 students, 41% FRL); Loranger Memorial School (math 77% / reading 78%, grade A+, #73 of 85 statewide, top 87%, 279 students, 42% FRL); Old Orchard Beach High School (math 95% / reading 95%, grade A+, #12 of 108 statewide, top 15%, 203 students, 35% FRL) — zoned schools at 39% FRL track the district average.
- Market conditions: Rents rising fast (+4.9%/yr); 175 active listings in the ZIP; 3 comparable units currently listed for rent nearby; rentals lingering (median 46d on market — plan ~5-8 weeks vacancy on turnover, expect pricing pressure); 67% of comp listings sitting > 30 days — soft ceiling on asking rent; 1,386 units permitted in York County in 2024 (338 in 5+ unit buildings).
- This rent runs 42% of the median local income ($60k/yr) — at the standard rent-burdened threshold; future hikes will face affordability resistance.
Forward outlook
- Local home prices are declining (-3.0%/yr); year-one equity from $1k of loan paydown is wiped out by about $4k of value loss. Plan a longer hold.
Negotiation context
- It's been on market 38 days — a 3% lower offer ($141k) is reasonable based on typical stale-listing flexibility.
Risks & watch-outs
- Watch-outs: HOA is 37% of rent.
- Climate carrying-cost: major wind risk, 66% chance of damaging wind over 30y — expect insurance premiums to compound above CPI over the hold.
Questions for the listing agent
- What do current leases actually rent for vs. the listed asking? Can we see a recent rent roll and the last 12 months of T-12 income?
- It's been on market 38 days. Have you received any prior offers? Is the seller open to a 7% concession, seller financing, or rate buy-down credit?
- What does the HOA fee cover, when was the last increase, and are there any pending special assessments or reserve-fund shortfalls?
- Is there a deadline driving the sale (1031 exchange, divorce, estate, relocation)? That informs how much negotiation room exists.
- Schools are D-rated, which usually means shorter tenancies and higher turnover. Who's the typical renter profile here, and what's been the actual vacancy rate?
- The area grade is low — what's the realistic commute time and amenity access for the typical tenant pool here? Any planned neighborhood developments (good or bad) we should know about?
- What's the average days-on-market for RENTAL listings here right now (not sales)? A rising rental-DOM trend means longer vacancies and softer asking-rent achievability than the comps imply.
- What's the recent tenant-quality profile in this submarket — average credit score on applications, eviction rate, late-payment / NSF rate, and stable-employment percentage? A property-management company in the area should have these aggregated.
- How much new for-sale + rental construction is in the pipeline within 1–3 miles? Heavy new supply typically softens prices + rents 12–24 months out; constrained supply supports both.
Investment metrics
- 1% rule
- 1.44% ✓
- Cap rate
- 5.80%
- Cash-on-cash
- -1.75%
- DSCR
- 0.92
- GRM
- 5.8
CMA / ARV
- ARV (median comp)
- $91,374
- List price
- $145,000
- Delta
- 58.69%
- Verdict
- OVERPRICED
- Comps
- 10 within 1.0 mi
Show comp detail 10 sales within ~0.75 mi
| Address | Dist | Beds/Ba | Sqft | Sold | Price | $/sf | Match |
|---|---|---|---|---|---|---|---|
| 3 Stagecoach Dr | 0.01mi | 2/2.0 | 784 (0%) | 7mo | $127,000 | $162 | 92 |
| 12 Goosefare Dr | 0.09mi | 2/1.0 | 784 (0%) | 11mo | $118,000 | $151 | 85 |
| 6 Goosefare Dr | 0.11mi | 2/1.5 | 784 (0%) | 21mo | $138,000 | $176 | 77 |
| 7 Pinecone Dr | 0.16mi | 2/1.0 | 798 (+2%) | 15mo | $88,000 | $110 | 75 |
| 43 Goosefare Dr #43 | 0.10mi | 2/1.0 | 789 (+1%) | 23mo | $60,000 | $76 | 73 |
| 27 Ocean Park Rd #275 | 0.23mi | 1/1.0 (-1) | 800 (+2%) | 16mo | $54,000 | $68 | 65 |
| 27 Ocean Park Rd #266 | 0.23mi | 1/1.0 (-1) | 740 (-6%) | 12mo | $62,000 | $84 | 63 |
| 27 Ocean Park Rd #104 | 0.23mi | 2/1.0 | 710 (-9%) | 12mo | $31,000 | $44 | 62 |
| 27 Ocean Park Rd #210 | 0.28mi | 1/1.0 (-1) | 676 (-14%) | 11mo | $53,000 | $78 | 48 |
| 3 Old Orchard Rd Unit Site J25 | 0.43mi | 2/1.0 | 700 (-11%) | 23mo | $77,500 | $111 | 40 |
Match score weights: distance 35% · size 25% · config 20% · recency 20%. Top-matched comps best support the ARV.
Projected returns pro-forma
-3.0% appreciation · 4.93% rent growth · sell at horizon
- IRR
- -15.2%
- Equity multiple
- 0.44×
- Total profit
- $-22,691
- Equity at exit
- $21,620
- IRR
- -1.6%
- Equity multiple
- 0.87×
- Total profit
- $-5,147
- Equity at exit
- $12,537
Cash invested: $40,600 (down + closing). Projections, not guarantees.
Landlord ↔ Tenant lean methodology
- Overall (STATE)
- 41 Moderately Tenant-Leaning
- State Maine
- 41 Moderately Tenant-Leaning · D+2
- County
- — inherits STATE
- City
- — inherits STATE
ZIP-level market 04064
- Home prices YoY
- -11.6%
- Rents YoY
- 4.9%
- Active inventory
- 175
- Price-to-rent
- 5.8×
Monthly cashflow live
- Estimated rent
- $2,083 medium interval (Pro) →
- Mortgage (P&I)
- −$760
- Tax from tax record
- −$108 /mo · $1,296/yr
- Insurance
- −$60
- HOA
- −$776
- Vacancy / Maint / Mgmt
- −$437
- Net cashflow
- $-59
Break-even live
Sensitivity live
| Price | -10% $23 | -5% $-18 | +0% $-59 | +5% $-100 | +10% $-141 |
|---|---|---|---|---|---|
| Rent | -10% $-224 | -5% $-142 | +0% $-59 | +5% $23 | +10% $105 |
| Rate | -1.0pp $14 | -0.5pp $-22 | base $-59 | +0.5pp $-97 | +1.0pp $-135 |
UW: 25.0% down · 7.5% · 30yr · 1.5% tax · 5.0% vac · 8.0% maint · 8.0% mgmt
Financing live
Cash to close
- Down payment
- $36,250
- Closing costs
- $4,350
- Reserves months
- —
- Total cash needed
- —
Loan-product check · same deal, 3 products live
Conventional
25% down · 7.5% · 30yr
- Down + closing
- —
- Monthly P&I
- —
- Monthly cashflow
- —
- DSCR
- —
- Eligible?
- —
Personal DTI + credit; lowest rate.
DSCR
20% down · 8.5% · 30yr
- Down + closing
- —
- Monthly P&I
- —
- Monthly cashflow
- —
- DSCR
- —
- Eligible?
- —
No personal income docs; deal must DSCR.
Hard money
10% down · 12.0% · 12mo
- Down + closing
- —
- Monthly P&I
- —
- Monthly cashflow
- —
- DSCR
- —
- Eligible?
- —
Short-term bridge; refi at stabilization.
Rent comps 3 comps
| Address | Beds | Baths | Sqft | Rent | $/sqft | DOM | Units | Dist |
|---|---|---|---|---|---|---|---|---|
| 18 Smithwheel Rd #61 Old Orchard Beach, ME | 2.0 | 1.0 | 800 | $2,100 | $2.62 | 46d | 1 | 0.17mi |
| 210 Beach St Unit 5 Saco, ME | 2.0 | 1.0 | 927 | $2,100 | $2.27 | 45d | 1 | 1.14mi |
| 78 Union St Unit 3 Saco, ME | 2.0 | 1.0 | 1000 | $1,900 | $1.90 | 15d | 1 | 1.43mi |
HOA detail
- Monthly dues
- $776 · $9,312/yr
Listing history 10 events
-
2026-06-10days on market $145,000 Active 38 DOM
-
2026-06-09days on market $145,000 Active 37 DOM
-
2026-06-08days on market $145,000 Active 36 DOM
-
2026-06-07days on market $145,000 Active 35 DOM
-
2026-06-03days on market $145,000 Active 31 DOM
-
2026-06-02days on market $145,000 Active 30 DOM
-
2026-06-01days on market $145,000 Active 29 DOM
-
2026-05-31days on market $145,000 Active 28 DOM
-
2026-05-30pricedays on market $145,000 Active 27 DOM
-
2026-05-03$155,000 Active 116-char remark
ⓘ Source: listings_history table (triggers on properties + properties_extension) + one-shot
backfill from property_details.listing_events for pre-trigger history.
Tax reassessment forecast ME · Partial reset (capped growth)
- Current annual tax
- $1,296 · $108/mo
- Projected year-2 tax
- $1,634 · $136/mo
- Expected delta
- +$338/yr (+$28/mo · 26.1%)
ⓘ Screening estimate from a state-policy table — verify with the county assessor before closing.
Climate risk First Street
- Flood 1/10 Low FEMA zone X · 0% chance over 30 yrs
- Wildfire 1/10 Low
- Heat 4/10 Moderate 7 d/yr ≥89°F today · 17 d/yr by 30 yrs out
- Wind 6/10 Major 66% chance of damaging wind over 30 yrs
- Air quality 2/10 Low 1 unhealthy d/yr today · 1 by 30 yrs out
Nearby sold comps map
Loading sold comps map…
Walkable amenities ~0.75 mi
Loading nearby amenities…
Taxation est. · year 1
- Rental income
- $24,994
- − Mortgage interest
- −$8,122
- − Property taxes
- −$1,296
- − Insurance
- −$725
- − Repairs & maintenance
- −$2,000
- − Management
- −$2,000
- − HOA
- −$9,312
- − Depreciation
- −$4,218
- Taxable loss
- −$2,678
- Est. tax savings @ 24.0%
- +$643
- After-tax cash flow
- $-69/yr
For passive investors: Depreciation is non-cash, so a rental often shows a tax loss while cash-flowing — sheltering income. Rental losses are passive: they offset passive income freely, and up to $25,000/yr can offset ordinary (W-2) income if you actively participate and your MAGI is under $100k (phasing out to $0 by $150k); unused losses carry forward. On sale, claimed depreciation is recaptured at up to 25%, and gains may owe capital-gains tax (a 1031 exchange can defer both). Figures are a year-1 estimate at your 24.0% rate — not tax advice; consult a CPA.
Schools (NCES district)
- District
- RSU 23
- NCES district ID
- 2314784
- Math proficiency
- 78% ▲ 51.00%
- Reading proficiency
- 80% ▲ 27.00%
- Median HH income
- $49,630
- Composite
- 66.79/100
- National rank
- #406
- State rank
- #87 of 112 in ME
Livability — Old Orchard Beach
- Score
- 68/100
- State rank
- #88
- US rank
- #9943
Category grades
Schools grade is shown separately in the Schools card above.
Census & demographics
- Census place
- Old Orchard Beach, ME
- County
- York County · 80,026 people
- City population
- 8,632
- Metro
- Portland-South Portland, ME
- Population (ZIP)
- 8,632
- Household income
- $59,887
- Rent vs Own
- Severe rent burden
- 441.0
Population outlook (York County) Hauer SSP2
- Today (2025)
- 209,961 people
- By 2030
- 212,816 · +1.4%
- By 2040
- 214,360 · +2.1%
- By 2050
- 210,350 · +0.2%
- By 2075
- 201,686 · -3.9%
- By 2100
- 183,392 · -12.7%
Race, ethnicity, and origin ACS 2023
- Neighborhood character
- Predominantly White (90%)
- Race & ethnicity
- White 90% Two or more races 6% Hispanic / Latino 3% Black 1% Native American 1%
- Common ancestry
- Lithuanian 9% Slovak 7% Romanian 3%
- Foreign-born
- 6% · Canada
- Languages at home
- 91% English-only · French/Haitian/Cajun 6% Russian/Polish/Slavic 1% Other Indo-European 1%
Political lean MEDSL · York
- 2024 margin
- D (+10.5) · D 54.3% · R 43.8% · Other 1.9%
- 2008→2024 swing
- -10.1pp toward R · 2008: 20.5pp · 2024: 10.5pp
- All cycles
- 2024: D+10.5 2020: D+12.6 2016: D+4.8 2012: D+16.4 2008: D+20.5
Not yet ingested
- Civics
- —
Market trends
- HPI YoY
- ▼ -64.32%
- Current HPI
- 489.543
- Rent YoY
- ▲ 4.93%
- Metro
- Portland-South Portland, ME
- State GDP YoY
- —
- F500 in state
- 0
Price history
-6.5% since first listed2 events — show timeline
- 2026-05-29 Price Changed $145,000 MREIS
- 2026-05-03 Listed $155,000 MREIS
Property tax history
+8.3%/yrLatest (2024): $1,296 · +7.8% YoY. Source: county tax records.
Cash-flow waterfall
monthlySold comps — $/sqft
last 12 mo · ≤1 miLoading sold comps…