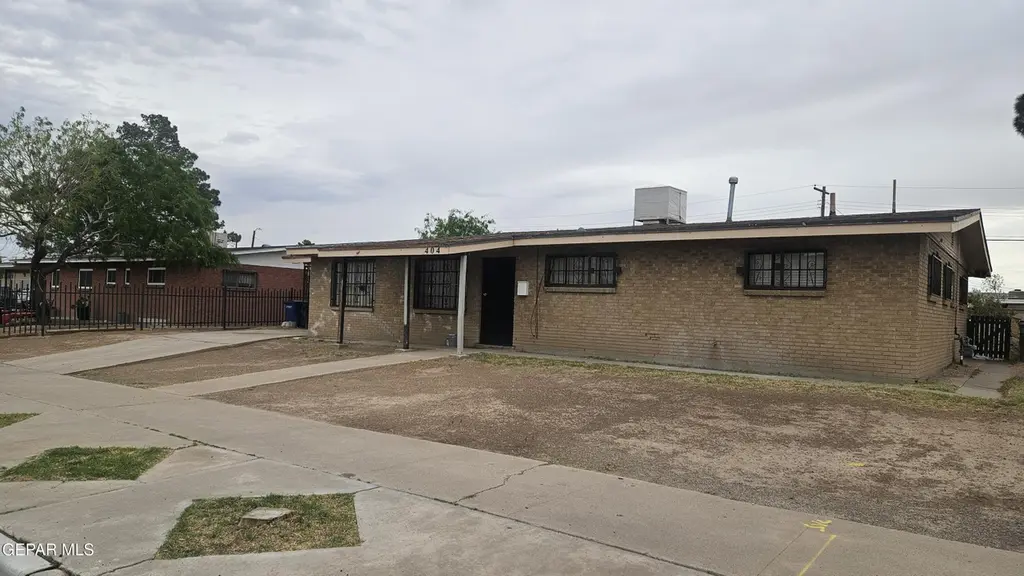
404 Feliz Pl · El Paso, TX
Flood risk 4/10 · Minor
- FEMA flood zone
- X
- Chance of flooding over 30 yrs
- 0.22%
- Est. flood insurance / yr
- $507 – $1,088
Fire risk 1/10 · Minimal
- Est. fire insurance / yr
- $1,222 – $2,270
Heat risk 6/10 · Moderate
- Hot days now (above 102°F)
- 7 days/yr
- Hot days in 30 yrs
- 26 days/yr
Wind risk 1/10 · Minimal
- Chance of severe wind over 30 yrs
- —
Air-quality risk 2/10 · Minimal
- Unhealthy air days now
- 1 days/yr
- Unhealthy air days in 30 yrs
- 2 days/yr
Risk factors via First Street. Map © Google.
Why this score? — see what drove the D grade
The composite is a weighted blend of 9 inputs, each scored 0–100. Each bar is that input's sub-score; the figure is the points it added to the 100-point composite (weight × sub-score).
- Cash flow +11.8/30.0
- Appreciation +10.0/10.0
- 1% rule +5.4/10.0
- Livability +4.0/5.0
- DSCR +3.5/10.0
- Schools +2.7/10.0
- Rent growth +2.5/5.0
- Condition / age +2.5/5.0
- ARV discount +0.0/15.0
$145,000
🖨 Deal sheet (PDF) 📄 Offer letter ✓ Due diligence
Listing remarks
Unlock the potential of this fixer-upper just minutes from Texas Tech and its renowned medical school--an ideal opportunity for investors or savvy buyers. This 3-bedroom, 2-bath home is perfectly positioned near the border, with easy access to I-10 and a variety of popular restaurants and local amenities. With solid bones and a prime location, this property is ready for your vision. Whether you're looking to renovate and resell, create a rental property, or design your dream home, the possibilities here are endless. Don't miss out on this value-packed opportunity in a high-demand area--schedule a showing and see the potential for yourself!
Key facts
- High-demand area
- Local amenities
- Prime location
Tags
Property features AI
Finance
- Other: Lot about 0.21 acre
- Financial info: Special listing condition: Fixer upper
- HOA & community: HOA fee details in remarks
Exterior
- Parking: See remarks
- Security: See remarks
- Utilities: Community sewer
- Home design: Single family residence
- Construction: Brick construction; Shingle roof; Approximately 1970s–2000s era construction (year built not provided); Total building area approximately 1700
- Exterior features: See remarks
Interior
- Kitchen: See remarks (appliances listed in remarks)
- Bedrooms: See remarks
- Flooring: Laminate flooring; Carpet
- Bathrooms: 2 full bathrooms
- Heating & cooling: Forced air heating; Evaporative cooling
- Interior features: See remarks (additional interior details available in listing remarks); Fireplace
- Laundry & utility: See remarks
Neighborhood map
What this means for you Summary
Snapshot
- This is a 3-bed/2.0-bath single-family listed at $145k.
Deal economics
- At list price, monthly cash flow is $-39 ($-468/yr) — negative.
- To cash-flow at today's rent, offer at most $138k (4.7% below list).
- Meets the 1% rule at list price ($2k rent vs $145k).
- Recommended offer: $138k (4.7% below list) — sets the bar for cash-flow.
Location & tenants
- Location reads 81/100 on livability (#23 in TX, #1,375 nationally) — a professional / high-income tenant draw. Strengths: commute A+, cost of living A+, housing A+; Watch: employment D+.
- El Paso ISD (urban): math 27% / reading 37% proficiency, ranked #591 of 826 in TX (top 72%) — families likely to look elsewhere, expect single-tenant / working-renter base with shorter leases; 65% free/reduced lunch — lower-income household profile, screen leases tightly.
- Zoned schools: Clardy El (math 12% / reading 17%); Henderson Middle (math 10% / reading 19%); Jefferson H S (math 17% / reading 18%, grade F, #1,451 of 1,632 statewide, top 89%, 1,107 students, 97% FRL) — zoned schools average 97% FRL vs 65% district-wide (32 pts higher); higher-poverty schools than district average — tighter screening recommended.
- Zoned-school proficiency averages 16% at this address vs 32% district-wide (-16 pts) — the specific schools serving this property underperform the El Paso ISD average; the district grade overstates school quality for this exact location.
- Market conditions: 61 active listings in the ZIP; 10 comparable units currently listed for rent nearby; rentals leasing fast (median 5d on market — plan ~1-2 weeks tenant-placement turnaround); 2,196 units permitted in El Paso County in 2024 (143 in 5+ unit buildings).
Forward outlook
- In year one you build about $16k of equity ($1k loan paydown + $14k appreciation (10.0% local appreciation)).
- El Paso County population projected at +10% by 2050 — modest demand growth; plan on rents tracking national, not racing it.
- At projected returns (10.0% appreciation + 3.0% rent growth), your $41k cash investment doubles in ~3 years — after that, you're playing with house money.
- By year 3, paydown + projected appreciation supports a ~$39k cash-out refi (75% LTV) — recoverable capital for the next deal without selling this one.
Negotiation context
- It's been on market 20 days — a 2% lower offer ($143k) is reasonable based on typical stale-listing flexibility.
- Current owner paid $45k; list at $145k implies a 222% gain — meaningful room to come down on a strong offer.
Risks & watch-outs
- Watch-outs: property tax is 3.4% of price; built in 1956 — expect roof / HVAC / electrical / plumbing capex.
- Climate carrying-cost: extreme-heat days projected 7→26/yr by 2055 (HVAC capex compounding) — expect insurance premiums to compound above CPI over the hold.
Questions for the listing agent
- What do current leases actually rent for vs. the listed asking? Can we see a recent rent roll and the last 12 months of T-12 income?
- Built in 1956 — when were the roof, HVAC, electrical panel, plumbing, and water heater last replaced?
- Property tax is high relative to price — has the assessment been appealed recently, and will the sale trigger a re-assessment?
- Is there a deadline driving the sale (1031 exchange, divorce, estate, relocation)? That informs how much negotiation room exists.
- Schools are B-rated — typically a magnet for longer-tenancy family renters. What's the average tenant stay here, and is there a school-zone premium baked into asking?
- The area grade is low — what's the realistic commute time and amenity access for the typical tenant pool here? Any planned neighborhood developments (good or bad) we should know about?
- What's the average days-on-market for RENTAL listings here right now (not sales)? A rising rental-DOM trend means longer vacancies and softer asking-rent achievability than the comps imply.
- What's the recent tenant-quality profile in this submarket — average credit score on applications, eviction rate, late-payment / NSF rate, and stable-employment percentage? A property-management company in the area should have these aggregated.
- How much new for-sale + rental construction is in the pipeline within 1–3 miles? Heavy new supply typically softens prices + rents 12–24 months out; constrained supply supports both.
Investment metrics
- 1% rule
- 1.04% ✓
- Cap rate
- 5.97%
- Cash-on-cash
- -1.15%
- DSCR
- 0.95
- GRM
- 8.0
CMA / ARV
- ARV (median comp)
- $116,976
- List price
- $145,000
- Delta
- 23.96%
- Verdict
- OVERPRICED
- Comps
- 2 within 2.0 mi
Projected returns pro-forma
10.0% appreciation · 3.0% rent growth · sell at horizon
- IRR
- 23.5%
- Equity multiple
- 2.89×
- Total profit
- $76,651
- Equity at exit
- $130,627
- IRR
- 20.9%
- Equity multiple
- 6.62×
- Total profit
- $227,996
- Equity at exit
- $281,703
Cash invested: $40,600 (down + closing). Projections, not guarantees.
Landlord ↔ Tenant lean methodology
- Overall (STATE)
- 87 Strongly Landlord-Friendly
- State Texas
- 87 Strongly Landlord-Friendly · R+5
- County
- — inherits STATE
- City
- — inherits STATE
ZIP-level market 79905
- Home prices YoY
- 12.8%
- Active inventory
- 61
- Price-to-rent
- 8.0×
Monthly cashflow live
- Estimated rent
- $1,505 high interval (Pro) →
- Mortgage (P&I)
- −$760
- Tax from tax record
- −$407 /mo · $4,884/yr
- Insurance
- −$60
- HOA
- −$0
- Vacancy / Maint / Mgmt
- −$316
- Net cashflow
- $-39
Break-even live
Sensitivity live
| Price | -10% $43 | -5% $2 | +0% $-39 | +5% $-80 | +10% $-121 |
|---|---|---|---|---|---|
| Rent | -10% $-158 | -5% $-98 | +0% $-39 | +5% $20 | +10% $80 |
| Rate | -1.0pp $34 | -0.5pp $-2 | base $-39 | +0.5pp $-77 | +1.0pp $-115 |
UW: 25.0% down · 7.5% · 30yr · 1.5% tax · 5.0% vac · 8.0% maint · 8.0% mgmt
Financing live
Cash to close
- Down payment
- $36,250
- Closing costs
- $4,350
- Reserves months
- —
- Total cash needed
- —
Loan-product check · same deal, 3 products live
Conventional
25% down · 7.5% · 30yr
- Down + closing
- —
- Monthly P&I
- —
- Monthly cashflow
- —
- DSCR
- —
- Eligible?
- —
Personal DTI + credit; lowest rate.
DSCR
20% down · 8.5% · 30yr
- Down + closing
- —
- Monthly P&I
- —
- Monthly cashflow
- —
- DSCR
- —
- Eligible?
- —
No personal income docs; deal must DSCR.
Hard money
10% down · 12.0% · 12mo
- Down + closing
- —
- Monthly P&I
- —
- Monthly cashflow
- —
- DSCR
- —
- Eligible?
- —
Short-term bridge; refi at stabilization.
Rent comps 10 comps
| Address | Beds | Baths | Sqft | Rent | $/sqft | DOM | Units | Dist |
|---|---|---|---|---|---|---|---|---|
| 649 De Vargas Dr El Paso, TX | 3.0 | 1.0 | 1518 | $1,500 | $0.99 | 12d | 1 | 0.44mi |
| 339 Medina St Unit A El Paso, TX | 4.0 | 2.0 | 1300 | $1,465 | $1.13 | 45d | 1 | 0.45mi |
| 517 Val Verde St Unit B El Paso, TX | 2.0 | 2.0 | 1200 | $1,300 | $1.08 | 4d | 1 | 0.46mi |
| 252 Trinity Pl El Paso, TX | 3.0 | 2.0 | 1876 | $1,900 | $1.01 | 4d | 1 | 0.67mi |
| 726 Medina St El Paso, TX | 3.0 | 2.0 | 1310 | $1,600 | $1.22 | 4d | 1 | 0.78mi |
| 209 N Seville Dr Unit A El Paso, TX | 3.0 | 2.5 | 1250 | $1,600 | $1.28 | 4d | 1 | 1.19mi |
| 908 Bolivia St El Paso, TX | 3.0 | 2.0 | 2100 | $1,895 | $0.90 | 4d | 1 | 1.34mi |
| 3816 Findley Ave El Paso, TX | 2.0 | 1.0 | 1149 | $1,080 | $0.94 | 4d | 1 | 1.34mi |
| 3816 Findley Ave El Paso, TX | 2.0 | 1.0 | 1149 | $1,080 | $0.94 | 25d | 1 | 1.34mi |
| 5530 Venezuela Rd El Paso, TX | 3.0 | 3.0 | 1568 | $1,350 | $0.86 | 45d | 1 | 1.37mi |
Listing history 4 events
-
2026-05-18status Pending 653-char remark
-
2026-04-28$145,000 Active 653-char remark
-
1987-07-17soldstatus $45,000
-
1987-06-09soldstatus $35,000
ⓘ Source: listings_history table (triggers on properties + properties_extension) + one-shot
backfill from property_details.listing_events for pre-trigger history.
Tax reassessment forecast TX · Resets to sale price
- Current annual tax
- $4,884 · $407/mo
- Projected year-2 tax
- $4,884 · $407/mo
- Expected delta
- $0/yr ($0/mo · 0.0%)
ⓘ Screening estimate from a state-policy table — verify with the county assessor before closing.
Climate risk First Street
- Flood 4/10 Moderate FEMA zone X · 22% chance over 30 yrs
- Wildfire 1/10 Low
- Heat 6/10 Major 7 d/yr ≥102°F today · 26 d/yr by 30 yrs out
- Wind 1/10 Low
- Air quality 2/10 Low 1 unhealthy d/yr today · 2 by 30 yrs out
Nearby sold comps map
Loading sold comps map…
Walkable amenities ~0.75 mi
Loading nearby amenities…
Taxation est. · year 1
- Rental income
- $18,058
- − Mortgage interest
- −$8,122
- − Property taxes
- −$4,884
- − Insurance
- −$725
- − Repairs & maintenance
- −$1,445
- − Management
- −$1,445
- − Depreciation
- −$4,218
- Taxable loss
- −$2,780
- Est. tax savings @ 24.0%
- +$667
- After-tax cash flow
- $200/yr
For passive investors: Depreciation is non-cash, so a rental often shows a tax loss while cash-flowing — sheltering income. Rental losses are passive: they offset passive income freely, and up to $25,000/yr can offset ordinary (W-2) income if you actively participate and your MAGI is under $100k (phasing out to $0 by $150k); unused losses carry forward. On sale, claimed depreciation is recaptured at up to 25%, and gains may owe capital-gains tax (a 1031 exchange can defer both). Figures are a year-1 estimate at your 24.0% rate — not tax advice; consult a CPA.
Schools (NCES district)
- District
- El Paso ISD
- NCES district ID
- 4818300
- Math proficiency
- 27% ▼ -24.00%
- Reading proficiency
- 37% ▼ -7.00%
- Median HH income
- $38,704
- Composite
- 26.75/100
- National rank
- #7138
- State rank
- #591 of 826 in TX
Livability — El Paso
- Score
- 81/100
- State rank
- #23
- US rank
- #1375
Category grades
Schools grade is shown separately in the Schools card above.
Census & demographics
- Census place
- El Paso, TX
- City population
- 630,223
- Population (ZIP)
- 22,062
Population outlook (El Paso County) Hauer SSP2
- Today (2025)
- 897,899 people
- By 2030
- 922,694 · +2.8%
- By 2040
- 960,492 · +7.0%
- By 2050
- 982,919 · +9.5%
- By 2075
- 997,266 · +11.1%
- By 2100
- 900,630 · +0.3%
Race, ethnicity, and origin ACS 2023
- Neighborhood character
- Predominantly Hispanic (93%)
- Race & ethnicity
- Hispanic / Latino 93% Two or more races 50% White 2% Native American 1% Pacific Islander 1%
- Hispanic origin (detail)
- Mexican 89%
- Foreign-born
- 32% · Canada
- Languages at home
- 14% English-only · Spanish 86%
Political lean MEDSL · El Paso
- 2024 margin
- D (+15.1) · D 57.0% · R 41.8% · Other 1.2%
- 2008→2024 swing
- -17.4pp toward R · 2008: 32.5pp · 2024: 15.1pp
- All cycles
- 2024: D+15.1 2020: D+35.1 2016: D+43.2 2012: D+32.6 2008: D+32.5
Not yet ingested
- Civics
- —
Market trends
- HPI YoY
- ▲ 29.29%
- Current HPI
- 258.3487
- Rent YoY
- —
- Metro
- —
- State GDP YoY
- ▲ 3.95%
- F500 in state
- 110
Industry mix (Fortune 500 HQ in TX)
| Industry | F500 HQs | Revenue |
|---|---|---|
| Energy | 16 | $1,198B |
|
||
| Technology | 5 | $198B |
|
||
| Engineering / Construction | 4 | $72B |
|
||
| Energy Services | 3 | $60B |
|
||
| Utilities | 3 | $41B |
|
||
| Healthcare | 2 | $330B |
|
||
Price history
+314.3% since first listed4 events — show timeline
- 2026-05-18 Pending — GEPARMLS
- 2026-04-28 Listed $145,000 GEPARMLS
- 1987-07-17 Sold (Public Records) $45,000 Public Records
- 1987-06-09 Sold (Public Records) $35,000 Public Records
Property tax history
+12.0%/yrLatest (2025): $4,884 · +11.2% YoY. Source: county tax records.
Cash-flow waterfall
monthlySold comps — $/sqft
last 12 mo · ≤1 miLoading sold comps…