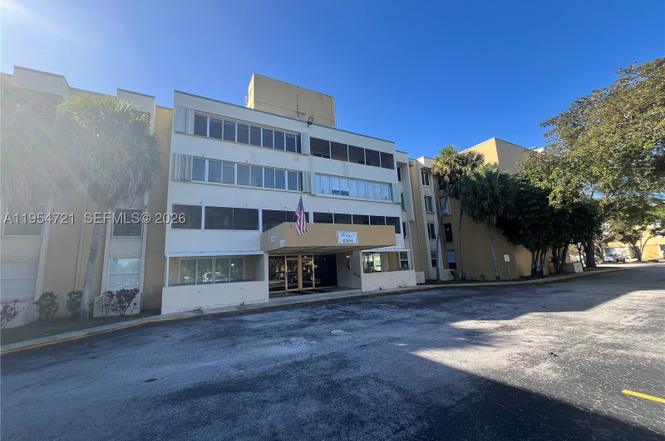
6911 SW 147 Ave Unit 1G · Kendale Lakes, FL
Flood risk 1/10 · Minimal
- FEMA flood zone
- X (unshaded)
- Chance of flooding over 30 yrs
- 0.0%
- Est. flood insurance / yr
- $507 – $1,088
Fire risk 2/10 · Minimal
- Est. fire insurance / yr
- $947 – $1,759
Heat risk 10/10 · Severe
- Hot days now (above 105°F)
- 7 days/yr
- Hot days in 30 yrs
- 29 days/yr
Wind risk 10/10 · Severe
- Chance of severe wind over 30 yrs
- 99.0%
Air-quality risk 2/10 · Minimal
- Unhealthy air days now
- 1 days/yr
- Unhealthy air days in 30 yrs
- 1 days/yr
Risk factors via First Street. Map © Google.
Why this score? — see what drove the D grade
The composite is a weighted blend of 9 inputs, each scored 0–100. Each bar is that input's sub-score; the figure is the points it added to the 100-point composite (weight × sub-score).
- Cash flow +11.7/30.0
- ARV discount +7.5/15.0
- 1% rule +5.1/10.0
- Schools +4.2/10.0
- Livability +3.9/5.0
- DSCR +3.4/10.0
- Condition / age +2.5/5.0
- Rent growth +2.3/5.0
- Appreciation +0.0/10.0
$269,000
🖨 Deal sheet (PDF) 📄 Offer letter ✓ Due diligence
Listing remarks
Discover This Desirable First-Floor Condominium In A Secure, Lakeside Community Adjacent To The Prestigious Miccosukee Golf Course. This Residence Perfectly Combines Accessibility With Upscale Amenities. Building Features: Controlled Access Lobby With Intercom System, Scenic Lake Views, Elevator Access, Two Resort-Style Community Pools, On-Site Laundry Facilities, Ample Guest Parking Plus One Assigned Space. Interior: Enter Through A Welcoming Foyer With Intuitive Flow—Bedrooms Right, Living Spaces Left. Elegant Large Tiles Throughout Main Areas, Laminate Flooring In Bedrooms. Master Suite: Spacious With Three Generous Closets Including Walk-In, Vanity Area, And Full Bathroom With Tub
Key facts
- Scenic lake views
- Ample guest parking
- Elevator access
Tags
Property features AI
Finance
- Other: Association pool
- HOA & community: Monthly association fee of $415; Association covers common areas, grounds maintenance, structure maintenance, pools, sewer, security, trash and water; Community amenities include a pool and elevators
Exterior
- Parking: Guest parking available; One assigned space
- Security: Intercom; Security guard; Smoke detector(s)
- Utilities: Cable available
- Home design: First-floor condo; Single-story unit; Faces east; Entry level 1; Attached property
- Construction: Block construction
- Exterior features: Patio; Storm/security shutters; Lakefront
Interior
- Kitchen: Dishwasher; Electric range; Microwave; Refrigerator; Garbage disposal; Electric water heater
- Bedrooms: Bedroom on main level
- Flooring: Hardwood; Tile; Wood
- Bathrooms: 2 full bathrooms
- Heating & cooling: Central heating; Central air conditioning; Ceiling fan(s)
- Interior features: Blinds; Entrance foyer; First-floor entry; Main living area on entry level; Tub/shower; Walk-in closet(s)
Neighborhood map
What this means for you Summary
Snapshot
- This is a 2-bed/2.0-bath condo listed at $269k.
Deal economics
- At list price, monthly cash flow is $-80 ($-957/yr) — negative.
- To cash-flow at today's rent, offer at most $255k (5.2% below list).
- Meets the 1% rule at list price ($3k rent vs $269k).
- Recommended offer: $237k (12.0% below list) — sets the bar for market timing.
- Cap rate 5.9% vs local median 3.6% in Kendale Lakes — top-decile yield for the area; either an underpriced asset or a hidden risk that comps aren't pricing in. Stress-test before assuming the spread holds.
Location & tenants
- Location reads 77/100 on livability (#186 in FL, #2,923 nationally) — a middle-class / working-renter tenant base. Strengths: housing A+, crime A-, commute B+; Watch: amenities F.
- Miami-Dade (suburban): math 45% / reading 54% proficiency, ranked #40 of 73 in FL (top 55%) — families likely to look elsewhere, expect single-tenant / working-renter base with shorter leases; 64% free/reduced lunch — lower-income household profile, screen leases tightly.
- Zoned schools: Bent Tree Elementary School (math 57% / reading 67%, grade B, #608 of 2,144 statewide, top 29%, 395 students, 60% FRL); Howard D. Mcmillan Middle School (math 54% / reading 61%, grade B, #157 of 571 statewide, top 28%, 865 students, 60% FRL); Miami Sunset Senior High School (math 30% / reading 42%, grade F, #359 of 667 statewide, top 55%, 1,062 students, 54% FRL).
- Market conditions: Rents soft (-0.7%/yr); 183 active listings in the ZIP; 40 comparable units currently listed for rent nearby; rentals at typical pace (median 20d on market — plan ~3-4 weeks tenant-placement turnaround); solid renter incomes; 10,051 units permitted in Miami-Dade County in 2024 (7,758 in 5+ unit buildings).
- This rent runs 42% of the median local income ($78k/yr) — at the standard rent-burdened threshold; future hikes will face affordability resistance.
Forward outlook
- Local home prices are declining (-3.0%/yr); year-one equity from $2k of loan paydown is wiped out by about $8k of value loss. Plan a longer hold.
- Miami-Dade County population projected at +28% by 2050 — long-run rental-demand tailwind backs the buy-and-hold thesis.
Negotiation context
- It's been on market 124 days — a 12% lower offer ($237k) is reasonable based on typical stale-listing flexibility.
- 5 sale attempts since 12y ago with the ask held roughly flat each time — persistent listings suggest the price (not the market) is what's stuck; bring a comps-based counter.
- Current owner paid $113k; list at $269k implies a 138% gain — meaningful room to come down on a strong offer.
Risks & watch-outs
- Climate carrying-cost: severe wind risk, 99% chance of damaging wind over 30y; extreme-heat days projected 7→29/yr by 2055 (HVAC capex compounding) — expect insurance premiums to compound above CPI over the hold.
Questions for the listing agent
- What do current leases actually rent for vs. the listed asking? Can we see a recent rent roll and the last 12 months of T-12 income?
- It's been on market 124 days. Have you received any prior offers? Is the seller open to a 12% concession, seller financing, or rate buy-down credit?
- Built in 1973 — when were the roof, HVAC, electrical panel, plumbing, and water heater last replaced?
- What does the HOA fee cover, when was the last increase, and are there any pending special assessments or reserve-fund shortfalls?
- Any open or pending special assessments — roof, HVAC, plumbing, elevator, façade? What's the per-unit balance and payoff schedule, and is the seller paying it off at close or rolling it to the buyer?
- Why hasn't it sold? Are there any deal-killer items the seller is aware of (foundation, flood, title, zoning, code violations)?
- Is there a deadline driving the sale (1031 exchange, divorce, estate, relocation)? That informs how much negotiation room exists.
- Schools are A-rated — typically a magnet for longer-tenancy family renters. What's the average tenant stay here, and is there a school-zone premium baked into asking?
- The area grade is low — what's the realistic commute time and amenity access for the typical tenant pool here? Any planned neighborhood developments (good or bad) we should know about?
- What's the average days-on-market for RENTAL listings here right now (not sales)? A rising rental-DOM trend means longer vacancies and softer asking-rent achievability than the comps imply.
- What's the recent tenant-quality profile in this submarket — average credit score on applications, eviction rate, late-payment / NSF rate, and stable-employment percentage? A property-management company in the area should have these aggregated.
- How much new apartment / multifamily construction is in the pipeline within 1–3 miles? Heavy new supply (>2% of stock underway) typically softens rents 12–24 months out; light construction supports rent growth.
Investment metrics
- 1% rule
- 1.01% ✓
- Cap rate
- 5.94%
- Cash-on-cash
- -1.27%
- DSCR
- 0.94
- GRM
- 8.2
CMA / ARV
No comps found within radius.
Projected returns pro-forma
-3.0% appreciation · 0.0% rent growth · sell at horizon
- IRR
- -22.4%
- Equity multiple
- 0.25×
- Total profit
- $-56,385
- Equity at exit
- $40,109
- IRR
- -29.8%
- Equity multiple
- -0.13×
- Total profit
- $-85,401
- Equity at exit
- $23,258
Cash invested: $75,320 (down + closing). Projections, not guarantees.
Landlord ↔ Tenant lean methodology
- Overall (STATE)
- 87 Strongly Landlord-Friendly
- State Florida
- 87 Strongly Landlord-Friendly · R+3
- County
- — inherits STATE
- City
- — inherits STATE
ZIP-level market 33193
- Home prices YoY
- -23.0%
- Rents YoY
- -0.7%
- Active inventory
- 183
- Price-to-rent
- 8.2×
Monthly cashflow live
- Estimated rent
- $2,725 high interval (Pro) →
- Mortgage (P&I)
- −$1,411
- Tax from tax record
- −$295 /mo · $3,534/yr
- Insurance
- −$112
- HOA
- −$415
- Vacancy / Maint / Mgmt
- −$572
- Net cashflow
- $-80
Break-even live
Sensitivity live
| Price | -10% $72 | -5% $-4 | +0% $-80 | +5% $-156 | +10% $-232 |
|---|---|---|---|---|---|
| Rent | -10% $-295 | -5% $-187 | +0% $-80 | +5% $28 | +10% $135 |
| Rate | -1.0pp $56 | -0.5pp $-11 | base $-80 | +0.5pp $-149 | +1.0pp $-220 |
UW: 25.0% down · 7.5% · 30yr · 1.5% tax · 5.0% vac · 8.0% maint · 8.0% mgmt
Financing live
Cash to close
- Down payment
- $67,250
- Closing costs
- $8,070
- Reserves months
- —
- Total cash needed
- —
Loan-product check · same deal, 3 products live
Conventional
25% down · 7.5% · 30yr
- Down + closing
- —
- Monthly P&I
- —
- Monthly cashflow
- —
- DSCR
- —
- Eligible?
- —
Personal DTI + credit; lowest rate.
DSCR
20% down · 8.5% · 30yr
- Down + closing
- —
- Monthly P&I
- —
- Monthly cashflow
- —
- DSCR
- —
- Eligible?
- —
No personal income docs; deal must DSCR.
Hard money
10% down · 12.0% · 12mo
- Down + closing
- —
- Monthly P&I
- —
- Monthly cashflow
- —
- DSCR
- —
- Eligible?
- —
Short-term bridge; refi at stabilization.
Rent comps 40 comps
| Address | Beds | Baths | Sqft | Rent | $/sqft | DOM | Units | Dist |
|---|---|---|---|---|---|---|---|---|
| 6911 SW 147th Ave Miami, FL | 3.0 | 2.0 | 1700 | $2,600 | $1.53 | 26d | 1 | 0.01mi |
| 6801 SW 147th Ave Unit 2D Miami, FL | 3.0 | 2.0 | 1700 | $2,700 | $1.59 | 4d | 1 | 0.04mi |
| 6841 SW 147th Ave Unit 2H Miami, FL | 3.0 | 2.0 | 1700 | $3,000 | $1.76 | 26d | 1 | 0.05mi |
| 6526 Kendale Lakes Dr #1405 Miami, FL | 3.0 | 3.0 | 1770 | $2,950 | $1.67 | 4d | 1 | 0.26mi |
| 6526 Kendale Lakes Dr Miami, FL | 3.0 | 2.0 | 1770 | $3,150 | $1.78 | 0d | 1 | 0.26mi |
| 6255 SW Kendale Lakes Cir #116 Miami, FL | 3.0 | 2.0 | 1090 | $2,545 | $2.33 | 9d | 1 | 0.45mi |
| 6255 SW Kendale Lakes Cir #225 Miami, FL | 3.0 | 2.5 | 1220 | $2,300 | $1.89 | 19d | 1 | 0.45mi |
| 6255 SW Kendale Lakes Cir #116 Miami, FL | 3.0 | 2.0 | 1090 | $2,595 | $2.38 | 23d | 1 | 0.45mi |
| 6235 SW Kendale Lakes Cir Miami, FL | 3.0 | 2.5 | 1220 | $2,600 | $2.13 | 26d | 3 | 0.50mi |
| 6235 SW Kendale Lakes Cir Miami, FL | 3.0 | 2.5 | 1220 | $2,550 | $2.09 | 4d | 3 | 0.50mi |
| 6225 SW Kendale Lakes Cir #258 Miami, FL | 3.0 | 2.5 | 1220 | $2,400 | $1.97 | 23d | 1 | 0.52mi |
| 6225 SW Kendale Lakes Cir #263 Miami, FL | 3.0 | 2.5 | 1220 | $2,695 | $2.21 | 9d | 1 | 0.52mi |
| 7403 SW 152nd Ave Unit 204-2 Miami, FL | 3.0 | 2.0 | 994 | $2,600 | $2.62 | 15d | 1 | 0.55mi |
| 7429 SW 152nd Ave Unit 13-205 Miami, FL | 3.0 | 2.0 | 994 | $2,300 | $2.31 | 12d | 1 | 0.57mi |
| 7429 SW 152nd Ave Unit 13-205 Miami, FL | 3.0 | 2.0 | 994 | $2,300 | $2.31 | 23d | 1 | 0.57mi |
| 14250 SW 62nd St Miami, FL | 2.0 | 2.0 | 1020 | $2,200 | $2.16 | 3d | 3 | 0.60mi |
| 14250 SW 62nd St Miami, FL | 2.0 | 2.0 | 1020 | $2,250 | $2.21 | 4d | 3 | 0.60mi |
| 14979 SW 63rd St Miami, FL | 3.0 | 2.0 | 1602 | $3,081 | $1.92 | 9d | 1 | 0.60mi |
| 14979 SW 63rd St Miami, FL | 3.0 | 2.0 | 1602 | $3,015 | $1.88 | 4d | 1 | 0.60mi |
| 14005 SW 67th Ter Miami, FL | 2.0 | 2.5 | 1119 | $3,000 | $2.68 | 0d | 1 | 0.62mi |
| 14770 SW 60th St Miami, FL | 3.0 | 2.0 | 1322 | $3,000 | $2.27 | 6d | 1 | 0.63mi |
| 14907 SW 80th St #205 Miami, FL | 2.0 | 2.5 | 1060 | $2,500 | $2.36 | 23d | 1 | 0.63mi |
| 6653 SW 140th Ave Unit 6653 Miami, FL | 3.0 | 2.5 | 1592 | $3,500 | $2.20 | 0d | 1 | 0.64mi |
| 13953 Kendale Lakes Cir Unit 608B Miami, FL | 3.0 | 2.5 | 1848 | $2,800 | $1.52 | 0d | 1 | 0.65mi |
| 13953 Kendale Lakes Cir Unit 608B Miami, FL | 3.0 | 2.5 | 1848 | $3,000 | $1.62 | 26d | 1 | 0.65mi |
| 14145 SW Kendale Lakes Cir Miami, FL | 2.0 | 2.5 | 1440 | $2,950 | $2.05 | 0d | 1 | 0.66mi |
| 14145 SW Kendale Lakes Cir Miami, FL | 2.0 | 2.5 | 1440 | $2,850 | $1.98 | 26d | 1 | 0.66mi |
| 14901 SW 80th St Miami, FL | 2.0 | 2.0 | 995 | $2,345 | $2.36 | 23d | 2 | 0.67mi |
| 13932 Kendale Lakes Dr #13932 Miami, FL | 3.0 | 2.0 | 1109 | $3,100 | $2.80 | 26d | 1 | 0.67mi |
| 14901 SW 80th St Miami, FL | 2.0 | 2.0 | 900 | $2,390 | $2.66 | 26d | 1 | 0.67mi |
| 7119 SW 153rd Ct Miami, FL | 3.0 | 2.0 | 1116 | $2,900 | $2.60 | 3d | 1 | 0.68mi |
| 7119 SW 153rd Ct Miami, FL | 3.0 | 2.0 | 1116 | $2,900 | $2.60 | 3d | 1 | 0.68mi |
| 7119 SW 153rd Ct Miami, FL | 3.0 | 2.0 | 1116 | $2,800 | $2.51 | 13d | 1 | 0.68mi |
| 15050 SW 63rd St Miami, FL | 3.0 | 2.0 | 1430 | $3,450 | $2.41 | 23d | 1 | 0.69mi |
| 15050 SW 63rd St Miami, FL | 3.0 | 2.0 | 1430 | $3,450 | $2.41 | 21d | 1 | 0.69mi |
| 6326 SW 139th Ct Unit 6326 Miami, FL | 3.0 | 2.0 | 1628 | $3,000 | $1.84 | 26d | 1 | 0.69mi |
| 6350 SW 139th Ct Miami, FL | 2.0 | 2.5 | 1440 | $2,800 | $1.94 | 26d | 1 | 0.70mi |
| 14831 Kendale Lakes Blvd Unit na Miami, FL | 3.0 | 2.0 | 1377 | $4,000 | $2.90 | 26d | 1 | 0.73mi |
| 14831 SW 82nd St Miami, FL | 3.0 | 2.0 | 1377 | $3,800 | $2.76 | 26d | 1 | 0.73mi |
| 5852 SW 147th Pl Miami, FL | 2.0 | 1.0 | 1605 | $1,800 | $1.12 | 26d | 1 | 0.73mi |
HOA detail condo
- Monthly dues
- $415 · $4,980/yr
- Likely covers
- pool
- Assessments
- None detected in remarks — confirm with the listing agent.
Listing history 22 events
-
2026-06-02status $269,000 Pending 124 DOM
-
2026-06-01days on market $269,000 Active 124 DOM
-
2026-05-31days on market $269,000 Active 123 DOM
-
2026-03-10price $269,000
-
2026-01-26$275,000 Active
-
2018-08-04status Pending
-
2018-08-04historical
-
2018-05-20status Active
-
2018-03-13status Pending
-
2018-02-01price $174,500
-
2017-10-03$180,000 Active
-
2014-12-09historical
-
2014-07-22$150,000 Active
-
2014-05-17soldstatus $113,200 Sold
-
2014-05-16soldstatus $113,200
-
2014-03-10status Pending
-
2014-02-01historical
-
2014-01-29$99,000 Active
-
2006-09-29soldstatus $216,000
-
1999-10-27soldstatus $69,500
-
1992-08-20soldstatus $45,000
-
1978-10-01soldstatus $39,500
ⓘ Source: listings_history table (triggers on properties + properties_extension) + one-shot
backfill from property_details.listing_events for pre-trigger history.
Tax reassessment forecast FL · Resets to sale price
- Current annual tax
- $3,534 · $295/mo
- Projected year-2 tax
- $3,534 · $295/mo
- Expected delta
- $0/yr ($0/mo · 0.0%)
ⓘ Screening estimate from a state-policy table — verify with the county assessor before closing.
Climate risk First Street
- Flood 1/10 Low FEMA zone X (unshaded) · 0% chance over 30 yrs
- Wildfire 2/10 Low
- Heat 10/10 Extreme 7 d/yr ≥105°F today · 29 d/yr by 30 yrs out
- Wind 10/10 Extreme 99% chance of damaging wind over 30 yrs
- Air quality 2/10 Low 1 unhealthy d/yr today · 1 by 30 yrs out
Nearby sold comps map
Loading sold comps map…
Walkable amenities ~0.75 mi
Loading nearby amenities…
Taxation est. · year 1
- Rental income
- $32,696
- − Mortgage interest
- −$15,068
- − Property taxes
- −$3,534
- − Insurance
- −$1,345
- − Repairs & maintenance
- −$2,616
- − Management
- −$2,616
- − HOA
- −$4,980
- − Depreciation
- −$7,825
- Taxable loss
- −$5,288
- Est. tax savings @ 24.0%
- +$1,269
- After-tax cash flow
- $312/yr
For passive investors: Depreciation is non-cash, so a rental often shows a tax loss while cash-flowing — sheltering income. Rental losses are passive: they offset passive income freely, and up to $25,000/yr can offset ordinary (W-2) income if you actively participate and your MAGI is under $100k (phasing out to $0 by $150k); unused losses carry forward. On sale, claimed depreciation is recaptured at up to 25%, and gains may owe capital-gains tax (a 1031 exchange can defer both). Figures are a year-1 estimate at your 24.0% rate — not tax advice; consult a CPA.
Schools (NCES district)
- District
- Miami-Dade
- NCES district ID
- 1200390
- Math proficiency
- 45% ▼ -16.00%
- Reading proficiency
- 54% ▼ -5.00%
- Median HH income
- $43,928
- Composite
- 41.76/100
- National rank
- #3397
- State rank
- #40 of 73 in FL
Livability — Kendale Lakes
- Score
- 77/100
- State rank
- #186
- US rank
- #2923
Category grades
Schools grade is shown separately in the Schools card above.
Census & demographics
- Census place
- Kendale Lakes, FL
- County
- Miami-Dade County · 2,697,751 people
- City population
- 33,811
- Metro
- Miami-Fort Lauderdale-Pompano Beach, FL
- Population (ZIP)
- 47,494
- Household income
- $77,839
- Rent vs Own
- Severe rent burden
- 2065.0
Population outlook (Miami-Dade County) Hauer SSP2
- Today (2025)
- 3,126,439 people
- By 2030
- 3,325,765 · +6.4%
- By 2040
- 3,697,561 · +18.3%
- By 2050
- 4,012,134 · +28.3%
- By 2075
- 4,605,612 · +47.3%
- By 2100
- 4,866,598 · +55.7%
Race, ethnicity, and origin ACS 2023
- Neighborhood character
- Predominantly Hispanic (88%)
- Race & ethnicity
- Hispanic / Latino 88% Two or more races 52% White 7% Asian 3%
- Hispanic origin (detail)
- Mexican 1% Puerto Rican 3% Cuban 50% Dominican 3%
- Foreign-born
- 65% · Canada, Jamaica, China
- Languages at home
- 11% English-only · Spanish 86% Other Indo-European 1% Chinese 1%
Political lean MEDSL · Miami-Dade
- 2024 margin
- R (+11.4) · D 43.9% · R 55.4%
- 2008→2024 swing
- -27.6pp toward R · 2008: 16.1pp · 2024: -11.4pp
- All cycles
- 2024: R+11.4 2020: D+7.3 2016: D+29.6 2012: D+23.7 2008: D+16.1
Not yet ingested
- Civics
- —
Market trends
- HPI YoY
- ▼ -124.85%
- Current HPI
- 418.2591
- Rent YoY
- ▼ -0.73%
- Metro
- Miami-Fort Lauderdale-Pompano Beach, FL
- State GDP YoY
- ▲ 3.28%
- F500 in state
- 36
Industry mix (Fortune 500 HQ in FL)
| Industry | F500 HQs | Revenue |
|---|---|---|
| Industrial Technology | 2 | $29B |
|
||
| Insurance | 2 | $17B |
|
||
| Retail | 1 | $60B |
|
||
| Technology Distribution | 1 | $58B |
|
||
| Homebuilding | 1 | $35B |
|
||
| Technology Manufacturing | 1 | $35B |
|
||
Price history
+581.0% since first listed19 events — show timeline
- 2026-03-10 Price Changed $269,000 MARMLS
- 2026-01-26 Listed $275,000 MARMLS
- 2018-08-04 Pending — MARMLS
- 2018-08-04 Listing Removed — MARMLS
- 2018-05-20 Relisted — MARMLS
- 2018-03-13 Pending — MARMLS
- 2018-02-01 Price Changed $174,500 MARMLS
- 2017-10-03 Listed $180,000 MARMLS
- 2014-12-09 Listing Removed — MARMLS
- 2014-07-22 Listed $150,000 MARMLS
- 2014-05-17 Sold (MLS) $113,200 MARMLS
- 2014-05-16 Sold (Public Records) $113,200 Public Records
- 2014-03-10 Pending — MARMLS
- 2014-02-01 Listing Removed — MARMLS
- 2014-01-29 Listed $99,000 MARMLS
- 2006-09-29 Sold (Public Records) $216,000 Public Records
- 1999-10-27 Sold (Public Records) $69,500 Public Records
- 1992-08-20 Sold (Public Records) $45,000 Public Records
- 1978-10-01 Sold (Public Records) $39,500 Public Records
Property tax history
+13.3%/yrLatest (2025): $3,534 · +3.9% YoY. Source: county tax records.
Cash-flow waterfall
monthlySold comps — $/sqft
last 12 mo · ≤1 miLoading sold comps…