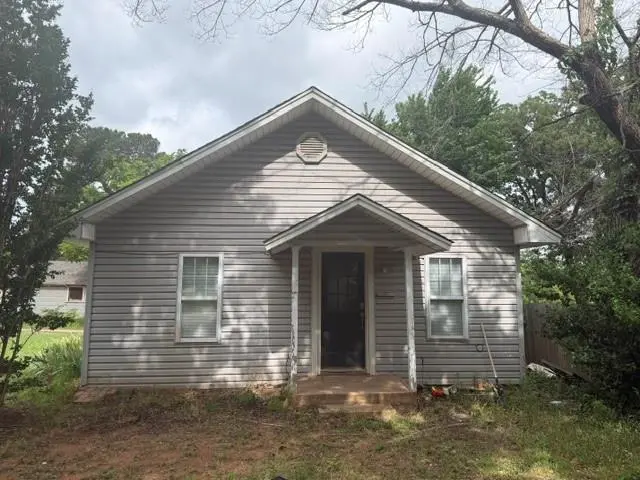
221 Bennett Blvd · Chandler, OK
Flood risk 1/10 · Minimal
- FEMA flood zone
- X (unshaded)
- Chance of flooding over 30 yrs
- 0.0%
- Est. flood insurance / yr
- $507 – $1,088
Fire risk 6/10 · Moderate
- Est. fire insurance / yr
- $2,463 – $4,575
Heat risk 6/10 · Moderate
- Hot days now (above 110°F)
- 7 days/yr
- Hot days in 30 yrs
- 19 days/yr
Wind risk 3/10 · Minor
- Chance of severe wind over 30 yrs
- 5.0%
Air-quality risk 2/10 · Minimal
- Unhealthy air days now
- 1 days/yr
- Unhealthy air days in 30 yrs
- 1 days/yr
Risk factors via First Street. Map © Google.
Why this score? — see what drove the A- grade
The composite is a weighted blend of 9 inputs, each scored 0–100. Each bar is that input's sub-score; the figure is the points it added to the 100-point composite (weight × sub-score).
- Cash flow +29.3/30.0
- ARV discount +15.0/15.0
- DSCR +10.0/10.0
- Appreciation +10.0/10.0
- 1% rule +7.2/10.0
- Livability +3.2/5.0
- Schools +3.0/10.0
- Rent growth +2.5/5.0
- Condition / age +2.5/5.0
$69,900
🖨 Deal sheet 📄 Offer letter ✓ Due diligence
Listing remarks
Great Investment Opportunity 824 SF 2 bedroom 1 bath, home in East Chandler. This has been a great rent house, or if you are looking for a house to fix up and flip, this would be a good one and at a reasonable price. Home sits on a large corner lot, with detached shop or garage.
Key facts
- Large corner lot
- Detached shop
- 7,000 sq ft lot
Tags
Property features AI
Finance
- Other: Located in Chandler — directions: From 1st Street and Bennett in Chandler go 3 blocks south on west side; Not historically designated; Occupied: No; MLS status: Active
- Financial info: Assumable: No; Loan qualification: Unknown; Current listing price reported; Tax amount reported
- HOA & community: No mandatory association dues
Exterior
- Parking: 1 garage space
- Utilities: Living area reported as 824 (assessor)
- Home design: Single family residence; One level; Residential property; Existing property
- Construction: Vinyl siding; Composition roof
- Exterior features: Corner lot; No additional exterior features listed
Interior
- Bedrooms: 2 bedrooms
- Bathrooms: 1 full bathroom
- Heating & cooling: Other heating; Window unit cooling
- Interior features: One living area; Electric fireplace; Below-ground storm shelter; Conventional foundation
Neighborhood map
What this means for you Summary
Snapshot
- This is a 2-bed/1.0-bath single-family listed at $70k.
Deal economics
- At list price, monthly cash flow is $246 ($3k/yr) — positive.
- The deal already cash-flows at list — no discount required.
- Meets the 1% rule at list price ($855 rent vs $70k).
- Cap rate 10.5% vs local median 2.8% in Chandler — top-decile yield for the area; either an underpriced asset or a hidden risk that comps aren't pricing in. Stress-test before assuming the spread holds.
Location & tenants
- Location reads 64/100 on livability (#171 in OK) — a middle-class / working-renter tenant base. Strengths: cost of living A+, housing A+; Watch: crime D, employment D, amenities F.
- Chandler (town): math 35% / reading 35% proficiency, ranked #36 of 270 in OK (top 13%) — families likely to look elsewhere, expect single-tenant / working-renter base with shorter leases.
- Zoned schools: Park Road Es (math 38% / reading 36%, grade F, #132 of 845 statewide, top 19%, 313 students, 0% FRL); Chandler Hs (math 47% / reading 52%, grade D, #9 of 447 statewide, top 2%, 335 students, 0% FRL) — zoned schools average 0% FRL vs 42% district-wide (42 pts lower); this property's tenant base skews higher-income than the district average.
- Market conditions: 121 active listings in the ZIP; 19 units permitted in Lincoln County in 2024 (0 in 5+ unit buildings).
Forward outlook
- In year one you build about $7k of equity ($483 loan paydown + $7k appreciation (10.0% local appreciation)).
- At projected returns (10.0% appreciation + 3.0% rent growth), your $20k cash investment doubles in ~2 years — after that, you're playing with house money.
- By year 5, paydown + projected appreciation supports a ~$35k cash-out refi (75% LTV) — recoverable capital for the next deal without selling this one.
Negotiation context
- Only 6 days on market — expect competitive offers; lowballing is unlikely to land.
- 3 sale attempts since 18y ago with the ask held roughly flat each time — persistent listings suggest the price (not the market) is what's stuck; bring a comps-based counter.
- Current owner paid $27k; list at $70k implies a 159% gain — meaningful room to come down on a strong offer.
Risks & watch-outs
- Watch-outs: built in 1920 — expect roof / HVAC / electrical / plumbing capex.
- Climate carrying-cost: major wildfire risk; extreme-heat days projected 7→19/yr by 2055 (HVAC capex compounding) — expect insurance premiums to compound above CPI over the hold.
Questions for the listing agent
- Built in 1920 — when were the roof, HVAC, electrical panel, plumbing, and water heater last replaced?
- Is there a deadline driving the sale (1031 exchange, divorce, estate, relocation)? That informs how much negotiation room exists.
- Schools are F-rated, which usually means shorter tenancies and higher turnover. Who's the typical renter profile here, and what's been the actual vacancy rate?
- Crime grade is D in this area — have there been break-ins, vandalism, or insurance claims at this property in the last 3 years? What carrier currently insures it and at what premium?
- What's the average days-on-market for RENTAL listings here right now (not sales)? A rising rental-DOM trend means longer vacancies and softer asking-rent achievability than the comps imply.
- What's the recent tenant-quality profile in this submarket — average credit score on applications, eviction rate, late-payment / NSF rate, and stable-employment percentage? A property-management company in the area should have these aggregated.
- How much new for-sale + rental construction is in the pipeline within 1–3 miles? Heavy new supply typically softens prices + rents 12–24 months out; constrained supply supports both.
Investment metrics
- 1% rule
- 1.22% ✓
- Cap rate
- 10.52%
- Cash-on-cash
- 15.11%
- DSCR
- 1.67
- GRM
- 6.8
CMA / ARV
- ARV (on-the-fly)
- $112,888
- Comps found
- 10
Show comp detail 10 sales within ~0.75 mi
| Address | Dist | Beds/Ba | Sqft | Sold | Price | $/sf | Match |
|---|---|---|---|---|---|---|---|
| 418 S Cleveland Ave | 0.30mi | 1/1.0 (-1) | 804 (-2%) | 3mo | $110,000 | $137 | 75 |
| 412 S Cleveland Ave | 0.28mi | 1/1.0 (-1) | 804 (-2%) | 6mo | $115,000 | $143 | 72 |
| 221 N Iowa St | 0.26mi | 2/1.5 | 868 (+5%) | 10mo | $78,000 | $90 | 69 |
| 303 E 4th St | 0.28mi | 2/1.0 | 864 (+5%) | 15mo | $62,000 | $72 | 66 |
| 912 S Bennett Blvd | 0.48mi | 2/1.5 | 840 (+2%) | 15mo | $47,500 | $57 | 60 |
| 820 S Bennett Blvd | 0.41mi | 2/1.0 | 802 (-3%) | 22mo | $83,500 | $104 | 58 |
| 810 E 9th St | 0.44mi | 3/2.0 (+1) | 800 (-3%) | 13mo | $117,000 | $146 | 55 |
| 306 W 4th St | 0.58mi | 2/1.0 | 792 (-4%) | 15mo | $115,000 | $145 | 54 |
| 208 E 10th St | 0.59mi | 2/1.0 | 924 (+12%) | 2mo | $135,000 | $146 | 51 |
| 602 E 9th St | 0.43mi | 2/1.0 | 768 (-7%) | 23mo | $100,000 | $130 | 49 |
Match score weights: distance 35% · size 25% · config 20% · recency 20%. Top-matched comps best support the ARV.
Projected returns pro-forma
10.0% appreciation · 3.0% rent growth · sell at horizon
- IRR
- 35.4%
- Equity multiple
- 3.75×
- Total profit
- $53,748
- Equity at exit
- $62,971
- IRR
- 30.5%
- Equity multiple
- 8.45×
- Total profit
- $145,893
- Equity at exit
- $135,800
Cash invested: $19,572 (down + closing). Projections, not guarantees.
Landlord ↔ Tenant lean methodology
- Overall (STATE)
- 83 Strongly Landlord-Friendly
- State Oklahoma
- 83 Strongly Landlord-Friendly · R+20
- County
- — inherits STATE
- City
- — inherits STATE
ZIP-level market 74834
- Home prices YoY
- 19.9%
- Active inventory
- 121
- Price-to-rent
- 6.8×
Monthly cashflow live
- Estimated rent
- $855 medium interval (Pro) →
- Mortgage (P&I)
- −$367
- Tax from tax record
- −$33 /mo · $395/yr
- Insurance
- −$29
- HOA
- −$0
- Vacancy / Maint / Mgmt
- −$179
- Net cashflow
- $246
Break-even live
UW: 25.0% down · 7.5% · 30yr · 1.5% tax · 5.0% vac · 8.0% maint · 8.0% mgmt
Financing live
Cash to close
- Down payment
- $17,475
- Closing costs
- $2,097
- Reserves months
- —
- Total cash needed
- —
Loan-product check · same deal, 3 products live
Conventional
25% down · 7.5% · 30yr
- Down + closing
- —
- Monthly P&I
- —
- Monthly cashflow
- —
- DSCR
- —
- Eligible?
- —
Personal DTI + credit; lowest rate.
DSCR
20% down · 8.5% · 30yr
- Down + closing
- —
- Monthly P&I
- —
- Monthly cashflow
- —
- DSCR
- —
- Eligible?
- —
No personal income docs; deal must DSCR.
Hard money
10% down · 12.0% · 12mo
- Down + closing
- —
- Monthly P&I
- —
- Monthly cashflow
- —
- DSCR
- —
- Eligible?
- —
Short-term bridge; refi at stabilization.
Listing history 6 events
-
2026-06-18days on market $69,900 Active 6 DOM
-
2026-06-17days on market $69,900 Active 5 DOM
-
2026-06-16days on market $69,900 Active 4 DOM
-
2026-06-15days on market $69,900 Active 3 DOM
-
2026-06-12remarks 282-char remark
-
2026-06-12$69,900 Active 1 DOM
ⓘ Source: listings_history table (triggers on properties + properties_extension) + one-shot
backfill from property_details.listing_events for pre-trigger history.
Tax reassessment forecast OK · Resets to sale price
- Current annual tax
- $395 · $33/mo
- Projected year-2 tax
- $629 · $52/mo
- Expected delta
- +$234/yr (+$20/mo · 59.3%)
ⓘ Screening estimate from a state-policy table — verify with the county assessor before closing.
Climate risk First Street
- Flood 1/10 Low FEMA zone X (unshaded) · 0% chance over 30 yrs
- Wildfire 6/10 Major
- Heat 6/10 Major 7 d/yr ≥110°F today · 19 d/yr by 30 yrs out
- Wind 3/10 Moderate 5% chance of damaging wind over 30 yrs
- Air quality 2/10 Low 1 unhealthy d/yr today · 1 by 30 yrs out
Nearby sold comps map
Loading sold comps map…
Walkable amenities ~0.75 mi
Loading nearby amenities…
Taxation est. · year 1
- Rental income
- $10,255
- − Mortgage interest
- −$3,915
- − Property taxes
- −$395
- − Insurance
- −$350
- − Repairs & maintenance
- −$820
- − Management
- −$820
- − Depreciation
- −$2,033
- Taxable income
- $1,921
- Est. tax owed @ 24.0%
- −$461
- After-tax cash flow
- $2,497/yr
For passive investors: Depreciation is non-cash, so a rental often shows a tax loss while cash-flowing — sheltering income. Rental losses are passive: they offset passive income freely, and up to $25,000/yr can offset ordinary (W-2) income if you actively participate and your MAGI is under $100k (phasing out to $0 by $150k); unused losses carry forward. On sale, claimed depreciation is recaptured at up to 25%, and gains may owe capital-gains tax (a 1031 exchange can defer both). Figures are a year-1 estimate at your 24.0% rate — not tax advice; consult a CPA.
Schools (NCES district)
- District
- Chandler
- NCES district ID
- 4007290
- Math proficiency
- 35% ▲ 1.00%
- Reading proficiency
- 35% ▬ 0.00%
- Median HH income
- $45,229
- Composite
- 29.9/100
- National rank
- #6392
- State rank
- #36 of 270 in OK
Livability — Chandler
- Score
- 64/100
- State rank
- #171
- US rank
- #13840
Category grades
Schools grade is shown separately in the Schools card above.
Census & demographics
- Census place
- Chandler, OK
- City population
- 7,551
- Population (ZIP)
- 7,551
Population outlook (Lincoln County) Hauer SSP2
- Today (2025)
- 36,104 people
- By 2030
- 36,435 · +0.9%
- By 2040
- 36,696 · +1.6%
- By 2050
- 36,216 · +0.3%
- By 2075
- 35,057 · -2.9%
- By 2100
- 31,333 · -13.2%
Race, ethnicity, and origin ACS 2023
- Neighborhood character
- Predominantly White (78%)
- Race & ethnicity
- White 78% Two or more races 12% Hispanic / Latino 3% Black 3% Native American 3%
- Common ancestry
- Lithuanian 4% Slovak 2% Scottish 1%
- Foreign-born
- 1%
- Languages at home
- 97% English-only · Spanish 2%
Political lean MEDSL · Lincoln
- 2024 margin
- Solid R (+63.3) · D 17.5% · R 80.8% · Other 1.7%
- 2008→2024 swing
- -13.4pp toward R · 2008: -49.8pp · 2024: -63.3pp
- All cycles
- 2024: R+63.3 2020: R+63.2 2016: R+60.1 2012: R+49.0 2008: R+49.8
Not yet ingested
- Civics
- —
Market trends
- HPI YoY
- ▲ 52.43%
- Current HPI
- 315.8775
- Rent YoY
- —
- Metro
- —
- State GDP YoY
- ▲ 1.55%
- F500 in state
- 6
Industry mix (Fortune 500 HQ in OK)
| Industry | F500 HQs | Revenue |
|---|---|---|
| Energy | 3 | $48B |
|
||
Price history
+507.8% since first listed8 events — show timeline
- 2026-06-12 Listed $69,900 MLSOK
- 2014-02-07 Listing Removed — MLSOK
- 2013-08-06 Listed $54,500 MLSOK
- 2008-09-03 Listing Removed — MLSOK
- 2008-03-29 Listed $39,900 MLSOK
- 2005-03-21 Sold (Public Records) $27,000 Public Records
- 1998-11-04 Sold (Public Records) $9,000 Public Records
- 1991-11-21 Sold (Public Records) $11,500 Public Records
Property tax history
+5.5%/yrLatest (2025): $395 · -2.0% YoY. Source: county tax records.
Cash-flow waterfall
monthlySold comps — $/sqft
last 12 mo · ≤1 miLoading sold comps…