 Multi-family
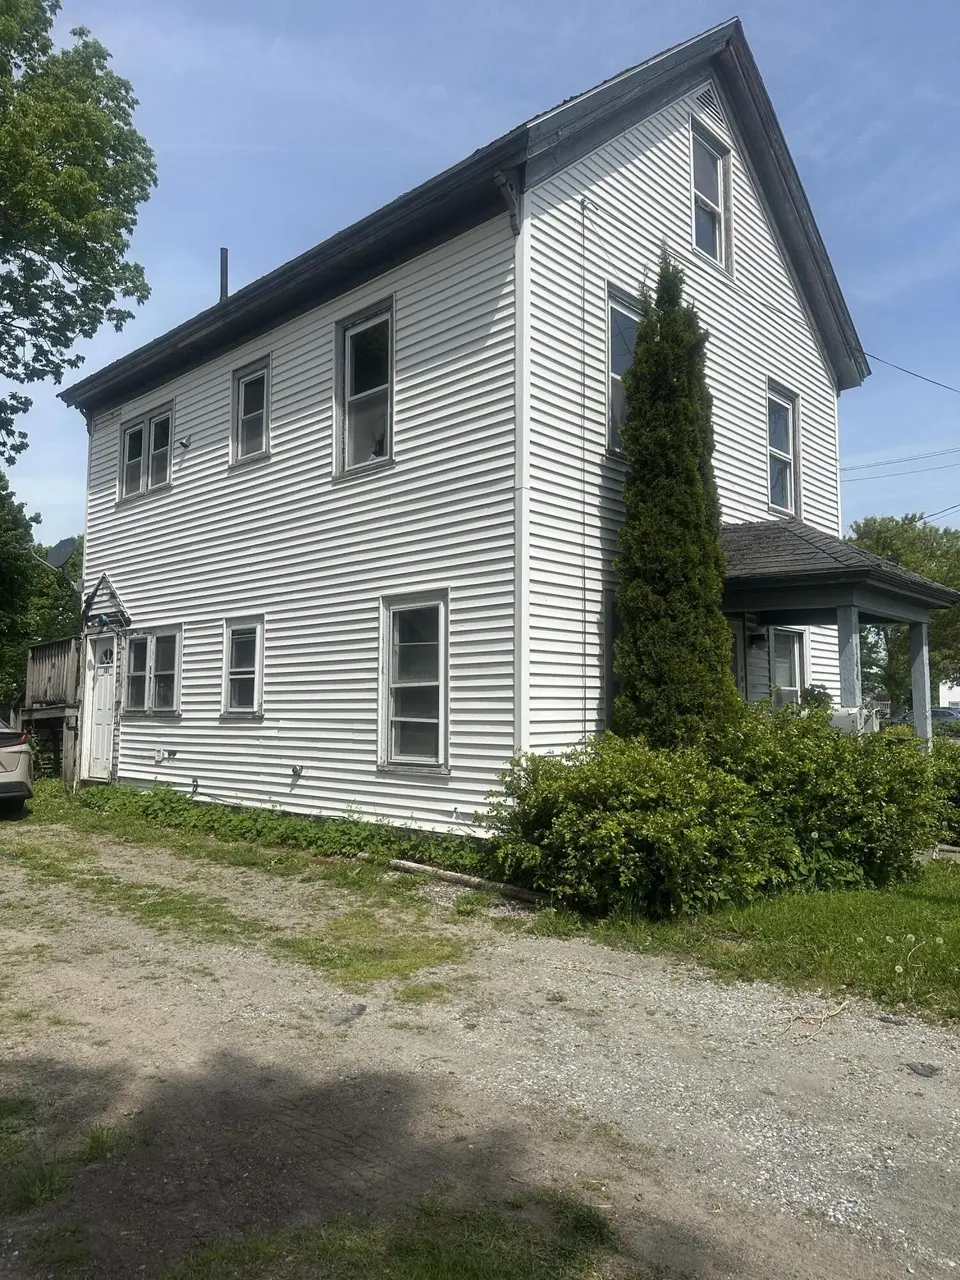
144 Main St · Rockland, ME
Flood risk 1/10 · Minimal
- FEMA flood zone
- X (unshaded)
- Chance of flooding over 30 yrs
- 0.0%
- Est. flood insurance / yr
- $507 – $1,088
Fire risk 1/10 · Minimal
- Est. fire insurance / yr
- $669 – $1,243
Heat risk 5/10 · Moderate
- Hot days now (above 85°F)
- 7 days/yr
- Hot days in 30 yrs
- 18 days/yr
Wind risk 6/10 · Moderate
- Chance of severe wind over 30 yrs
- 72.0%
Air-quality risk 1/10 · Minimal
- Unhealthy air days now
- 0 days/yr
- Unhealthy air days in 30 yrs
- 0 days/yr
Risk factors via First Street. Map © Google.
Why this score? — see what drove the B- grade
The composite is a weighted blend of 9 inputs, each scored 0–100. Each bar is that input's sub-score; the figure is the points it added to the 100-point composite (weight × sub-score).
- Cash flow +30.0/30.0
- 1% rule +10.0/10.0
- DSCR +10.0/10.0
- Schools +6.8/10.0
- Livability +3.1/5.0
- Rent growth +2.5/5.0
- Condition / age +2.5/5.0
- ARV discount +2.3/15.0
- Appreciation +0.0/10.0
$175,000
🖨 Deal sheet (PDF) 📄 Offer letter ✓ Due diligence
Multi-family units
County records classify this as Multi-Family (2-4 Unit). Listing-text estimate: 1 unit. estimate disagrees with records
Listing remarks MLS
Unlock exceptional potential in the heart of Rockland! This prime in-town property offers a rare opportunity for investors, developers, or visionaries seeking residential and commercial possibilities in an unbeatable location. The existing two-unit structure is currently without utility services and is ready for transformation, redevelopment, or reimagining to fit your vision. Positioned just a 3-minute walk from the beach and Rockland Farmers Market, this property places you close to the waterfront, downtown amenities, shops, dining, and community activity. With location, flexibility, and opportunity all in one package, the possibilities here are substantial. Also listed under MLS# 1665693
Key facts
- Two-unit structure
- Downtown amenities
- 6,969 sq ft lot
Tags
Property features AI
Exterior
- Parking: Gravel parking; On-site off-street parking with 1–4 spaces
- Utilities: Public water; Public sewer; Circuit breaker electric; Electric water heater
- Home design: Single family residence; Built in 1897; Seasonal harbor view of Rockland Harbor
- Construction: Wood frame with vinyl siding; Composition shingle roof; Pillar/post/pier foundation
- Exterior features: Located in a business district; In-town location; Near public beach; Near shopping; Near town; Level lot; Sidewalks; Paved road
Interior
- Flooring: Carpet; Laminate; Vinyl; Wood
- Heating & cooling: Heating present
- Interior features: Internet access available
Neighborhood map
What this means for you Summary
Snapshot
- This is a 4-bed/2.0-bath multifamily listed at $175k.
Deal economics
- At list price, monthly cash flow is $1k ($18k/yr) — positive.
- The deal already cash-flows at list — no discount required.
- Meets the 1% rule at list price ($4k rent vs $175k).
- Recommended offer: $172k (1.5% below list) — sets the bar for market timing.
- Cap rate 16.5% vs local median 2.9% in Rockland — top-decile yield for the area; either an underpriced asset or a hidden risk that comps aren't pricing in. Stress-test before assuming the spread holds.
Location & tenants
- Location reads 62/100 on livability (#116 in ME) — a middle-class / working-renter tenant base. Strengths: cost of living A+, housing A+, crime A-; Watch: schools D, amenities F, commute F.
- RSU 13 (town): math 77% / reading 85% proficiency, ranked #84 of 112 in ME (top 75%) — strong family-tenant draw, lease renewals of 3-5y typical.
- Market conditions: 72 active listings in the ZIP; 1 comparable units currently listed for rent nearby; 160 units permitted in Knox County in 2024 (58 in 5+ unit buildings).
- At $3,551/mo this rent would consume 75% of the median local household income ($57k/yr) (locally 279% of renters already pay >50% of income on rent) — very limited rent-growth headroom before tenants either downsize or default.
Forward outlook
- Local home prices are declining (-3.0%/yr); year-one equity from $1k of loan paydown is wiped out by about $5k of value loss. Plan a longer hold.
- Knox County population projected at -14% by 2050 — secular population decline; favor cash flow + early exit over multi-decade hold.
- At projected returns (-3.0% appreciation + 3.0% rent growth), your $49k cash investment doubles in ~4 years — after that, you're playing with house money.
Negotiation context
- It's been on market 16 days — a 2% lower offer ($172k) is reasonable based on typical stale-listing flexibility.
- 8 sale attempts since 25y ago with the ask held roughly flat each time — persistent listings suggest the price (not the market) is what's stuck; bring a comps-based counter.
Risks & watch-outs
- Watch-outs: built in 1897 — expect roof / HVAC / electrical / plumbing capex.
- Climate carrying-cost: major wind risk, 72% chance of damaging wind over 30y; extreme-heat days projected 7→18/yr by 2055 (HVAC capex compounding) — expect insurance premiums to compound above CPI over the hold.
Questions for the listing agent
- Built in 1897 — when were the roof, HVAC, electrical panel, plumbing, and water heater last replaced?
- Is there a deadline driving the sale (1031 exchange, divorce, estate, relocation)? That informs how much negotiation room exists.
- Schools are D-rated, which usually means shorter tenancies and higher turnover. Who's the typical renter profile here, and what's been the actual vacancy rate?
- What's the average days-on-market for RENTAL listings here right now (not sales)? A rising rental-DOM trend means longer vacancies and softer asking-rent achievability than the comps imply.
- What's the recent tenant-quality profile in this submarket — average credit score on applications, eviction rate, late-payment / NSF rate, and stable-employment percentage? A property-management company in the area should have these aggregated.
- How much new apartment / multifamily construction is in the pipeline within 1–3 miles? Heavy new supply (>2% of stock underway) typically softens rents 12–24 months out; light construction supports rent growth.
Investment metrics
- 1% rule
- 2.03% ✓
- Cap rate
- 16.48%
- Cash-on-cash
- 36.37%
- DSCR
- 2.62
- GRM
- 4.1
CMA / ARV
- ARV (on-the-fly)
- $156,766
- Comps found
- 1
Show comp detail 1 sale within ~0.75 mi
| Address | Dist | Beds/Ba | Sqft | Sold | Price | $/sf | Match |
|---|---|---|---|---|---|---|---|
| 126 Broadway | 0.41mi | 4/2.0 | 1,692 (+11%) | 21mo | $173,568 | $103 | 44 |
Match score weights: distance 35% · size 25% · config 20% · recency 20%. Top-matched comps best support the ARV.
Projected returns pro-forma
-3.0% appreciation · 3.0% rent growth · sell at horizon
- IRR
- 32.2%
- Equity multiple
- 2.35×
- Total profit
- $66,354
- Equity at exit
- $26,093
- IRR
- 39.3%
- Equity multiple
- 4.67×
- Total profit
- $180,075
- Equity at exit
- $15,131
Cash invested: $49,000 (down + closing). Projections, not guarantees.
Landlord ↔ Tenant lean methodology
- Overall (STATE)
- 41 Moderately Tenant-Leaning
- State Maine
- 41 Moderately Tenant-Leaning · D+2
- County
- — inherits STATE
- City
- — inherits STATE
ZIP-level market 04841
- Home prices YoY
- -17.8%
- Active inventory
- 72
- Price-to-rent
- 8.2×
Monthly cashflow live
- Estimated rent
- $3,551 high interval (Pro) →
- Mortgage (P&I)
- −$918
- Tax from tax record
- −$330 /mo · $3,954/yr
- Insurance
- −$73
- HOA
- −$0
- Vacancy / Maint / Mgmt
- −$746
- Net cashflow
- $1,485
Break-even live
Sensitivity live
| Price | -10% $1,584 | -5% $1,535 | +0% $1,485 | +5% $1,436 | +10% $1,386 |
|---|---|---|---|---|---|
| Rent | -10% $1,205 | -5% $1,345 | +0% $1,485 | +5% $1,625 | +10% $1,766 |
| Rate | -1.0pp $1,573 | -0.5pp $1,530 | base $1,485 | +0.5pp $1,440 | +1.0pp $1,394 |
2-unit breakdown (identical units grouped — click to expand)
| Units | Beds | Baths | Est. rent |
|---|---|---|---|
| 2× units | 2 | 1 | $3,552 |
| #1 | 2 | 1 | $1,776 |
| #2 | 2 | 1 | $1,776 |
| Total (2 units) | $3,551 | ||
UW: 25.0% down · 7.5% · 30yr · 1.5% tax · 5.0% vac · 8.0% maint · 8.0% mgmt
Financing live
Cash to close
- Down payment
- $43,750
- Closing costs
- $5,250
- Reserves months
- —
- Total cash needed
- —
Loan-product check · same deal, 3 products live
Conventional
25% down · 7.5% · 30yr
- Down + closing
- —
- Monthly P&I
- —
- Monthly cashflow
- —
- DSCR
- —
- Eligible?
- —
Personal DTI + credit; lowest rate.
DSCR
20% down · 8.5% · 30yr
- Down + closing
- —
- Monthly P&I
- —
- Monthly cashflow
- —
- DSCR
- —
- Eligible?
- —
No personal income docs; deal must DSCR.
Hard money
10% down · 12.0% · 12mo
- Down + closing
- —
- Monthly P&I
- —
- Monthly cashflow
- —
- DSCR
- —
- Eligible?
- —
Short-term bridge; refi at stabilization.
Rent comps 1 comps
| Address | Beds | Baths | Sqft | Rent | $/sqft | DOM | Units | Dist |
|---|---|---|---|---|---|---|---|---|
| 74 Maverick St Rockland, ME | 4.0 | 2.0 | 1528 | $2,600 | $1.70 | 15d | 1 | 1.30mi |
Listing history 11 events
-
2026-06-21days on market $175,000 Active 16 DOM
-
2026-06-18days on market $175,000 Active 13 DOM
-
2026-06-17days on market $175,000 Active 12 DOM
-
2026-06-16days on market $175,000 Active 11 DOM
-
2026-06-15days on market $175,000 Active 10 DOM
-
2026-06-14days on market $175,000 Active 8 DOM
-
2026-06-10days on market $175,000 Active 5 DOM
-
2026-06-09days on market $175,000 Active 4 DOM
-
2026-06-08days on market $175,000 Active 3 DOM
-
2026-06-07remarks 699-char remark
-
2026-06-07$175,000 Active 2 DOM
ⓘ Source: listings_history table (triggers on properties + properties_extension) + one-shot
backfill from property_details.listing_events for pre-trigger history.
Tax reassessment forecast ME · Partial reset (capped growth)
- Current annual tax
- $3,954 · $330/mo
- Projected year-2 tax
- $3,954 · $330/mo
- Expected delta
- $0/yr ($0/mo · 0.0%)
ⓘ Screening estimate from a state-policy table — verify with the county assessor before closing.
Climate risk First Street
- Flood 1/10 Low FEMA zone X (unshaded) · 0% chance over 30 yrs
- Wildfire 1/10 Low
- Heat 5/10 Major 7 d/yr ≥85°F today · 18 d/yr by 30 yrs out
- Wind 6/10 Major 72% chance of damaging wind over 30 yrs
- Air quality 1/10 Low 0 unhealthy d/yr today · 0 by 30 yrs out
Nearby sold comps map
Loading sold comps map…
Walkable amenities ~0.75 mi
Loading nearby amenities…
Taxation est. · year 1
- Rental income
- $42,612
- − Mortgage interest
- −$9,803
- − Property taxes
- −$3,954
- − Insurance
- −$875
- − Repairs & maintenance
- −$3,409
- − Management
- −$3,409
- − Depreciation
- −$5,091
- Taxable income
- $16,071
- Est. tax owed @ 24.0%
- −$3,857
- After-tax cash flow
- $13,965/yr
For passive investors: Depreciation is non-cash, so a rental often shows a tax loss while cash-flowing — sheltering income. Rental losses are passive: they offset passive income freely, and up to $25,000/yr can offset ordinary (W-2) income if you actively participate and your MAGI is under $100k (phasing out to $0 by $150k); unused losses carry forward. On sale, claimed depreciation is recaptured at up to 25%, and gains may owe capital-gains tax (a 1031 exchange can defer both). Figures are a year-1 estimate at your 24.0% rate — not tax advice; consult a CPA.
Schools (NCES district)
- District
- RSU 13
- NCES district ID
- 2314787
- Math proficiency
- 77% ▲ 51.00%
- Reading proficiency
- 85% ▲ 36.00%
- Median HH income
- $43,177
- Composite
- 67.81/100
- National rank
- #363
- State rank
- #84 of 112 in ME
Livability — Rockland
- Score
- 62/100
- State rank
- #116
- US rank
- #16831
Category grades
Schools grade is shown separately in the Schools card above.
Census & demographics
- Census place
- Rockland, ME
- County
- Knox County · 7,035 people
- City population
- 7,035
- Metro
- nan
- Population (ZIP)
- 7,035
- Household income
- $56,533
- Rent vs Own
- Severe rent burden
- 279.0
Population outlook (Knox County) Hauer SSP2
- Today (2025)
- 39,304 people
- By 2030
- 38,497 · -2.1%
- By 2040
- 36,090 · -8.2%
- By 2050
- 33,681 · -14.3%
- By 2075
- 29,934 · -23.8%
- By 2100
- 24,633 · -37.3%
Race, ethnicity, and origin ACS 2023
- Neighborhood character
- Predominantly White (97%)
- Race & ethnicity
- White 97% Two or more races 3%
- Common ancestry
- Slovak 12% Serbian 8% Lithuanian 5%
- Foreign-born
- 1% · Canada
- Languages at home
- 97% English-only · French/Haitian/Cajun 2%
Political lean MEDSL · Knox
- 2024 margin
- D (+18.6) · D 58.2% · R 39.6% · Other 2.1%
- 2008→2024 swing
- -2.8pp toward R · 2008: 21.4pp · 2024: 18.6pp
- All cycles
- 2024: D+18.6 2020: D+19.9 2016: D+14.3 2012: D+22.6 2008: D+21.4
Not yet ingested
- Civics
- —
Market trends
- HPI YoY
- ▼ -73.90%
- Current HPI
- 341.7862
- Rent YoY
- —
- Metro
- nan
- State GDP YoY
- —
- F500 in state
- 0
Price history
+253.5% since first listed20 events — show timeline
- 2026-06-05 Listed $175,000 MREIS
- 2026-06-05 Listed $175,000 MREIS
- 2024-06-25 Delisted — MREIS
- 2024-06-25 Delisted — MREIS
- 2024-05-30 Contingent — MREIS
- 2024-05-30 Contingent — MREIS
- 2024-02-11 Relisted — MREIS
- 2024-02-11 Relisted — MREIS
- 2024-01-19 Pending — MREIS
- 2024-01-19 Pending — MREIS
- 2024-01-02 Contingent — MREIS
- 2024-01-02 Contingent — MREIS
- 2023-12-01 Listed $155,000 MREIS
- 2023-12-01 Listed $155,000 MREIS
- 2021-12-16 Sold (MLS) $160,000 MREIS
- 2006-07-21 Sold (Public Records) $120,000 Public Records
- 2002-05-21 Sold (Public Records) $58,000 Public Records
- 2001-08-28 Listed $70,000 MREIS
- 2001-01-22 Listed $90,000 MREIS
- 1998-07-21 Sold (Public Records) $49,500 Public Records
Property tax history
+5.3%/yrLatest (2025): $3,954 · +36.8% YoY. Source: county tax records.
Cash-flow waterfall
monthlySold comps — $/sqft
last 12 mo · ≤1 miLoading sold comps…