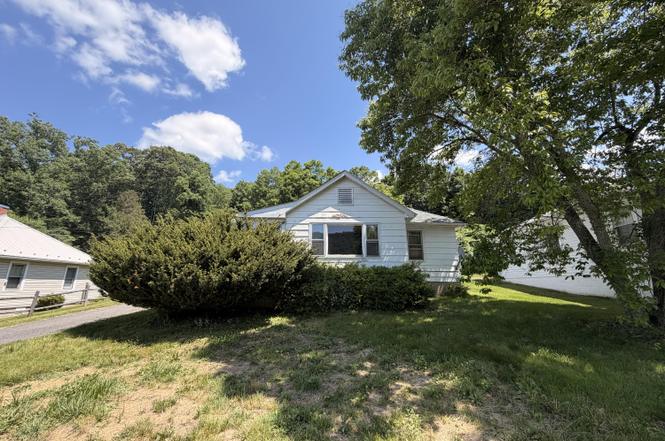
25 Doe Valley Trl · Hot Springs, VA
Flood risk 1/10 · Minimal
- FEMA flood zone
- X (unshaded)
- Chance of flooding over 30 yrs
- 0.0%
- Est. flood insurance / yr
- $507 – $1,088
Fire risk 4/10 · Minor
- Est. fire insurance / yr
- $666 – $1,236
Heat risk 2/10 · Minimal
- Hot days now (above 88°F)
- 7 days/yr
- Hot days in 30 yrs
- 19 days/yr
Wind risk 2/10 · Minimal
- Chance of severe wind over 30 yrs
- —
Air-quality risk 1/10 · Minimal
- Unhealthy air days now
- 0 days/yr
- Unhealthy air days in 30 yrs
- 0 days/yr
Risk factors via First Street. Map © Google.
Why this score? — see what drove the B+ grade
The composite is a weighted blend of 9 inputs, each scored 0–100. Each bar is that input's sub-score; the figure is the points it added to the 100-point composite (weight × sub-score).
- Cash flow +30.0/30.0
- DSCR +10.0/10.0
- 1% rule +8.7/10.0
- ARV discount +7.5/15.0
- Appreciation +6.3/10.0
- Schools +5.3/10.0
- Livability +2.7/5.0
- Rent growth +2.5/5.0
- Condition / age +2.5/5.0
$75,000
🖨 Deal sheet 📄 Offer letter ✓ Due diligence
Listing remarks
Charming 3-bedroom, 1-bath ranch-style home offered below assessed value, making this an excellent opportunity for a first-time homebuyer or investor. This single-family home is located just minutes from the Omni Homestead Resort and close to local shops, dining, and town amenities. This home offers scenic mountain views from the front and a peaceful wooded backdrop in the rear. Inside, the home features a combination of hardwood floors and wall-to-wall carpeting, with hardwood in two bedrooms and carpeting in three rooms. A vinyl-enclosed rear sun porch provides additional space to relax or unwind. Public utilities. The property includes a private driveway with designated parking spots. Th
Key facts
- Heat pump
- Private driveway
- Shingle roof
Tags
Property features AI
Finance
- Financial info: Annual tax amount listed as $550
Exterior
- Utilities: Electric heat pump for heating and cooling
- Home design: Residential property built in 1946
- Construction: Built in 1946
- Exterior features: 0.38-acre lot
Interior
- Bedrooms: Three bedrooms, all on the main level
- Flooring: Carpet; Laminate
- Bathrooms: One full bathroom on the main level
- Heating & cooling: Heat pump (electric) providing both heating and cooling
- Interior features: Seven total rooms; Crawl space basement
Neighborhood map
What this means for you Summary
Snapshot
- This is a 3-bed/1.0-bath single-family listed at $75k.
Deal economics
- At list price, monthly cash flow is $345 ($4k/yr) — positive.
- The deal already cash-flows at list — no discount required.
- Meets the 1% rule at list price ($1k rent vs $75k).
Location & tenants
- Location reads 54/100 on livability (#527 in VA) — a working-class tenant base; expect higher turnover. Strengths: schools A+, cost of living A+, health & safety A+; Watch: amenities F, commute F, employment F.
- Bath County Public School District (rural): math 59% / reading 67% proficiency, ranked #50 of 131 in VA (top 38%) — acceptable for families but not a draw, mixed tenant base, ~2y average lease.
- Market conditions: 40 active listings in the ZIP; 8 units permitted in Bath County in 2024 (0 in 5+ unit buildings).
Forward outlook
- In year one you build about $3k of equity ($519 loan paydown + $2k appreciation (2.7% local appreciation)).
- Bath County population projected at -14% by 2050 — secular population decline; favor cash flow + early exit over multi-decade hold.
- At projected returns (2.7% appreciation + 3.0% rent growth), your $21k cash investment doubles in ~3 years — after that, you're playing with house money.
Negotiation context
- Only 6 days on market — expect competitive offers; lowballing is unlikely to land.
- 2 sale attempts with the ask held roughly flat each time — persistent listings suggest the price (not the market) is what's stuck; bring a comps-based counter.
Risks & watch-outs
- Watch-outs: built in 1946 — expect roof / HVAC / electrical / plumbing capex.
Questions for the listing agent
- Built in 1946 — when were the roof, HVAC, electrical panel, plumbing, and water heater last replaced?
- Is there a deadline driving the sale (1031 exchange, divorce, estate, relocation)? That informs how much negotiation room exists.
- Schools are A-rated — typically a magnet for longer-tenancy family renters. What's the average tenant stay here, and is there a school-zone premium baked into asking?
- What's the average days-on-market for RENTAL listings here right now (not sales)? A rising rental-DOM trend means longer vacancies and softer asking-rent achievability than the comps imply.
- What's the recent tenant-quality profile in this submarket — average credit score on applications, eviction rate, late-payment / NSF rate, and stable-employment percentage? A property-management company in the area should have these aggregated.
- How much new for-sale + rental construction is in the pipeline within 1–3 miles? Heavy new supply typically softens prices + rents 12–24 months out; constrained supply supports both.
Investment metrics
- 1% rule
- 1.37% ✓
- Cap rate
- 11.81%
- Cash-on-cash
- 19.70%
- DSCR
- 1.88
- GRM
- 6.1
CMA / ARV
No comps found within radius.
Projected returns pro-forma
2.7% appreciation · 3.0% rent growth · sell at horizon
- IRR
- 25.4%
- Equity multiple
- 2.42×
- Total profit
- $29,791
- Equity at exit
- $32,463
- IRR
- 26.4%
- Equity multiple
- 4.66×
- Total profit
- $76,766
- Equity at exit
- $49,071
Cash invested: $21,000 (down + closing). Projections, not guarantees.
Landlord ↔ Tenant lean methodology
- Overall (STATE)
- 55 Moderately Landlord-Leaning
- State Virginia
- 55 Moderately Landlord-Leaning · D+2
- County
- — inherits STATE
- City
- — inherits STATE
ZIP-level market 24445
- Home prices YoY
- 1.9%
- Active inventory
- 40
- Price-to-rent
- 6.1×
Monthly cashflow live
- Estimated rent
- $1,030 medium interval (Pro) →
- Mortgage (P&I)
- −$393
- Tax from tax record
- −$45 /mo · $537/yr
- Insurance
- −$31
- HOA
- −$0
- Vacancy / Maint / Mgmt
- −$216
- Net cashflow
- $345
Break-even live
UW: 25.0% down · 7.5% · 30yr · 1.5% tax · 5.0% vac · 8.0% maint · 8.0% mgmt
Financing live
Cash to close
- Down payment
- $18,750
- Closing costs
- $2,250
- Reserves months
- —
- Total cash needed
- —
Loan-product check · same deal, 3 products live
Conventional
25% down · 7.5% · 30yr
- Down + closing
- —
- Monthly P&I
- —
- Monthly cashflow
- —
- DSCR
- —
- Eligible?
- —
Personal DTI + credit; lowest rate.
DSCR
20% down · 8.5% · 30yr
- Down + closing
- —
- Monthly P&I
- —
- Monthly cashflow
- —
- DSCR
- —
- Eligible?
- —
No personal income docs; deal must DSCR.
Hard money
10% down · 12.0% · 12mo
- Down + closing
- —
- Monthly P&I
- —
- Monthly cashflow
- —
- DSCR
- —
- Eligible?
- —
Short-term bridge; refi at stabilization.
Listing history 1 events
-
2026-06-12days on market $75,000 Pending 6 DOM
ⓘ Source: listings_history table (triggers on properties + properties_extension) + one-shot
backfill from property_details.listing_events for pre-trigger history.
Tax reassessment forecast VA · Resets to sale price
- Current annual tax
- $537 · $45/mo
- Projected year-2 tax
- $615 · $51/mo
- Expected delta
- +$78/yr (+$6/mo · 14.5%)
ⓘ Screening estimate from a state-policy table — verify with the county assessor before closing.
Climate risk First Street
- Flood 1/10 Low FEMA zone X (unshaded) · 0% chance over 30 yrs
- Wildfire 4/10 Moderate
- Heat 2/10 Low 7 d/yr ≥88°F today · 19 d/yr by 30 yrs out
- Wind 2/10 Low
- Air quality 1/10 Low 0 unhealthy d/yr today · 0 by 30 yrs out
Nearby sold comps map
Loading sold comps map…
Walkable amenities ~0.75 mi
Loading nearby amenities…
Taxation est. · year 1
- Rental income
- $12,365
- − Mortgage interest
- −$4,201
- − Property taxes
- −$537
- − Insurance
- −$375
- − Repairs & maintenance
- −$989
- − Management
- −$989
- − Depreciation
- −$2,182
- Taxable income
- $3,092
- Est. tax owed @ 24.0%
- −$742
- After-tax cash flow
- $3,395/yr
For passive investors: Depreciation is non-cash, so a rental often shows a tax loss while cash-flowing — sheltering income. Rental losses are passive: they offset passive income freely, and up to $25,000/yr can offset ordinary (W-2) income if you actively participate and your MAGI is under $100k (phasing out to $0 by $150k); unused losses carry forward. On sale, claimed depreciation is recaptured at up to 25%, and gains may owe capital-gains tax (a 1031 exchange can defer both). Figures are a year-1 estimate at your 24.0% rate — not tax advice; consult a CPA.
Schools (NCES district)
- District
- Bath County Public School District
- NCES district ID
- 5100330
- Math proficiency
- 59% ▼ -29.00%
- Reading proficiency
- 67% ▼ -14.00%
- Median HH income
- $46,995
- Composite
- 53.25/100
- National rank
- #1496
- State rank
- #50 of 131 in VA
Livability — Hot Springs
- Score
- 54/100
- State rank
- #527
- US rank
- #24141
Category grades
Schools grade is shown separately in the Schools card above.
Census & demographics
- Census place
- Hot Springs, VA
- Population (ZIP)
- 2,395
Population outlook (Bath County) Hauer SSP2
- Today (2025)
- 4,319 people
- By 2030
- 4,198 · -2.8%
- By 2040
- 3,897 · -9.8%
- By 2050
- 3,719 · -13.9%
- By 2075
- 3,404 · -21.2%
- By 2100
- 4,049 · -6.3%
Race, ethnicity, and origin ACS 2023
- Neighborhood character
- Predominantly White (89%)
- Race & ethnicity
- White 89% Hispanic / Latino 6% Black 3% Two or more races 1%
- Hispanic origin (detail)
- Mexican 1% Puerto Rican 4%
- Common ancestry
- Serbian 1% Romanian 1% Slovak 1%
- Foreign-born
- 1% · Canada
- Languages at home
- 94% English-only · Spanish 6%
Political lean MEDSL · Bath
- 2024 margin
- Solid R (+53.8) · D 22.8% · R 76.5%
- 2008→2024 swing
- -41.2pp toward R · 2008: -12.6pp · 2024: -53.8pp
- All cycles
- 2024: R+53.8 2020: R+47.5 2016: R+42.1 2012: R+17.1 2008: R+12.6
Not yet ingested
- Civics
- —
Market trends
- HPI YoY
- ▲ 2.70%
- Current HPI
- 146.3707
- Rent YoY
- —
- Metro
- —
- State GDP YoY
- ▲ 2.40%
- F500 in state
- 50
Industry mix (Fortune 500 HQ in VA)
| Industry | F500 HQs | Revenue |
|---|---|---|
| Aerospace / Defense | 4 | $236B |
|
||
| Technology / Defense | 3 | $32B |
|
||
| Financial Services | 2 | $176B |
|
||
| Utilities | 2 | $27B |
|
||
| Insurance | 2 | $25B |
|
||
| Technology | 2 | $15B |
|
||
Price history
4 events — show timeline
- 2026-05-28 Pending — MLSRV
- 2026-05-28 Relisted — MLSRV
- 2026-01-05 Listing Removed — MLSRV
- 2026-01-01 Listed $75,000 MLSRV
Property tax history
+23.9%/yrLatest (2025): $537 · +11.7% YoY. Source: county tax records.
Cash-flow waterfall
monthlySold comps — $/sqft
last 12 mo · ≤1 miLoading sold comps…