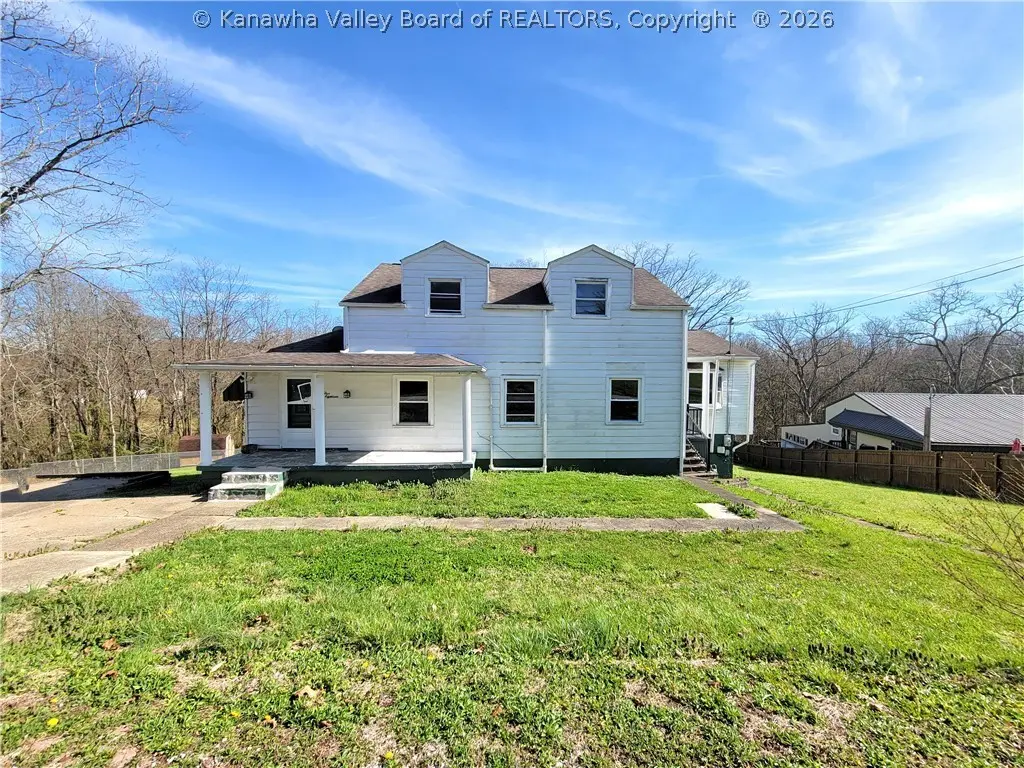
518 High St · St. Albans, WV
Flood risk 1/10 · Minimal
- FEMA flood zone
- X (unshaded)
- Chance of flooding over 30 yrs
- 0.0%
- Est. flood insurance / yr
- $473 – $860
Fire risk 3/10 · Minor
- Est. fire insurance / yr
- $787 – $1,461
Heat risk 5/10 · Moderate
- Hot days now (above 101°F)
- 7 days/yr
- Hot days in 30 yrs
- 19 days/yr
Wind risk 2/10 · Minimal
- Chance of severe wind over 30 yrs
- 1.0%
Air-quality risk 1/10 · Minimal
- Unhealthy air days now
- 0 days/yr
- Unhealthy air days in 30 yrs
- 0 days/yr
Risk factors via First Street. Map © Google.
Why this score? — see what drove the B- grade
The composite is a weighted blend of 9 inputs, each scored 0–100. Each bar is that input's sub-score; the figure is the points it added to the 100-point composite (weight × sub-score).
- Cash flow +30.0/30.0
- 1% rule +10.0/10.0
- DSCR +10.0/10.0
- ARV discount +7.5/15.0
- Schools +2.9/10.0
- Rent growth +2.5/5.0
- Livability +2.5/5.0
- Condition / age +2.5/5.0
- Appreciation +0.0/10.0
$56,900
🖨 Deal sheet (PDF) 📄 Offer letter ✓ Due diligence
Listing remarks MLS
Looking for a home that has space to spread out? Main level features an oversized living room, dining room, kitchen, family room, bedroom, and full bath. The upper level has been used for 2 bedrooms, 1 bedroom and an office, etc. The lower has an additional 920 square feet of space that includes a wood burning stove, bathroom, and large rec room. Exterior features include a large deck, storage building, and partially fenced yard
Key facts
- 0.33 acre lot
- Built 1944
- Listed 34 days
Property features AI
Exterior
- Utilities: Public water; Public sewer
- Home design: Single-family residence; Two levels (2 stories)
- Construction: Aluminum siding; Frame construction; Plaster; Composition/shingle roof
- Exterior features: Deck; Porch
Interior
- Flooring: Hardwood flooring; Vinyl flooring; Other flooring
- Bathrooms: 1 full bathroom
- Heating & cooling: Central air conditioning; Forced air heating
- Interior features: Insulated windows; Partial basement
Neighborhood map
What this means for you Summary
Snapshot
- This is a 3-bed/2.0-bath single-family listed at $57k.
Deal economics
- At list price, monthly cash flow is $627 ($8k/yr) — positive.
- The deal already cash-flows at list — no discount required.
- Meets the 1% rule at list price ($1k rent vs $57k).
- Recommended offer: $55k (3.0% below list) — sets the bar for market timing.
- Cap rate 19.5% vs local median 4.8% in St. Albans — top-decile yield for the area; either an underpriced asset or a hidden risk that comps aren't pricing in. Stress-test before assuming the spread holds.
Location & tenants
- Location reads: area grade B — affects rentability + tenant quality, not the cash-flow math above.
- Kanawha County Schools (suburban): math 29% / reading 40% proficiency, ranked #17 of 55 in WV (top 31%) — families likely to look elsewhere, expect single-tenant / working-renter base with shorter leases.
- Zoned schools: Central Elementary School (math 22% / reading 27%, grade F, #287 of 377 statewide, top 85%, 333 students, 0% FRL); Hayes Middle School (math 24% / reading 39%, grade F, #52 of 109 statewide, top 49%, 436 students, 0% FRL); Saint Albans High School (math 32% / reading 57%, grade F, #11 of 110 statewide, top 11%, 993 students, 0% FRL) — zoned schools average 0% FRL vs 46% district-wide (46 pts lower); this property's tenant base skews higher-income than the district average.
- Market conditions: 119 active listings in the ZIP; 103 units permitted in Kanawha County in 2024 (0 in 5+ unit buildings).
Forward outlook
- Local home prices are declining (-3.0%/yr); year-one equity from $393 of loan paydown is wiped out by about $2k of value loss. Plan a longer hold.
- Kanawha County population projected at -17% by 2050 — secular population decline; favor cash flow + early exit over multi-decade hold.
- At projected returns (-3.0% appreciation + 3.0% rent growth), your $16k cash investment doubles in ~3 years — after that, you're playing with house money.
Negotiation context
- It's been on market 34 days — a 3% lower offer ($55k) is reasonable based on typical stale-listing flexibility.
- 3 sale attempts since 12y ago with the ask held roughly flat each time — persistent listings suggest the price (not the market) is what's stuck; bring a comps-based counter.
Risks & watch-outs
- Watch-outs: built in 1944 — expect roof / HVAC / electrical / plumbing capex.
- Climate carrying-cost: extreme-heat days projected 7→19/yr by 2055 (HVAC capex compounding) — expect insurance premiums to compound above CPI over the hold.
Questions for the listing agent
- It's been on market 34 days. Have you received any prior offers? Is the seller open to a 3% concession, seller financing, or rate buy-down credit?
- Built in 1944 — when were the roof, HVAC, electrical panel, plumbing, and water heater last replaced?
- Is there a deadline driving the sale (1031 exchange, divorce, estate, relocation)? That informs how much negotiation room exists.
- What's the average days-on-market for RENTAL listings here right now (not sales)? A rising rental-DOM trend means longer vacancies and softer asking-rent achievability than the comps imply.
- What's the recent tenant-quality profile in this submarket — average credit score on applications, eviction rate, late-payment / NSF rate, and stable-employment percentage? A property-management company in the area should have these aggregated.
- How much new for-sale + rental construction is in the pipeline within 1–3 miles? Heavy new supply typically softens prices + rents 12–24 months out; constrained supply supports both.
Investment metrics
- 1% rule
- 2.27% ✓
- Cap rate
- 19.52%
- Cash-on-cash
- 47.25%
- DSCR
- 3.10
- GRM
- 3.7
CMA / ARV
- ARV (on-the-fly)
- $204,840
- Comps found
- 8
Show comp detail 8 sales within ~0.75 mi
| Address | Dist | Beds/Ba | Sqft | Sold | Price | $/sf | Match |
|---|---|---|---|---|---|---|---|
| 518 High St | 0.00mi | 3/1.0 | 2,276 (0%) | 0mo | $60,000 | $26 | 96 |
| 432 Fairview Dr | 0.45mi | 4/2.0 (+1) | 2,273 (-0%) | 10mo | $115,000 | $51 | 66 |
| 413 Lore St | 0.45mi | 3/1.5 | 2,066 (-9%) | 1mo | $132,000 | $64 | 61 |
| 561 Valley St | 0.30mi | 4/2.5 (+1) | 2,500 (+10%) | 3mo | $240,000 | $96 | 60 |
| 5 Rolling Oaks Ests | 0.46mi | 4/3.0 (+1) | 2,317 (+2%) | 19mo | $256,000 | $110 | 50 |
| 1052 Meadowview Ln | 0.56mi | 4/2.0 (+1) | 2,032 (-11%) | 1mo | $183,000 | $90 | 50 |
| 100 Crescent Rd | 0.53mi | 4/3.5 (+1) | 2,437 (+7%) | 4mo | $255,000 | $105 | 49 |
| 141 Tompkins Dr | 0.55mi | 4/2.5 (+1) | 2,588 (+14%) | 16mo | $195,000 | $75 | 32 |
Match score weights: distance 35% · size 25% · config 20% · recency 20%. Top-matched comps best support the ARV.
Projected returns pro-forma
-3.0% appreciation · 3.0% rent growth · sell at horizon
- IRR
- 44.6%
- Equity multiple
- 2.93×
- Total profit
- $30,758
- Equity at exit
- $8,484
- IRR
- 50.6%
- Equity multiple
- 5.92×
- Total profit
- $78,318
- Equity at exit
- $4,920
Cash invested: $15,932 (down + closing). Projections, not guarantees.
Landlord ↔ Tenant lean methodology
- Overall (STATE)
- 83 Strongly Landlord-Friendly
- State West Virginia
- 83 Strongly Landlord-Friendly · R+22
- County
- — inherits STATE
- City
- — inherits STATE
ZIP-level market 25177
- Home prices YoY
- -16.6%
- Active inventory
- 119
- Price-to-rent
- 3.7×
Monthly cashflow live
- Estimated rent
- $1,293 medium interval (Pro) →
- Mortgage (P&I)
- −$298
- Tax from tax record
- −$72 /mo · $868/yr
- Insurance
- −$24
- HOA
- −$0
- Vacancy / Maint / Mgmt
- −$272
- Net cashflow
- $627
Break-even live
Sensitivity live
| Price | -10% $660 | -5% $643 | +0% $627 | +5% $611 | +10% $595 |
|---|---|---|---|---|---|
| Rent | -10% $525 | -5% $576 | +0% $627 | +5% $678 | +10% $730 |
| Rate | -1.0pp $656 | -0.5pp $642 | base $627 | +0.5pp $613 | +1.0pp $598 |
UW: 25.0% down · 7.5% · 30yr · 1.5% tax · 5.0% vac · 8.0% maint · 8.0% mgmt
Financing live
Cash to close
- Down payment
- $14,225
- Closing costs
- $1,707
- Reserves months
- —
- Total cash needed
- —
Loan-product check · same deal, 3 products live
Conventional
25% down · 7.5% · 30yr
- Down + closing
- —
- Monthly P&I
- —
- Monthly cashflow
- —
- DSCR
- —
- Eligible?
- —
Personal DTI + credit; lowest rate.
DSCR
20% down · 8.5% · 30yr
- Down + closing
- —
- Monthly P&I
- —
- Monthly cashflow
- —
- DSCR
- —
- Eligible?
- —
No personal income docs; deal must DSCR.
Hard money
10% down · 12.0% · 12mo
- Down + closing
- —
- Monthly P&I
- —
- Monthly cashflow
- —
- DSCR
- —
- Eligible?
- —
Short-term bridge; refi at stabilization.
Listing history 9 events
-
2026-05-14status Pending
-
2026-04-11$56,900 Active
-
2020-03-12soldstatus $105,000
-
2020-03-11soldstatus $105,000 433-char remark
Show marketing remark (433 chars)
Looking for a home that has space to spread out? Main level features an oversized living room, dining room, kitchen, family room, bedroom, and full bath. The upper level has been used for 2 bedrooms, 1 bedroom and an office, etc. The lower has an additional 920 square feet of space that includes a wood burning stove, bathroom, and large rec room. Exterior features include a large deck, storage building, and partially fenced yard
-
2019-08-19$107,000 433-char remark
Show marketing remark (433 chars)
Looking for a home that has space to spread out? Main level features an oversized living room, dining room, kitchen, family room, bedroom, and full bath. The upper level has been used for 2 bedrooms, 1 bedroom and an office, etc. The lower has an additional 920 square feet of space that includes a wood burning stove, bathroom, and large rec room. Exterior features include a large deck, storage building, and partially fenced yard
-
2014-09-10soldstatus $103,000 144-char remark
Show marketing remark (144 chars)
Very Nice 3 Bedroom 2 Bath With Updated Kitchen And Bath. Large Back Yard And Large Deck. 2 Fireplaces. Hardwood Floors. Home Warranty Included.
-
2014-09-10soldstatus $103,000
Show marketing remark (144 chars)
Very Nice 3 Bedroom 2 Bath With Updated Kitchen And Bath. Large Back Yard And Large Deck. 2 Fireplaces. Hardwood Floors. Home Warranty Included.
-
2014-05-05$110,000 144-char remark
Show marketing remark (144 chars)
Very Nice 3 Bedroom 2 Bath With Updated Kitchen And Bath. Large Back Yard And Large Deck. 2 Fireplaces. Hardwood Floors. Home Warranty Included.
-
2001-07-31soldstatus $75,000
ⓘ Source: listings_history table (triggers on properties + properties_extension) + one-shot
backfill from property_details.listing_events for pre-trigger history.
Tax reassessment forecast WV · Resets to sale price
- Current annual tax
- $868 · $72/mo
- Projected year-2 tax
- $868 · $72/mo
- Expected delta
- $0/yr ($0/mo · 0.0%)
ⓘ Screening estimate from a state-policy table — verify with the county assessor before closing.
Climate risk First Street
- Flood 1/10 Low FEMA zone X (unshaded) · 0% chance over 30 yrs
- Wildfire 3/10 Moderate
- Heat 5/10 Major 7 d/yr ≥101°F today · 19 d/yr by 30 yrs out
- Wind 2/10 Low 100% chance of damaging wind over 30 yrs
- Air quality 1/10 Low 0 unhealthy d/yr today · 0 by 30 yrs out
Nearby sold comps map
Loading sold comps map…
Walkable amenities ~0.75 mi
Loading nearby amenities…
Taxation est. · year 1
- Rental income
- $15,521
- − Mortgage interest
- −$3,187
- − Property taxes
- −$868
- − Insurance
- −$284
- − Repairs & maintenance
- −$1,242
- − Management
- −$1,242
- − Depreciation
- −$1,655
- Taxable income
- $7,043
- Est. tax owed @ 24.0%
- −$1,690
- After-tax cash flow
- $5,838/yr
For passive investors: Depreciation is non-cash, so a rental often shows a tax loss while cash-flowing — sheltering income. Rental losses are passive: they offset passive income freely, and up to $25,000/yr can offset ordinary (W-2) income if you actively participate and your MAGI is under $100k (phasing out to $0 by $150k); unused losses carry forward. On sale, claimed depreciation is recaptured at up to 25%, and gains may owe capital-gains tax (a 1031 exchange can defer both). Figures are a year-1 estimate at your 24.0% rate — not tax advice; consult a CPA.
Schools (NCES district)
- District
- Kanawha County Schools
- NCES district ID
- 5400600
- Math proficiency
- 29% ▼ -13.00%
- Reading proficiency
- 40% ▼ -7.00%
- Median HH income
- $44,329
- Composite
- 29.35/100
- National rank
- #6540
- State rank
- #17 of 55 in WV
Livability — St. Albans
No livability data for this city. (Only ~50 U.S. cities are tracked.)
Census & demographics
- City population
- 23,211
- Population (ZIP)
- 23,211
Population outlook (Kanawha County) Hauer SSP2
- Today (2025)
- 178,946 people
- By 2030
- 172,906 · -3.4%
- By 2040
- 159,874 · -10.7%
- By 2050
- 148,148 · -17.2%
- By 2075
- 123,257 · -31.1%
- By 2100
- 96,454 · -46.1%
Race, ethnicity, and origin ACS 2023
- Neighborhood character
- Predominantly White (89%)
- Race & ethnicity
- White 89% Two or more races 5% Black 5% Hispanic / Latino 1%
- Common ancestry
- Serbian 2% Italian 2% Slovak 1%
- Foreign-born
- 0%
Political lean MEDSL · Kanawha
- 2024 margin
- R (+17.4) · D 40.2% · R 57.6% · Other 2.2%
- 2008→2024 swing
- -17.0pp toward R · 2008: -0.4pp · 2024: -17.4pp
- All cycles
- 2024: R+17.4 2020: R+14.7 2016: R+20.6 2012: R+11.9 2008: R+0.4
Not yet ingested
- Civics
- —
Market trends
- HPI YoY
- ▼ -36.96%
- Current HPI
- 185.502
- Rent YoY
- —
- Metro
- —
- State GDP YoY
- —
- F500 in state
- 0
Price history
-24.1% since first listed9 events — show timeline
- 2026-05-14 Pending — KVBOR
- 2026-04-11 Listed $56,900 KVBOR
- 2020-03-12 Sold (Public Records) $105,000 Public Records
- 2020-03-11 Sold (MLS) $105,000 KVBOR
- 2019-08-19 Listed $107,000 KVBOR
- 2014-09-10 Sold (Public Records) $103,000 Public Records
- 2014-09-10 Sold (MLS) $103,000 KVBOR
- 2014-05-05 Listed $110,000 KVBOR
- 2001-07-31 Sold (Public Records) $75,000 Public Records
Property tax history
+2.9%/yrLatest (2025): $868 · +0.0% YoY. Source: county tax records.
Cash-flow waterfall
monthlySold comps — $/sqft
last 12 mo · ≤1 miLoading sold comps…