2219 NW 47th Cir · Ocala, FL
Flood risk 8/10 · Major
- FEMA flood zone
- AH
- Chance of flooding over 30 yrs
- 0.78%
- Est. flood insurance / yr
- $1,142 – $2,507
Fire risk 3/10 · Minor
- Est. fire insurance / yr
- $947 – $1,759
Heat risk 8/10 · Major
- Hot days now (above 107°F)
- 7 days/yr
- Hot days in 30 yrs
- 20 days/yr
Wind risk 9/10 · Severe
- Chance of severe wind over 30 yrs
- 99.0%
Air-quality risk 3/10 · Minor
- Unhealthy air days now
- 3 days/yr
- Unhealthy air days in 30 yrs
- 3 days/yr
Risk factors via First Street. Map © Google.
Why this score? — see what drove the B grade
The composite is a weighted blend of 9 inputs, each scored 0–100. Each bar is that input's sub-score; the figure is the points it added to the 100-point composite (weight × sub-score).
- Cash flow +30.0/30.0
- 1% rule +10.0/10.0
- DSCR +10.0/10.0
- ARV discount +7.5/15.0
- Rent growth +5.0/5.0
- Condition / age +4.0/5.0
- Schools +3.6/10.0
- Livability +3.5/5.0
- Appreciation +0.0/10.0
$59,900
🖨 Deal sheet (PDF) 📄 Offer letter ✓ Due diligence
Listing remarks MLS
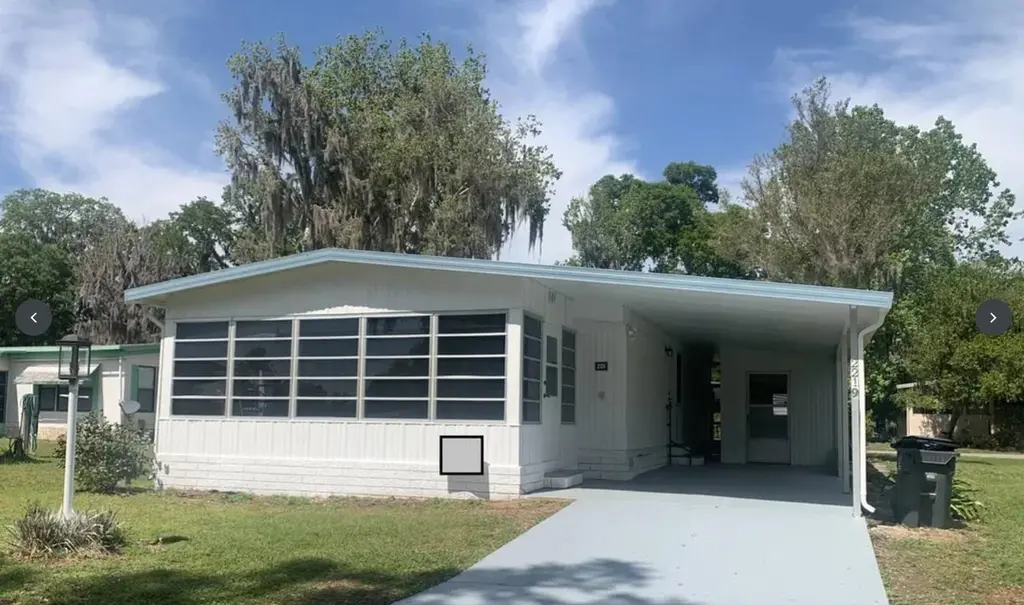
Gorgeous home now offered in the sought after Foxwood Farms community in Ocala. This incredible home has 2 bedrooms, 2 baths. The exterior is well-kept and freshly painted. The 11 x 30 carport with an 8 x 20 utility room with laundry and plenty of storage for all your storage needs. This home is + 960 sq. ft of living space. The Florida room has new carpet flooring with ceiling fan and shades. Foxwood Farms is a beautiful 55+ retirement mobile home community which offers its residents a ton of amenities. The amenities include a fully equipped fitness center, scenic picnic area, well-maintained shuffleboard courts, and two sparkling swimming pools. The low lot rent of $783 includes, water sewer trash and lawn. This pet-friendly located in the tranquil city of Ocala, FL
Key facts
- Picnic area
- Fitness center
- Shuffleboard courts
Tags
Neighborhood map
What this means for you Summary
Snapshot
- This is a 2-bed/2.0-bath manufactured listed at $60k. Condition is rated good.
Deal economics
- At list price, monthly cash flow is $191 ($2k/yr) — positive.
- The deal already cash-flows at list — no discount required.
- Meets the 1% rule at list price ($2k rent vs $60k).
- Recommended offer: $55k (9.0% below list) — sets the bar for market timing.
- Cap rate 13.2% vs local median 4.2% in Ocala — top-decile yield for the area; either an underpriced asset or a hidden risk that comps aren't pricing in. Stress-test before assuming the spread holds.
Location & tenants
- Location reads 69/100 on livability (#476 in FL) — a middle-class / working-renter tenant base. Strengths: cost of living A+, housing A+, health & safety A+; Watch: crime F, amenities F, commute F.
- Marion (rural): math 42% / reading 43% proficiency, ranked #61 of 73 in FL (top 84%) — families likely to look elsewhere, expect single-tenant / working-renter base with shorter leases; 61% free/reduced lunch — lower-income household profile, screen leases tightly.
- Market conditions: Rents rising fast (+11.1%/yr); 663 active listings in the ZIP; 7 comparable units currently listed for rent nearby; rentals at typical pace (median 22d on market — plan ~3-4 weeks tenant-placement turnaround); 7,071 units permitted in Marion County in 2024 (534 in 5+ unit buildings).
- This rent runs 38% of the median local income ($66k/yr) — at the standard rent-burdened threshold; future hikes will face affordability resistance.
Forward outlook
- Local home prices are declining (-3.0%/yr); year-one equity from $414 of loan paydown is wiped out by about $2k of value loss. Plan a longer hold.
- Marion County population projected at +13% by 2050 — modest demand growth; plan on rents tracking national, not racing it.
- At projected returns (-3.0% appreciation + 8.0% rent growth), your $17k cash investment doubles in ~5 years — after that, you're playing with house money.
Negotiation context
- It's been on market 99 days — a 9% lower offer ($55k) is reasonable based on typical stale-listing flexibility.
Risks & watch-outs
- Watch-outs: flood insurance adds $152/mo; HOA is 42% of rent.
- Climate carrying-cost: in FEMA flood zone AH (mandatory federal flood insurance); severe wind risk, 99% chance of damaging wind over 30y; extreme-heat days projected 7→20/yr by 2055 (HVAC capex compounding) — expect insurance premiums to compound above CPI over the hold.
Questions for the listing agent
- It's been on market 99 days. Have you received any prior offers? Is the seller open to a 9% concession, seller financing, or rate buy-down credit?
- What's the actual annual flood-insurance premium (NFIP or private), and is the property in a SFHA with mandatory coverage?
- What does the HOA fee cover, when was the last increase, and are there any pending special assessments or reserve-fund shortfalls?
- Why hasn't it sold? Are there any deal-killer items the seller is aware of (foundation, flood, title, zoning, code violations)?
- Is there a deadline driving the sale (1031 exchange, divorce, estate, relocation)? That informs how much negotiation room exists.
- Crime grade is F in this area — have there been break-ins, vandalism, or insurance claims at this property in the last 3 years? What carrier currently insures it and at what premium?
- What's the average days-on-market for RENTAL listings here right now (not sales)? A rising rental-DOM trend means longer vacancies and softer asking-rent achievability than the comps imply.
- What's the recent tenant-quality profile in this submarket — average credit score on applications, eviction rate, late-payment / NSF rate, and stable-employment percentage? A property-management company in the area should have these aggregated.
- How much new for-sale + rental construction is in the pipeline within 1–3 miles? Heavy new supply typically softens prices + rents 12–24 months out; constrained supply supports both.
Investment metrics
- 1% rule
- 3.46% ✓
- Cap rate
- 13.16%
- Cash-on-cash
- 24.52%
- DSCR
- 2.09
- GRM
- 2.4
CMA / ARV
No comps found within radius.
Projected returns pro-forma
-3.0% appreciation · 8.0% rent growth · sell at horizon
- IRR
- 17.9%
- Equity multiple
- 1.84×
- Total profit
- $14,046
- Equity at exit
- $8,931
- IRR
- 33.2%
- Equity multiple
- 5.79×
- Total profit
- $80,374
- Equity at exit
- $5,179
Cash invested: $16,772 (down + closing). Projections, not guarantees.
Landlord ↔ Tenant lean methodology
- Overall (STATE)
- 87 Strongly Landlord-Friendly
- State Florida
- 87 Strongly Landlord-Friendly · R+3
- County
- — inherits STATE
- City
- — inherits STATE
ZIP-level market 34482
- Rents YoY
- 11.1%
- Active inventory
- 663
- Price-to-rent
- 2.4×
Monthly cashflow live
- Estimated rent
- $2,070 high interval (Pro) →
- Mortgage (P&I)
- −$314
- Tax est. 1.5%
- −$75 /mo · $898/yr
- Insurance
- −$25
- Flood insurance flood zone
- −$152 /mo · $1,824/yr
- HOA
- −$879
- Vacancy / Maint / Mgmt
- −$435
- Net cashflow
- $191
Break-even live
Sensitivity live
| Price | -10% $232 | -5% $211 | +0% $191 | +5% $170 | +10% $149 |
|---|---|---|---|---|---|
| Rent | -10% $27 | -5% $109 | +0% $191 | +5% $272 | +10% $354 |
| Rate | -1.0pp $221 | -0.5pp $206 | base $191 | +0.5pp $175 | +1.0pp $159 |
UW: 25.0% down · 7.5% · 30yr · 1.5% tax · 5.0% vac · 8.0% maint · 8.0% mgmt
Financing live
Cash to close
- Down payment
- $14,975
- Closing costs
- $1,797
- Reserves months
- —
- Total cash needed
- —
Loan-product check · same deal, 3 products live
Conventional
25% down · 7.5% · 30yr
- Down + closing
- —
- Monthly P&I
- —
- Monthly cashflow
- —
- DSCR
- —
- Eligible?
- —
Personal DTI + credit; lowest rate.
DSCR
20% down · 8.5% · 30yr
- Down + closing
- —
- Monthly P&I
- —
- Monthly cashflow
- —
- DSCR
- —
- Eligible?
- —
No personal income docs; deal must DSCR.
Hard money
10% down · 12.0% · 12mo
- Down + closing
- —
- Monthly P&I
- —
- Monthly cashflow
- —
- DSCR
- —
- Eligible?
- —
Short-term bridge; refi at stabilization.
Rent comps 7 comps
| Address | Beds | Baths | Sqft | Rent | $/sqft | DOM | Units | Dist |
|---|---|---|---|---|---|---|---|---|
| 2048 NW 50th Ave Ocala, FL | 2.0 | 2.0 | 1062 | $2,250 | $2.12 | 22d | 1 | 0.31mi |
| 2038 NW 50th Ave Ocala, FL | 2.0 | 2.0 | 1062 | $2,250 | $2.12 | 22d | 1 | 0.32mi |
| 2028 NW 50th Ave Ocala, FL | 2.0 | 2.0 | 1066 | $1,595 | $1.50 | 22d | 1 | 0.32mi |
| 1918 NW 50th Cir Ocala, FL | 2.0 | 2.0 | 1061 | $2,200 | $2.07 | 22d | 1 | 0.38mi |
| 5353 N US Highway 27 Ocala, FL | 1.0–3.0 | 1.0–2.0 | 1169 | $1,785 | $1.53 | 22d | 1 | 0.65mi |
| 5399 NW 18th St Ocala, FL | 2.0 | 2.0 | 1085 | $2,100 | $1.94 | 22d | 1 | 0.70mi |
| 5399 NW 18th St Ocala, FL | 2.0 | 2.0 | 1085 | $2,100 | $1.94 | 14d | 1 | 0.70mi |
HOA detail
- Monthly dues
- $879 · $10,548/yr
- Likely covers
- watersewertrashpoolgym
Listing history 16 events
-
2026-06-18days on market $59,900 Active 99 DOM
-
2026-06-17days on market $59,900 Active 98 DOM
-
2026-06-16days on market $59,900 Active 97 DOM
-
2026-06-15days on market $59,900 Active 96 DOM
-
2026-06-14days on market $59,900 Active 94 DOM
-
2026-06-13days on market $59,900 Active 93 DOM
-
2026-06-10days on market $59,900 Active 91 DOM
-
2026-06-09days on market $59,900 Active 90 DOM
-
2026-06-08days on market $59,900 Active 89 DOM
-
2026-06-07days on market $59,900 Active 88 DOM
-
2026-06-03days on market $59,900 Active 84 DOM
-
2026-06-02days on market $59,900 Active 83 DOM
-
2026-06-01days on market $59,900 Active 82 DOM
-
2026-05-31days on market $59,900 Active 81 DOM
-
2026-05-30days on market $59,900 Active 80 DOM
-
2025-07-01$59,900 Active 778-char remark
Show marketing remark (778 chars)
Gorgeous home now offered in the sought after Foxwood Farms community in Ocala. This incredible home has 2 bedrooms, 2 baths. The exterior is well-kept and freshly painted. The 11 x 30 carport with an 8 x 20 utility room with laundry and plenty of storage for all your storage needs. This home is + 960 sq. ft of living space. The Florida room has new carpet flooring with ceiling fan and shades. Foxwood Farms is a beautiful 55+ retirement mobile home community which offers its residents a ton of amenities. The amenities include a fully equipped fitness center, scenic picnic area, well-maintained shuffleboard courts, and two sparkling swimming pools. The low lot rent of $783 includes, water sewer trash and lawn. This pet-friendly located in the tranquil city of Ocala, FL
ⓘ Source: listings_history table (triggers on properties + properties_extension) + one-shot
backfill from property_details.listing_events for pre-trigger history.
Climate risk First Street
- Flood 8/10 Severe FEMA zone AH · 78% chance over 30 yrs
- Wildfire 3/10 Moderate
- Heat 8/10 Severe 7 d/yr ≥107°F today · 20 d/yr by 30 yrs out
- Wind 9/10 Extreme 99% chance of damaging wind over 30 yrs
- Air quality 3/10 Moderate 3 unhealthy d/yr today · 3 by 30 yrs out
Nearby sold comps map
Loading sold comps map…
Walkable amenities ~0.75 mi
Loading nearby amenities…
Taxation est. · year 1
- Rental income
- $24,846
- − Mortgage interest
- −$3,355
- − Property taxes
- −$898
- − Insurance
- −$2,124
- − Repairs & maintenance
- −$1,988
- − Management
- −$1,988
- − HOA
- −$10,548
- − Depreciation
- −$1,743
- Taxable income
- $2,202
- Est. tax owed @ 24.0%
- −$529
- After-tax cash flow
- $1,760/yr
For passive investors: Depreciation is non-cash, so a rental often shows a tax loss while cash-flowing — sheltering income. Rental losses are passive: they offset passive income freely, and up to $25,000/yr can offset ordinary (W-2) income if you actively participate and your MAGI is under $100k (phasing out to $0 by $150k); unused losses carry forward. On sale, claimed depreciation is recaptured at up to 25%, and gains may owe capital-gains tax (a 1031 exchange can defer both). Figures are a year-1 estimate at your 24.0% rate — not tax advice; consult a CPA.
Condition & rehab AI · 12 photos
This well-maintained mobile home in Foxwood Farms offers a good condition with cosmetic updates to enhance its resale and rental value.
Value-add opportunities
- Both Paint exterior — Fresh paint enhances curb appeal and value
- Both Replace carpet in Florida room — New carpet improves comfort and aesthetics
- Both Upgrade kitchen appliances — Modern appliances increase appeal and functionality
Renovation cost estimate screening
Value-add ROI direction
- Both Paint exterior — Fresh paint enhances curb appeal and value ↑
- Both Replace carpet in Florida room — New carpet improves comfort and aesthetics ↑
- Both Upgrade kitchen appliances — Modern appliances increase appeal and functionality ↑
ⓘ Cost ranges are severity-bucket heuristics (US national rule-of-thumb). Get contractor quotes + a written scope before underwriting a rehab budget.
Schools (NCES district)
- District
- Marion
- NCES district ID
- 1201260
- Math proficiency
- 42% ▼ -7.00%
- Reading proficiency
- 43% ▼ -4.00%
- Median HH income
- $40,015
- Composite
- 35.61/100
- National rank
- #4890
- State rank
- #61 of 73 in FL
Livability — Ocala
- Score
- 69/100
- State rank
- #476
- US rank
- #8461
Category grades
Schools grade is shown separately in the Schools card above.
Census & demographics
- County
- Marion County · 315,796 people
- City population
- 263,375
- Metro
- Ocala, FL
- Population (ZIP)
- 22,807
- Household income
- $65,901
- Rent vs Own
- Severe rent burden
- 282.0
Population outlook (Marion County) Hauer SSP2
- Today (2025)
- 365,905 people
- By 2030
- 376,768 · +3.0%
- By 2040
- 396,555 · +8.4%
- By 2050
- 412,723 · +12.8%
- By 2075
- 446,090 · +21.9%
- By 2100
- 436,193 · +19.2%
Race, ethnicity, and origin ACS 2023
- Neighborhood character
- Majority White (63%)
- Race & ethnicity
- White 63% Hispanic / Latino 19% Black 14% Two or more races 12%
- Hispanic origin (detail)
- Mexican 6% Puerto Rican 9% Cuban 2%
- Common ancestry
- Lithuanian 2% Romanian 2% Slovak 2%
- Foreign-born
- 10% · Canada
- Languages at home
- 81% English-only · Spanish 16% Other Indo-European 1%
Political lean MEDSL · Marion
- 2024 margin
- Solid R (+31.6) · D 33.8% · R 65.5%
- 2008→2024 swing
- -20.0pp toward R · 2008: -11.6pp · 2024: -31.6pp
- All cycles
- 2024: R+31.6 2020: R+25.9 2016: R+26.2 2012: R+16.2 2008: R+11.6
Not yet ingested
- Civics
- —
Market trends
- HPI YoY
- ▼ -133.62%
- Current HPI
- 194.3857
- Rent YoY
- ▲ 11.12%
- Metro
- Ocala, FL
- State GDP YoY
- ▲ 3.28%
- F500 in state
- 36
Industry mix (Fortune 500 HQ in FL)
| Industry | F500 HQs | Revenue |
|---|---|---|
| Industrial Technology | 2 | $29B |
|
||
| Insurance | 2 | $17B |
|
||
| Retail | 1 | $60B |
|
||
| Technology Distribution | 1 | $58B |
|
||
| Homebuilding | 1 | $35B |
|
||
| Technology Manufacturing | 1 | $35B |
|
||
Price history
1 event — show timeline
- 2025-07-01 Listed $59,900 Beaches MLS
Cash-flow waterfall
monthlySold comps — $/sqft
last 12 mo · ≤1 miLoading sold comps…