 Duplex
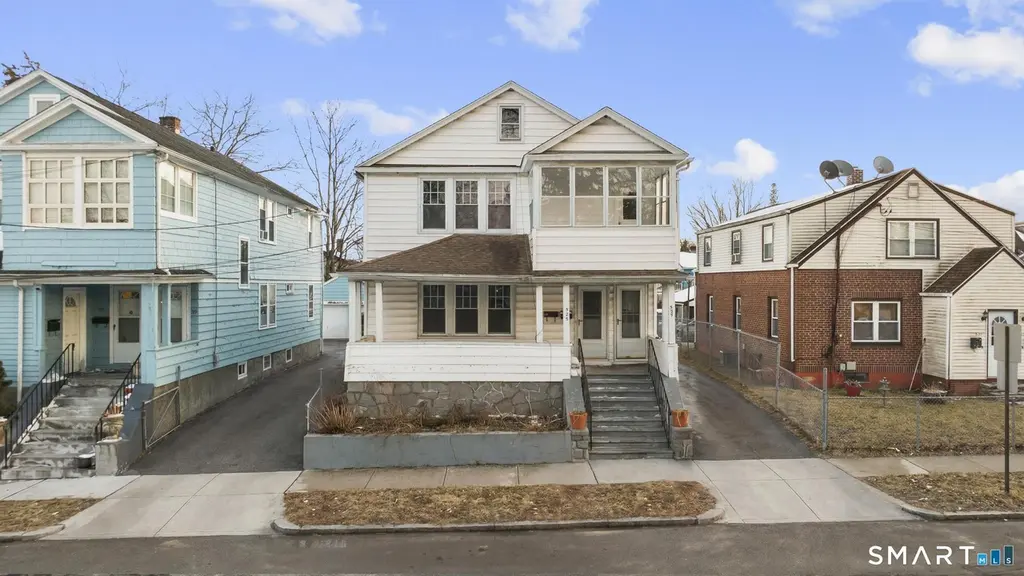
525 Westfield Ave · Bridgeport, CT
Flood risk 1/10 · Minimal
- FEMA flood zone
- X (unshaded)
- Chance of flooding over 30 yrs
- 0.0%
- Est. flood insurance / yr
- $473 – $860
Fire risk 1/10 · Minimal
- Est. fire insurance / yr
- $829 – $1,539
Heat risk 6/10 · Moderate
- Hot days now (above 97°F)
- 7 days/yr
- Hot days in 30 yrs
- 15 days/yr
Wind risk 6/10 · Moderate
- Chance of severe wind over 30 yrs
- 41.0%
Air-quality risk 4/10 · Minor
- Unhealthy air days now
- 5 days/yr
- Unhealthy air days in 30 yrs
- 7 days/yr
Risk factors via First Street. Map © Google.
Why this score? — see what drove the D+ grade
The composite is a weighted blend of 9 inputs, each scored 0–100. Each bar is that input's sub-score; the figure is the points it added to the 100-point composite (weight × sub-score).
- Cash flow +15.4/30.0
- ARV discount +11.2/15.0
- DSCR +4.8/10.0
- 1% rule +4.2/10.0
- Livability +4.0/5.0
- Rent growth +3.3/5.0
- Condition / age +2.5/5.0
- Schools +1.2/10.0
- Appreciation +0.0/10.0
$569,900
🖨 Deal sheet (PDF) 📄 Offer letter ✓ Due diligence
Multi-family units
County records classify this as Multi-Family (2-4 Unit). Listing-text estimate: 2 units. confirmed
Listing remarks
Ready for its next owner, 525 Westfield St in Bridgeport presents a fantastic opportunity for both investors and owner-occupants alike. This well-maintained two-family home offers over 1,000 square feet in each unit, featuring spacious layouts with comfortable living and dining areas. Both units have been recently refreshed with updated flooring, fresh paint, bathroom improvements, and additional cosmetic upgrades, creating a clean, move-in ready feel throughout. The property stands out with major recent improvements, including two brand new gas furnaces and electrical updates panels, delivering long-term efficiency and reducing future capital expenses. Additional features include a detache
Key facts
- Fresh paint
- Electrical updates
- Two family home
Tags
Neighborhood map
What this means for you Summary
Snapshot
- This is a 2 × 2-bed/1.0-bath units multifamily listed at $570k.
Deal economics
- At list price, monthly cash flow is $224 ($3k/yr) — positive. Per door: $112/mo.
- The deal already cash-flows at list — no discount required.
- To meet the 1% rule (rent ≥ 1% of price), the offer needs to be $527k (7.5% below list).
- Recommended offer: $527k (7.5% below list) — sets the bar for 1% rule.
- Cap rate 6.8% vs local median 5.0% in Bridgeport — top-decile yield for the area; either an underpriced asset or a hidden risk that comps aren't pricing in. Stress-test before assuming the spread holds.
Location & tenants
- Location reads 81/100 on livability (#15 in CT, #1,374 nationally) — a professional / high-income tenant draw. Strengths: amenities A+, commute A+, health & safety A+; Watch: crime C-, employment D+, schools D-.
- Bridgeport School District (urban): math 9% / reading 19% proficiency, ranked #151 of 153 in CT (top 99%) — low school quality limits family demand, transient renter base, plan for 1-2y turnover; 97% free/reduced lunch — lower-income household profile, screen leases tightly.
- Market conditions: Rents rising (+3.1%/yr); 152 active listings in the ZIP; 20 comparable units currently listed for rent nearby; rentals lingering (median 46d on market — plan ~5-8 weeks vacancy on turnover, expect pricing pressure); 60% of comp listings sitting > 30 days — soft ceiling on asking rent; 852 units permitted in Greater Bridgeport Planning Region in 2024 (698 in 5+ unit buildings).
- At $5,271/mo this rent would consume 86% of the median local household income ($73k/yr) (locally 2163% of renters already pay >50% of income on rent) — very limited rent-growth headroom before tenants either downsize or default.
Forward outlook
- Local home prices are declining (-3.0%/yr); year-one equity from $4k of loan paydown is wiped out by about $17k of value loss. Plan a longer hold.
Negotiation context
- Only 7 days on market — expect competitive offers; lowballing is unlikely to land.
- 2 sale attempts with the ask held roughly flat each time — persistent listings suggest the price (not the market) is what's stuck; bring a comps-based counter.
- Current owner paid $148k; list at $570k implies a 286% gain — meaningful room to come down on a strong offer.
Risks & watch-outs
- Watch-outs: built in 1932 — expect roof / HVAC / electrical / plumbing capex.
- Climate carrying-cost: major wind risk, 41% chance of damaging wind over 30y; extreme-heat days projected 7→15/yr by 2055 (HVAC capex compounding) — expect insurance premiums to compound above CPI over the hold.
Questions for the listing agent
- Can we see the unit-by-unit rent roll, current vacancy, and any below-market leases? What's the average tenancy length?
- What capital expenditures (roof, boiler, parking lot, exteriors) have been made in the last 5 years, and what's planned in the next 2?
- Built in 1932 — when were the roof, HVAC, electrical panel, plumbing, and water heater last replaced?
- Is there a deadline driving the sale (1031 exchange, divorce, estate, relocation)? That informs how much negotiation room exists.
- Schools are D-rated, which usually means shorter tenancies and higher turnover. Who's the typical renter profile here, and what's been the actual vacancy rate?
- The area grade is low — what's the realistic commute time and amenity access for the typical tenant pool here? Any planned neighborhood developments (good or bad) we should know about?
- What's the average days-on-market for RENTAL listings here right now (not sales)? A rising rental-DOM trend means longer vacancies and softer asking-rent achievability than the comps imply.
- What's the recent tenant-quality profile in this submarket — average credit score on applications, eviction rate, late-payment / NSF rate, and stable-employment percentage? A property-management company in the area should have these aggregated.
- How much new apartment / multifamily construction is in the pipeline within 1–3 miles? Heavy new supply (>2% of stock underway) typically softens rents 12–24 months out; light construction supports rent growth.
Investment metrics
- 1% rule
- 0.92% ✗
- Cap rate
- 6.77%
- Cash-on-cash
- 1.69%
- DSCR
- 1.08
- GRM
- 9.0
CMA / ARV
- ARV (on-the-fly)
- $621,621
- Comps found
- 5
Show comp detail 5 sales within ~0.75 mi
| Address | Dist | Beds/Ba | Sqft | Sold | Price | $/sf | Match |
|---|---|---|---|---|---|---|---|
| 525 Westfield Ave | 0.00mi | 4/2.0 | 3,003 (0%) | 1mo | $535,000 | $178 | 100 |
| 77 Alexander Ave | 0.27mi | 5/2.0 (+1) | 2,800 (-7%) | 18mo | $585,000 | $209 | 57 |
| 22 Wayne St | 0.44mi | 5/3.0 (+1) | 3,171 (+6%) | 22mo | $655,000 | $207 | 43 |
| 167 Hawley Ave | 0.72mi | 5/3.0 (+1) | 2,851 (-5%) | 20mo | $650,000 | $228 | 33 |
| 448 Exeter St | 0.73mi | 5/3.0 (+1) | 3,093 (+3%) | 24mo | $585,000 | $189 | 32 |
Match score weights: distance 35% · size 25% · config 20% · recency 20%. Top-matched comps best support the ARV.
Projected returns pro-forma
-3.0% appreciation · 3.12% rent growth · sell at horizon
- IRR
- -13.5%
- Equity multiple
- 0.52×
- Total profit
- $-77,347
- Equity at exit
- $84,974
- IRR
- -4.3%
- Equity multiple
- 0.71×
- Total profit
- $-46,013
- Equity at exit
- $49,275
Cash invested: $159,572 (down + closing). Projections, not guarantees.
Landlord ↔ Tenant lean methodology
- Overall (STATE)
- 27 Tenant-Leaning
- State Connecticut
- 27 Tenant-Leaning · D+7
- County
- — inherits STATE
- City
- — inherits STATE
ZIP-level market 06606
- Rents YoY
- 3.1%
- Active inventory
- 152
- Price-to-rent
- 18.0×
Monthly cashflow live
- Estimated rent
- $5,271 high interval (Pro) →
- Mortgage (P&I)
- −$2,989
- Tax from tax record
- −$714 /mo · $8,565/yr
- Insurance
- −$237
- HOA
- −$0
- Vacancy / Maint / Mgmt
- −$1,107
- Net cashflow
- $224
Break-even live
Sensitivity live
| Price | -10% $547 | -5% $386 | +0% $224 | +5% $63 | +10% $-98 |
|---|---|---|---|---|---|
| Rent | -10% $-192 | -5% $16 | +0% $224 | +5% $432 | +10% $641 |
| Rate | -1.0pp $511 | -0.5pp $369 | base $224 | +0.5pp $77 | +1.0pp $-74 |
2-unit breakdown (identical units grouped — click to expand)
| Units | Beds | Baths | Est. rent |
|---|---|---|---|
| 2× units | 2 | 1 | $5,272 |
| #1 | 2 | 1 | $2,636 |
| #2 | 2 | 1 | $2,636 |
| Total (2 units) | $5,271 | ||
UW: 25.0% down · 7.5% · 30yr · 1.5% tax · 5.0% vac · 8.0% maint · 8.0% mgmt
Financing live
Cash to close
- Down payment
- $142,475
- Closing costs
- $17,097
- Reserves months
- —
- Total cash needed
- —
Loan-product check · same deal, 3 products live
Conventional
25% down · 7.5% · 30yr
- Down + closing
- —
- Monthly P&I
- —
- Monthly cashflow
- —
- DSCR
- —
- Eligible?
- —
Personal DTI + credit; lowest rate.
DSCR
20% down · 8.5% · 30yr
- Down + closing
- —
- Monthly P&I
- —
- Monthly cashflow
- —
- DSCR
- —
- Eligible?
- —
No personal income docs; deal must DSCR.
Hard money
10% down · 12.0% · 12mo
- Down + closing
- —
- Monthly P&I
- —
- Monthly cashflow
- —
- DSCR
- —
- Eligible?
- —
Short-term bridge; refi at stabilization.
Rent comps 20 comps
| Address | Beds | Baths | Sqft | Rent | $/sqft | DOM | Units | Dist |
|---|---|---|---|---|---|---|---|---|
| 67 Tremont Ave Unit 1 Bridgeport, CT | 4.0 | 1.0 | 4250 | $3,600 | $0.85 | 45d | 1 | 0.20mi |
| 67 Tremont Ave Bridgeport, CT | 4.0 | 1.0 | 4114 | $3,500 | $0.85 | 45d | 1 | 0.20mi |
| 254 Wayne St Bridgeport, CT | 4.0 | 2.0 | 3651 | $2,975 | $0.81 | 45d | 1 | 0.29mi |
| 183 Harlem Ave Unit 1 Bridgeport, CT | 3.0 | 1.0 | 2980 | $2,400 | $0.81 | 25d | 1 | 0.30mi |
| 125 High Ridge Dr Bridgeport, CT | 4.0 | 1.5 | 2160 | $3,400 | $1.57 | 4d | 1 | 0.50mi |
| 40 Bronx Ave Unit 3 Bridgeport, CT | 3.0 | 1.0 | 3705 | $2,600 | $0.70 | 45d | 1 | 0.52mi |
| 294 Garfield Ave Unit 2 Bridgeport, CT | 3.0 | 1.0 | 3202 | $2,300 | $0.72 | 5d | 1 | 0.64mi |
| 824 Capitol Ave Unit 2 Bridgeport, CT | 3.0 | 1.0 | 3520 | $2,500 | $0.71 | 45d | 1 | 0.68mi |
| 100 Garfield Ave Unit 2 Bridgeport, CT | 3.0 | 1.0 | 3184 | $1,900 | $0.60 | 5d | 1 | 0.70mi |
| 765 Hart St Bridgeport, CT | 4.0 | 2.5 | 2730 | $4,600 | $1.68 | 45d | 1 | 0.76mi |
| 22 Infield St Unit 22 Bridgeport, CT | 3.0 | 2.5 | 2688 | $3,500 | $1.30 | 5d | 1 | 0.90mi |
| 191 Parrott Ave Unit 1 Bridgeport, CT | 3.0 | 1.0 | 2662 | $2,000 | $0.75 | 45d | 1 | 0.94mi |
| 574 Chopsey Hill Rd Unit A Bridgeport, CT | 3.0 | 2.0 | 2304 | $2,800 | $1.22 | 16d | 1 | 1.00mi |
| 69 Platt Pl Bridgeport, CT | 3.0 | 3.5 | 2376 | $4,400 | $1.85 | 4d | 1 | 1.16mi |
| 1566 North Ave Bridgeport, CT | 5.0 | 1.0 | 2837 | $2,500 | $0.88 | 45d | 1 | 1.25mi |
| 275 Lexington Ave Unit 2nd Bridgeport, CT | 3.0 | 1.0 | 4187 | $2,000 | $0.48 | 45d | 1 | 1.27mi |
| 1688 North Ave Bridgeport, CT | 3.0 | 1.0 | 3955 | $2,500 | $0.63 | 45d | 1 | 1.31mi |
| 115 Oak St Unit 1 Bridgeport, CT | 3.0 | 1.0 | 3522 | $2,200 | $0.62 | 45d | 1 | 1.33mi |
| 61 Villa Ave Fairfield, CT | 3.0 | 2.5 | 2246 | $4,200 | $1.87 | 23d | 1 | 1.37mi |
| 70 Hawthorne St Bridgeport, CT | 3.0 | 1.5 | 2376 | $3,500 | $1.47 | 45d | 1 | 1.45mi |
Listing history 6 events
-
2026-04-28status Under Contract
-
2026-04-21$569,900 Active
-
2026-04-13historical
-
2026-03-02price $589,900
-
2026-02-05$599,900 Active
-
1991-11-27soldstatus $147,500
ⓘ Source: listings_history table (triggers on properties + properties_extension) + one-shot
backfill from property_details.listing_events for pre-trigger history.
Tax reassessment forecast CT · Partial reset (capped growth)
- Current annual tax
- $8,565 · $714/mo
- Projected year-2 tax
- $10,380 · $865/mo
- Expected delta
- +$1,815/yr (+$151/mo · 21.2%)
ⓘ Screening estimate from a state-policy table — verify with the county assessor before closing.
Climate risk First Street
- Flood 1/10 Low FEMA zone X (unshaded) · 0% chance over 30 yrs
- Wildfire 1/10 Low
- Heat 6/10 Major 7 d/yr ≥97°F today · 15 d/yr by 30 yrs out
- Wind 6/10 Major 41% chance of damaging wind over 30 yrs
- Air quality 4/10 Moderate 5 unhealthy d/yr today · 7 by 30 yrs out
Nearby sold comps map
Loading sold comps map…
Walkable amenities ~0.75 mi
Loading nearby amenities…
Taxation est. · year 1
- Rental income
- $63,252
- − Mortgage interest
- −$31,923
- − Property taxes
- −$8,565
- − Insurance
- −$2,850
- − Repairs & maintenance
- −$5,060
- − Management
- −$5,060
- − Depreciation
- −$16,579
- Taxable loss
- −$6,785
- Est. tax savings @ 24.0%
- +$1,628
- After-tax cash flow
- $4,320/yr
For passive investors: Depreciation is non-cash, so a rental often shows a tax loss while cash-flowing — sheltering income. Rental losses are passive: they offset passive income freely, and up to $25,000/yr can offset ordinary (W-2) income if you actively participate and your MAGI is under $100k (phasing out to $0 by $150k); unused losses carry forward. On sale, claimed depreciation is recaptured at up to 25%, and gains may owe capital-gains tax (a 1031 exchange can defer both). Figures are a year-1 estimate at your 24.0% rate — not tax advice; consult a CPA.
Schools (NCES district)
- District
- Bridgeport School District
- NCES district ID
- 0900450
- Math proficiency
- 9% ▼ -7.00%
- Reading proficiency
- 19% ▼ -10.00%
- Median HH income
- $41,507
- Composite
- 12.09/100
- National rank
- #9656
- State rank
- #151 of 153 in CT
Livability — Bridgeport
- Score
- 81/100
- State rank
- #15
- US rank
- #1374
Category grades
Schools grade is shown separately in the Schools card above.
Census & demographics
- Census place
- Bridgeport, CT
- County
- Fairfield County · 765,532 people
- City population
- 149,153
- Metro
- Bridgeport-Stamford-Norwalk, CT
- Population (ZIP)
- 49,308
- Household income
- $73,372
- Rent vs Own
- Severe rent burden
- 2163.0
Population outlook (Greater Bridgeport County) Hauer SSP2
- By 2040
- 365,581
Race, ethnicity, and origin ACS 2023
- Neighborhood character
- Highly diverse neighborhood (Simpson 0.73)
- Race & ethnicity
- Hispanic / Latino 37% White 31% Black 19% Two or more races 11% Asian 7%
- Hispanic origin (detail)
- Mexican 5% Puerto Rican 12% Dominican 4%
- Common ancestry
- Estonian 5% Russian 4% Romanian 3%
- Foreign-born
- 37% · Canada, Jamaica, Vietnam
- Languages at home
- 50% English-only · Spanish 27% Other Indo-European 15% French/Haitian/Cajun 2%
Political lean MEDSL · Greater Bridgeport
- 2024 margin
- Strong D (+23.3) · D 60.9% · R 37.6% · Other 1.5%
- All cycles
- 2024: D+23.3
Not yet ingested
- Civics
- —
Market trends
- HPI YoY
- ▼ -270.11%
- Current HPI
- 345.647
- Rent YoY
- ▲ 3.12%
- Metro
- Bridgeport-Stamford-Norwalk, CT
- State GDP YoY
- ▲ 1.06%
- F500 in state
- 38
Industry mix (Fortune 500 HQ in CT)
| Industry | F500 HQs | Revenue |
|---|---|---|
| Industrial Machinery | 4 | $38B |
|
||
| Insurance | 3 | $71B |
|
||
| Financial Services | 2 | $25B |
|
||
| Transportation / Logistics | 2 | $18B |
|
||
| Healthcare | 1 | $247B |
|
||
| Telecommunications | 1 | $55B |
|
||
Price history
+286.4% since first listed6 events — show timeline
- 2026-04-28 Pending — Smart MLS
- 2026-04-21 Listed $569,900 Smart MLS
- 2026-04-13 Listing Removed — Smart MLS
- 2026-03-02 Price Changed $589,900 Smart MLS
- 2026-02-05 Listed $599,900 Smart MLS
- 1991-11-27 Sold (Public Records) $147,500 Public Records
Property tax history
+0.5%/yrLatest (2023): $8,565 · +0.0% YoY. Source: county tax records.
Cash-flow waterfall
monthlySold comps — $/sqft
last 12 mo · ≤1 miLoading sold comps…