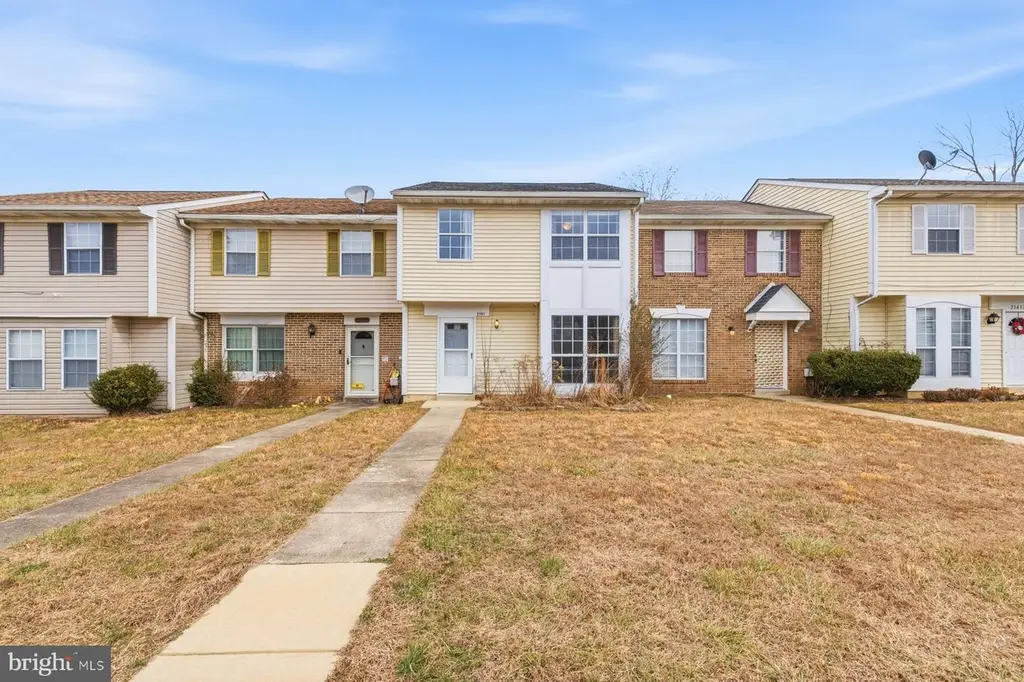
21421 Manon Way · California, MD
Flood risk 1/10 · Minimal
- FEMA flood zone
- X (unshaded)
- Chance of flooding over 30 yrs
- 0.0%
- Est. flood insurance / yr
- $507 – $1,088
Fire risk 4/10 · Minor
- Est. fire insurance / yr
- $755 – $1,403
Heat risk 9/10 · Severe
- Hot days now (above 101°F)
- 7 days/yr
- Hot days in 30 yrs
- 18 days/yr
Wind risk 6/10 · Moderate
- Chance of severe wind over 30 yrs
- 60.0%
Air-quality risk 2/10 · Minimal
- Unhealthy air days now
- 1 days/yr
- Unhealthy air days in 30 yrs
- 2 days/yr
Risk factors via First Street. Map © Google.
Why this score? — see what drove the D+ grade
The composite is a weighted blend of 9 inputs, each scored 0–100. Each bar is that input's sub-score; the figure is the points it added to the 100-point composite (weight × sub-score).
- Cash flow +17.2/30.0
- ARV discount +6.6/15.0
- DSCR +5.4/10.0
- 1% rule +4.0/10.0
- Livability +3.7/5.0
- Appreciation +3.2/10.0
- Schools +3.0/10.0
- Rent growth +2.6/5.0
- Condition / age +2.5/5.0
$239,900
🖨 Deal sheet 📄 Offer letter ✓ Due diligence
Listing remarks MLS
AMAZING opportunity to buy a starter home or investment in the Westbury Townhome community! This beautiful 3 bedroom 1 full and 1 half bathroom townhome has a brand new roof, new flooring and paint throughout, updated kitchen and is FULLY FURNISHED. Eat-in kitchen over looking fenced in backyard and large deck! Over 1200 sq ft of living space in a community that features sidewalks and a pool. Purchasing unfurnished is an option, however seller would prefer to leave furnished! PROFESSIONAL INTERIOR PHOTOS COMING 9/6/2022
Key facts
- $13 HOA
- Built 1989
- Listed 15 days
Property features AI
Finance
- HOA & community: HOA fee of $40 annually
Exterior
- Parking: On-street parking
- Utilities: Public water; Public sewer; Electric service for heating, cooling fuel, and hot water
- Home design: End of row townhouse; Fee simple ownership; Effective major renovation year listed as 2025
- Construction: Block construction; Permanent foundation; Assessor indicates year built/effective 2025
- Exterior features: Not in a federal flood zone; Tidal water not present; Above-grade and below-grade structures noted
Interior
- Kitchen: Built-in microwave; Microwave; Dishwasher; Refrigerator
- Bedrooms: Three bedrooms on the first upper level
- Flooring: Luxury vinyl plank
- Bathrooms: One full bathroom on the first upper level; One half bathroom on the main level
- Heating & cooling: Heat pump(s); Electric heating fuel; Electric hot water; Electric cooling fuel (other cooling type)
- Interior features: No basement; Assessor-listed living area source
- Laundry & utility: Washer; Dryer; Laundry area (in unit)
Neighborhood map
What this means for you Summary
Snapshot
- This is a 3-bed/1.5-bath townhouse listed at $240k.
Deal economics
- At list price, monthly cash flow is $170 ($2k/yr) — positive.
- The deal already cash-flows at list — no discount required.
- To meet the 1% rule (rent ≥ 1% of price), the offer needs to be $216k (9.9% below list).
- Recommended offer: $216k (9.9% below list) — sets the bar for 1% rule.
- Cap rate 7.1% vs local median 4.3% in California — top-decile yield for the area; either an underpriced asset or a hidden risk that comps aren't pricing in. Stress-test before assuming the spread holds.
Location & tenants
- Location reads 73/100 on livability (#127 in MD) — a middle-class / working-renter tenant base. Strengths: employment A+, housing A+, health & safety A+; Watch: crime D+, amenities F, commute F.
- St. Mary'S County Public Schools (rural): math 23% / reading 38% proficiency, ranked #8 of 24 in MD (top 33%) — families likely to look elsewhere, expect single-tenant / working-renter base with shorter leases.
- Market conditions: Rents flat; 91 active listings in the ZIP; solid renter incomes; 265 units permitted in St. Mary's County in 2024 (0 in 5+ unit buildings).
Forward outlook
- Local home prices are declining (-3.0%/yr); year-one equity from $2k of loan paydown is wiped out by about $7k of value loss. Plan a longer hold.
- St. Mary's County population projected at +16% by 2050 — long-run rental-demand tailwind backs the buy-and-hold thesis.
Negotiation context
- It's been on market 16 days — a 2% lower offer ($236k) is reasonable based on typical stale-listing flexibility.
- 12 sale attempts since 23y ago; this cycle's ask has dropped $20k (8%) from the opening price — seller is motivated, your offer sets the floor, not the list.
- Current owner paid $200k; 20% above their basis — modest negotiation headroom, anchor on the comps not their cost.
Risks & watch-outs
- Climate carrying-cost: major wind risk, 60% chance of damaging wind over 30y; extreme-heat days projected 7→18/yr by 2055 (HVAC capex compounding) — expect insurance premiums to compound above CPI over the hold.
Questions for the listing agent
- What does the HOA fee cover, when was the last increase, and are there any pending special assessments or reserve-fund shortfalls?
- Is there a deadline driving the sale (1031 exchange, divorce, estate, relocation)? That informs how much negotiation room exists.
- Crime grade is D in this area — have there been break-ins, vandalism, or insurance claims at this property in the last 3 years? What carrier currently insures it and at what premium?
- The area grade is low — what's the realistic commute time and amenity access for the typical tenant pool here? Any planned neighborhood developments (good or bad) we should know about?
- What's the average days-on-market for RENTAL listings here right now (not sales)? A rising rental-DOM trend means longer vacancies and softer asking-rent achievability than the comps imply.
- What's the recent tenant-quality profile in this submarket — average credit score on applications, eviction rate, late-payment / NSF rate, and stable-employment percentage? A property-management company in the area should have these aggregated.
- How much new for-sale + rental construction is in the pipeline within 1–3 miles? Heavy new supply typically softens prices + rents 12–24 months out; constrained supply supports both.
Investment metrics
- 1% rule
- 0.90% ✗
- Cap rate
- 7.14%
- Cash-on-cash
- 3.04%
- DSCR
- 1.14
- GRM
- 9.2
CMA / ARV
- ARV (on-the-fly)
- $235,246
- Comps found
- 12
Show comp detail 12 sales within ~0.75 mi
| Address | Dist | Beds/Ba | Sqft | Sold | Price | $/sf | Match |
|---|---|---|---|---|---|---|---|
| 46074 Callas Way | 0.08mi | 3/2.5 | 1,302 (+4%) | 6mo | $255,000 | $196 | 81 |
| 46091 Maria Way | 0.07mi | 3/2.0 | 1,160 (-8%) | 10mo | $232,000 | $200 | 74 |
| 46099 Lucca Way | 0.08mi | 2/1.5 (-1) | 1,240 (-1%) | 23mo | $206,000 | $166 | 70 |
| 46072 Callas Way | 0.08mi | 2/2.5 (-1) | 1,248 (-1%) | 23mo | $236,000 | $189 | 67 |
| 46281 Mako Way | 0.54mi | 3/1.5 | 1,280 (+2%) | 7mo | $239,400 | $187 | 66 |
| 46099 Maria Way | 0.09mi | 3/1.5 | 1,160 (-8%) | 24mo | $147,500 | $127 | 63 |
| 46289 Mako Way | 0.54mi | 3/1.5 | 1,200 (-5%) | 9mo | $260,000 | $217 | 60 |
| 46262 Mako Way | 0.53mi | 3/1.5 | 1,280 (+2%) | 22mo | $200,000 | $156 | 54 |
| 46279 Mako Way | 0.53mi | 3/1.5 | 1,280 (+2%) | 24mo | $195,000 | $152 | 52 |
| 46359 Columbus Dr | 0.71mi | 3/1.5 | 1,164 (-8%) | 7mo | $215,000 | $185 | 48 |
| 46351 Columbus Dr #207 | 0.71mi | 2/1.5 (-1) | 1,114 (-11%) | 2mo | $228,145 | $205 | 41 |
| 46361 Columbus Dr #107 | 0.74mi | 2/1.5 (-1) | 1,114 (-11%) | 22mo | $199,900 | $179 | 23 |
Match score weights: distance 35% · size 25% · config 20% · recency 20%. Top-matched comps best support the ARV.
Projected returns pro-forma
-3.0% appreciation · 0.49% rent growth · sell at horizon
- IRR
- -14.2%
- Equity multiple
- 0.50×
- Total profit
- $-33,414
- Equity at exit
- $35,770
- IRR
- -9.8%
- Equity multiple
- 0.46×
- Total profit
- $-36,109
- Equity at exit
- $20,742
Cash invested: $67,172 (down + closing). Projections, not guarantees.
Landlord ↔ Tenant lean methodology
- Overall (STATE)
- 27 Tenant-Leaning
- State Maryland
- 27 Tenant-Leaning · D+14
- County
- — inherits STATE
- City
- — inherits STATE
ZIP-level market 20653
- Home prices YoY
- -1.4%
- Rents YoY
- 0.5%
- Active inventory
- 91
- Price-to-rent
- 9.2×
Monthly cashflow live
- Estimated rent
- $2,162 medium interval (Pro) →
- Mortgage (P&I)
- −$1,258
- Tax from tax record
- −$167 /mo · $2,008/yr
- Insurance
- −$100
- HOA
- −$13
- Vacancy / Maint / Mgmt
- −$454
- Net cashflow
- $170
Break-even live
UW: 25.0% down · 7.5% · 30yr · 1.5% tax · 5.0% vac · 8.0% maint · 8.0% mgmt
Financing live
Cash to close
- Down payment
- $59,975
- Closing costs
- $7,197
- Reserves months
- —
- Total cash needed
- —
Loan-product check · same deal, 3 products live
Conventional
25% down · 7.5% · 30yr
- Down + closing
- —
- Monthly P&I
- —
- Monthly cashflow
- —
- DSCR
- —
- Eligible?
- —
Personal DTI + credit; lowest rate.
DSCR
20% down · 8.5% · 30yr
- Down + closing
- —
- Monthly P&I
- —
- Monthly cashflow
- —
- DSCR
- —
- Eligible?
- —
No personal income docs; deal must DSCR.
Hard money
10% down · 12.0% · 12mo
- Down + closing
- —
- Monthly P&I
- —
- Monthly cashflow
- —
- DSCR
- —
- Eligible?
- —
Short-term bridge; refi at stabilization.
HOA detail
- Monthly dues
- $13 · $156/yr
- Likely covers
- pool
Listing history 50 events
-
2026-06-19days on market $239,900 Active 16 DOM
-
2026-06-18days on market $239,900 Active 15 DOM
-
2026-06-17days on market $239,900 Active 14 DOM
-
2026-06-16days on market $239,900 Active 13 DOM
-
2026-06-15days on market $239,900 Active 12 DOM
-
2026-06-14days on market $239,900 Active 10 DOM
-
2026-06-12days on market $239,900 Active 9 DOM
-
2026-06-09days on market $239,900 Active 6 DOM
-
2026-06-08days on market $239,900 Active 5 DOM
-
2026-06-07days on market $239,900 Active 4 DOM
-
2026-06-05remarks 414-char remark
-
2026-06-05pricedays on market $239,900 Active 1 DOM
-
2026-06-02days on market $249,900 Active 94 DOM
-
2026-06-01days on market $249,900 Active 93 DOM
-
2026-05-31days on market $249,900 Active 92 DOM
-
2026-05-30days on market $249,900 Active 91 DOM
-
2026-05-20status Active
-
2026-04-06status Pending
-
2026-03-31price $249,900
-
2026-01-15$259,900 Active
-
2025-07-28historical
-
2025-05-22price $240,000
-
2025-05-22historical Active Under Contract
-
2025-05-19price $230,000
-
2025-04-04$235,000 Active
-
2025-03-26historical
-
2022-11-15soldstatus $200,000
-
2022-10-25soldstatus $200,000 Closed 528-char remark
Show marketing remark (528 chars)
AMAZING opportunity to buy a starter home or investment in the Westbury Townhome community! This beautiful 3 bedroom 1 full and 1 half bathroom townhome has a brand new roof, new flooring and paint throughout, updated kitchen and is FULLY FURNISHED. Eat-in kitchen over looking fenced in backyard and large deck! Over 1200 sq ft of living space in a community that features sidewalks and a pool. Purchasing unfurnished is an option, however seller would prefer to leave furnished! PROFESSIONAL INTERIOR PHOTOS COMING 9/6/2022
-
2022-10-04historical Active Under Contract 528-char remark
Show marketing remark (528 chars)
AMAZING opportunity to buy a starter home or investment in the Westbury Townhome community! This beautiful 3 bedroom 1 full and 1 half bathroom townhome has a brand new roof, new flooring and paint throughout, updated kitchen and is FULLY FURNISHED. Eat-in kitchen over looking fenced in backyard and large deck! Over 1200 sq ft of living space in a community that features sidewalks and a pool. Purchasing unfurnished is an option, however seller would prefer to leave furnished! PROFESSIONAL INTERIOR PHOTOS COMING 9/6/2022
-
2022-09-04$210,000 Active 528-char remark
Show marketing remark (528 chars)
AMAZING opportunity to buy a starter home or investment in the Westbury Townhome community! This beautiful 3 bedroom 1 full and 1 half bathroom townhome has a brand new roof, new flooring and paint throughout, updated kitchen and is FULLY FURNISHED. Eat-in kitchen over looking fenced in backyard and large deck! Over 1200 sq ft of living space in a community that features sidewalks and a pool. Purchasing unfurnished is an option, however seller would prefer to leave furnished! PROFESSIONAL INTERIOR PHOTOS COMING 9/6/2022
-
2022-09-03historical $210,000 528-char remark
Show marketing remark (528 chars)
AMAZING opportunity to buy a starter home or investment in the Westbury Townhome community! This beautiful 3 bedroom 1 full and 1 half bathroom townhome has a brand new roof, new flooring and paint throughout, updated kitchen and is FULLY FURNISHED. Eat-in kitchen over looking fenced in backyard and large deck! Over 1200 sq ft of living space in a community that features sidewalks and a pool. Purchasing unfurnished is an option, however seller would prefer to leave furnished! PROFESSIONAL INTERIOR PHOTOS COMING 9/6/2022
-
2022-01-10soldstatus $169,900
-
2021-12-15soldstatus $169,900 Closed
-
2021-10-27status Pending
-
2021-10-23price $169,900
-
2021-10-15price $174,900
-
2021-10-01$179,900 Active
-
2014-06-10soldstatus $139,000
-
2014-05-29soldstatus $139,000
-
2014-05-29soldstatus $139,000 Sold
-
2014-04-04status Contingent (No Kick Out)
-
2014-04-03historical
-
2014-01-13price $139,900
-
2013-10-25$145,000 Active
-
2013-10-25$139,900
-
2010-06-30soldstatus $125,000
-
2010-06-30soldstatus $125,000 Sold
-
2010-06-29soldstatus $125,000
-
2010-05-28status Contract
-
2010-05-17historical
ⓘ Source: listings_history table (triggers on properties + properties_extension) + one-shot
backfill from property_details.listing_events for pre-trigger history.
Tax reassessment forecast MD · Partial reset (capped growth)
- Current annual tax
- $2,008 · $167/mo
- Projected year-2 tax
- $2,311 · $193/mo
- Expected delta
- +$304/yr (+$25/mo · 15.1%)
ⓘ Screening estimate from a state-policy table — verify with the county assessor before closing.
Climate risk First Street
- Flood 1/10 Low FEMA zone X (unshaded) · 0% chance over 30 yrs
- Wildfire 4/10 Moderate
- Heat 9/10 Extreme 7 d/yr ≥101°F today · 18 d/yr by 30 yrs out
- Wind 6/10 Major 60% chance of damaging wind over 30 yrs
- Air quality 2/10 Low 1 unhealthy d/yr today · 2 by 30 yrs out
Nearby sold comps map
Loading sold comps map…
Walkable amenities ~0.75 mi
Loading nearby amenities…
Taxation est. · year 1
- Rental income
- $25,950
- − Mortgage interest
- −$13,438
- − Property taxes
- −$2,008
- − Insurance
- −$1,200
- − Repairs & maintenance
- −$2,076
- − Management
- −$2,076
- − HOA
- −$156
- − Depreciation
- −$6,979
- Taxable loss
- −$1,983
- Est. tax savings @ 24.0%
- +$476
- After-tax cash flow
- $2,516/yr
For passive investors: Depreciation is non-cash, so a rental often shows a tax loss while cash-flowing — sheltering income. Rental losses are passive: they offset passive income freely, and up to $25,000/yr can offset ordinary (W-2) income if you actively participate and your MAGI is under $100k (phasing out to $0 by $150k); unused losses carry forward. On sale, claimed depreciation is recaptured at up to 25%, and gains may owe capital-gains tax (a 1031 exchange can defer both). Figures are a year-1 estimate at your 24.0% rate — not tax advice; consult a CPA.
Schools (NCES district)
- District
- St. Mary'S County Public Schools
- NCES district ID
- 2400600
- Math proficiency
- 23% ▼ -23.00%
- Reading proficiency
- 38% ▼ -12.00%
- Median HH income
- $83,240
- Composite
- 29.74/100
- National rank
- #6444
- State rank
- #8 of 24 in MD
Livability — California
- Score
- 73/100
- State rank
- #127
- US rank
- #5421
Category grades
Schools grade is shown separately in the Schools card above.
Census & demographics
- County
- Saint Marys County · 48,152 people
- City population
- 14,212
- Metro
- California-Lexington Park, MD
- Population (ZIP)
- 26,852
- Household income
- $103,048
- Rent vs Own
- Severe rent burden
- 1571.0
Population outlook (St. Mary's County) Hauer SSP2
- Today (2025)
- 123,125 people
- By 2030
- 128,374 · +4.3%
- By 2040
- 137,305 · +11.5%
- By 2050
- 143,065 · +16.2%
- By 2075
- 153,408 · +24.6%
- By 2100
- 151,790 · +23.3%
Race, ethnicity, and origin ACS 2023
- Neighborhood character
- Diverse neighborhood (Simpson 0.63)
- Race & ethnicity
- White 54% Black 28% Two or more races 11% Hispanic / Latino 6% Asian 4%
- Hispanic origin (detail)
- Mexican 3% Puerto Rican 1%
- Common ancestry
- Romanian 2% Slovak 2% Italian 1%
- Foreign-born
- 6% · Canada, Jamaica
- Languages at home
- 92% English-only · Spanish 3% Tagalog/Filipino 3% Other Asian/Pacific 1%
Political lean MEDSL · St. Mary's
- 2024 margin
- R (+17.2) · D 40.2% · R 57.4% · Other 2.4%
- 2008→2024 swing
- -4.4pp toward R · 2008: -12.8pp · 2024: -17.2pp
- All cycles
- 2024: R+17.2 2020: R+13.8 2016: R+24.6 2012: R+16.1 2008: R+12.8
Not yet ingested
- Civics
- —
Market trends
- HPI YoY
- ▼ -3.67%
- Current HPI
- 256.5435
- Rent YoY
- ▲ 0.49%
- Metro
- California-Lexington Park, MD
- State GDP YoY
- ▲ 2.97%
- F500 in state
- 12
Industry mix (Fortune 500 HQ in MD)
| Industry | F500 HQs | Revenue |
|---|---|---|
| Aerospace / Defense | 1 | $71B |
|
||
| Utilities | 1 | $25B |
|
||
| Hotels | 1 | $24B |
|
||
| Consumer Goods | 1 | $7B |
|
||
| Real Estate | 1 | $6B |
|
||
| Chemicals | 1 | $2B |
|
||
Price history
+93.7% since first listed48 events — show timeline
- 2026-05-20 Relisted — BRIGHT MLS
- 2026-04-06 Pending — BRIGHT MLS
- 2026-03-31 Price Changed $249,900 BRIGHT MLS
- 2026-01-15 Listed $259,900 BRIGHT MLS
- 2025-07-28 Listing Removed — BRIGHT MLS
- 2025-05-22 Price Changed $240,000 BRIGHT MLS
- 2025-05-22 Contingent — BRIGHT MLS
- 2025-05-19 Price Changed $230,000 BRIGHT MLS
- 2025-04-04 Listed $235,000 BRIGHT MLS
- 2025-03-26 Coming Soon — BRIGHT MLS
- 2022-11-15 Sold (Public Records) $200,000 Public Records
- 2022-10-25 Sold (MLS) $200,000 BRIGHT MLS
- 2022-10-04 Contingent — BRIGHT MLS
- 2022-09-04 Listed $210,000 BRIGHT MLS
- 2022-09-03 Coming Soon $210,000 BRIGHT MLS
- 2022-01-10 Sold (Public Records) $169,900 Public Records
- 2021-12-15 Sold (MLS) $169,900 BRIGHT MLS
- 2021-10-27 Pending — BRIGHT MLS
- 2021-10-23 Price Changed $169,900 BRIGHT MLS
- 2021-10-15 Price Changed $174,900 BRIGHT MLS
- 2021-10-01 Listed $179,900 BRIGHT MLS
- 2014-06-10 Sold (Public Records) $139,000 Public Records
- 2014-05-29 Sold (MLS) $139,000 MRIS
- 2014-05-29 Sold (MLS) $139,000 BRIGHT MLS
- 2014-04-04 Pending — MRIS
- 2014-04-03 Listing Removed — BRIGHT MLS
- 2014-01-13 Price Changed $139,900 MRIS
- 2013-10-25 Listed $145,000 MRIS
- 2013-10-25 Listed $139,900 BRIGHT MLS
- 2010-06-30 Sold (MLS) $125,000 MRIS
- 2010-06-30 Sold (MLS) $125,000 BRIGHT MLS
- 2010-06-29 Sold (Public Records) $125,000 Public Records
- 2010-05-28 Pending — MRIS
- 2010-05-17 Listing Removed — BRIGHT MLS
- 2010-05-13 Relisted — MRIS
- 2010-05-13 Price Changed $125,000 MRIS
- 2010-03-02 Pending — MRIS
- 2010-03-01 Delisted — MRIS
- 2009-10-21 Listed $129,900 MRIS
- 2009-10-21 Listed $125,000 BRIGHT MLS
- 2006-10-25 Sold (Public Records) $182,000 Public Records
- 2006-10-23 Listed $182,000 MRIS
- 2006-10-23 Sold (MLS) $182,000 MRIS
- 2006-10-23 Delisted — MRIS
- 2004-03-30 Sold (Public Records) $125,000 Public Records
- 2004-03-26 Sold (MLS) $125,000 MRIS
- 2004-02-25 Delisted — MRIS
- 2003-10-03 Listed $129,000 MRIS
Property tax history
+3.0%/yrLatest (2025): $2,008 · +14.0% YoY. Source: county tax records.
Cash-flow waterfall
monthlySold comps — $/sqft
last 12 mo · ≤1 miLoading sold comps…