 🌊 Lakefront
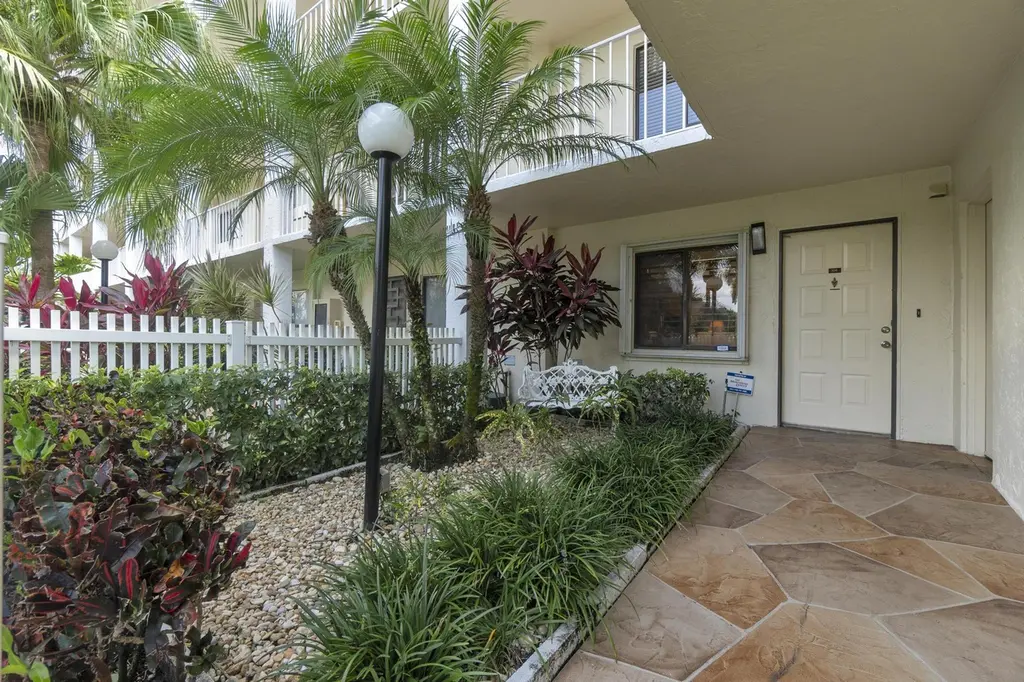
7351 Kinghurst Dr #108 · Delray Beach, FL
Flood risk 1/10 · Minimal
- FEMA flood zone
- X (unshaded)
- Chance of flooding over 30 yrs
- 0.0%
- Est. flood insurance / yr
- $507 – $1,088
Fire risk 3/10 · Minor
- Est. fire insurance / yr
- $947 – $1,759
Heat risk 9/10 · Severe
- Hot days now (above 107°F)
- 7 days/yr
- Hot days in 30 yrs
- 25 days/yr
Wind risk 10/10 · Severe
- Chance of severe wind over 30 yrs
- 99.0%
Air-quality risk 2/10 · Minimal
- Unhealthy air days now
- 0 days/yr
- Unhealthy air days in 30 yrs
- 2 days/yr
Risk factors via First Street. Map © Google.
Why this score? — see what drove the C- grade
The composite is a weighted blend of 9 inputs, each scored 0–100. Each bar is that input's sub-score; the figure is the points it added to the 100-point composite (weight × sub-score).
- Cash flow +13.2/30.0
- ARV discount +7.5/15.0
- 1% rule +6.9/10.0
- Appreciation +5.3/10.0
- Schools +4.3/10.0
- DSCR +3.9/10.0
- Livability +3.9/5.0
- Rent growth +2.6/5.0
- Condition / age +2.5/5.0
$249,000
🖨 Deal sheet 📄 Offer letter ✓ Due diligence
Listing remarks MLS
CORNER FIRST FLOOR UNIT!!LAKE & GOLF VIEWS. ALL NEW TILE, BRAND NEW KITCHEN W/ GRANITE COUNTERS & NEW APPLIANCES. FURNISHED WITH A FEW EXCLUSIONS. FEW STEPS FROM CLUBHOUSE & POOL. PARKING SPOT RIGHT IN FRONT OF UNIT. PRICED RIGHT!!
Key facts
- Remodeled kitchen
- Lake view
- Parking space
Tags
Property features AI
Finance
- Other: Not a land lease
- Financial info: Pets allowed (with size limit); Number of units in community: 1,800
- HOA & community: Community has an association (Huntington Lakes Section 3); Monthly HOA fee includes cable TV, insurance, internet, grounds maintenance, security, sewer, trash, water, common areas, common real estate tax, pool service; Community amenities include clubhouse, fitness center, indoor pool, heated pool, billiard room, community room, management/manager on site, jogging path, tennis courts, pickleball courts, shuffleboard court, bocce ball, street lights, lobby, trash chute, internet included
Exterior
- Parking: Assigned parking and guest parking; 1 open parking space (total parking listed as 1)
- Security: Closed-circuit cameras; Gated community with guard; Security system
- Utilities: Public water; Public sewer; 150 Amp electric service with three phase; Cable available; Electricity available; Sewer available; Water available
- Home design: Condominium; One-level living; Resale property; Faces south; Lancaster model
- Construction: CBS construction; Flat roof; 4-story building; Building named "43"
- Exterior features: Open patio; Patio; Gate fencing; City street frontage; Paved roads; private maintained road; Waterfront: Yes (no specific waterfront features listed)
Interior
- Kitchen: Electric range; Dishwasher; Microwave; Refrigerator; Disposal; Electric water heater
- Bedrooms: 2 bedrooms on the main level
- Flooring: Ceramic tile
- Bathrooms: 2 full bathrooms on the main level
- Heating & cooling: Central individual heating; Central individual cooling; Ceiling fan(s)
- Interior features: Walk-in closet(s); Blinds, sliding windows, and shutters; Furnished
- Laundry & utility: Laundry inside
Neighborhood map
What this means for you Summary
Snapshot
- This is a 2-bed/2.0-bath condo listed at $249k.
Deal economics
- At list price, monthly cash flow is $-7 ($-79/yr) — negative.
- To cash-flow at today's rent, offer at most $248k (0.5% below list).
- Meets the 1% rule at list price ($3k rent vs $249k).
- Recommended offer: $242k (3.0% below list) — sets the bar for market timing.
Location & tenants
- Location reads 77/100 on livability (#202 in FL, #3,160 nationally) — a middle-class / working-renter tenant base. Strengths: housing A+, health & safety A+, commute A-; Watch: cost of living C-, crime D-, amenities F.
- Palm Beach (suburban): math 46% / reading 53% proficiency, ranked #34 of 73 in FL (top 47%) — families likely to look elsewhere, expect single-tenant / working-renter base with shorter leases.
- Zoned schools: Hagen Road Elementary School (math 55% / reading 63%, grade B-, #722 of 2,144 statewide, top 34%, 773 students, 46% FRL); Spanish River Community High School (math 64% / reading 74%, grade B, #63 of 667 statewide, top 10%, 2,578 students, 25% FRL) — zoned schools average 35% FRL vs 52% district-wide (17 pts lower); this property's tenant base skews higher-income than the district average.
- Zoned-school proficiency averages 64% at this address vs 50% district-wide (+14 pts) — the actual schools serving this property are materially stronger than the Palm Beach average implies; a family-tenant draw the district grade alone would hide.
- Market conditions: Rents flat; 577 active listings in the ZIP; 40 comparable units currently listed for rent nearby; rentals at typical pace (median 19d on market — plan ~3-4 weeks tenant-placement turnaround); solid renter incomes; 3,974 units permitted in Palm Beach County in 2024 (1,012 in 5+ unit buildings).
Forward outlook
- In year one you build about $3k of equity ($2k loan paydown + $2k appreciation (0.7% local appreciation)).
- Palm Beach County population projected at +30% by 2050 — long-run rental-demand tailwind backs the buy-and-hold thesis.
- By year 9, paydown + projected appreciation supports a ~$33k cash-out refi (75% LTV) — recoverable capital for the next deal without selling this one.
Negotiation context
- It's been on market 60 days — a 3% lower offer ($242k) is reasonable based on typical stale-listing flexibility.
- 4 sale attempts since 15y ago; this cycle's ask has dropped $21k (8%) from the opening price — seller is motivated, your offer sets the floor, not the list.
- Current owner paid $83k; list at $249k implies a 200% gain — meaningful room to come down on a strong offer.
Risks & watch-outs
- Watch-outs: HOA is 29% of rent.
- Climate carrying-cost: severe wind risk, 99% chance of damaging wind over 30y; extreme-heat days projected 7→25/yr by 2055 (HVAC capex compounding) — expect insurance premiums to compound above CPI over the hold.
Questions for the listing agent
- What do current leases actually rent for vs. the listed asking? Can we see a recent rent roll and the last 12 months of T-12 income?
- It's been on market 60 days. Have you received any prior offers? Is the seller open to a 3% concession, seller financing, or rate buy-down credit?
- What does the HOA fee cover, when was the last increase, and are there any pending special assessments or reserve-fund shortfalls?
- Any open or pending special assessments — roof, HVAC, plumbing, elevator, façade? What's the per-unit balance and payoff schedule, and is the seller paying it off at close or rolling it to the buyer?
- Is there a deadline driving the sale (1031 exchange, divorce, estate, relocation)? That informs how much negotiation room exists.
- Schools are B-rated — typically a magnet for longer-tenancy family renters. What's the average tenant stay here, and is there a school-zone premium baked into asking?
- Crime grade is D in this area — have there been break-ins, vandalism, or insurance claims at this property in the last 3 years? What carrier currently insures it and at what premium?
- This sits on a lake — are riparian / water-frontage rights deeded with the parcel? Any dock permits, shoreline easements, or HOA water-use restrictions?
- What's the documented flood / surge / shoreline-erosion history here (FEMA AND non-FEMA — e.g., storm surge, creek backup, septic-field saturation)?
- Any water-quality or seasonal algae-bloom issues that affect tenant satisfaction or short-term-rental demand?
- What's the average days-on-market for RENTAL listings here right now (not sales)? A rising rental-DOM trend means longer vacancies and softer asking-rent achievability than the comps imply.
- What's the recent tenant-quality profile in this submarket — average credit score on applications, eviction rate, late-payment / NSF rate, and stable-employment percentage? A property-management company in the area should have these aggregated.
- How much new apartment / multifamily construction is in the pipeline within 1–3 miles? Heavy new supply (>2% of stock underway) typically softens rents 12–24 months out; light construction supports rent growth.
Investment metrics
- 1% rule
- 1.19% ✓
- Cap rate
- 6.26%
- Cash-on-cash
- -0.11%
- DSCR
- 0.99
- GRM
- 7.0
CMA / ARV
No comps found within radius.
Projected returns pro-forma
0.69% appreciation · 0.51% rent growth · sell at horizon
- IRR
- -1.9%
- Equity multiple
- 0.91×
- Total profit
- $-6,355
- Equity at exit
- $80,971
- IRR
- 1.3%
- Equity multiple
- 1.14×
- Total profit
- $9,602
- Equity at exit
- $104,550
Cash invested: $69,720 (down + closing). Projections, not guarantees.
Landlord ↔ Tenant lean methodology
- Overall (STATE)
- 87 Strongly Landlord-Friendly
- State Florida
- 87 Strongly Landlord-Friendly · R+3
- County
- — inherits STATE
- City
- — inherits STATE
ZIP-level market 33446
- Home prices YoY
- 0.3%
- Rents YoY
- 0.5%
- Active inventory
- 577
- Price-to-rent
- 7.0×
Monthly cashflow live
- Estimated rent
- $2,956 high interval (Pro) →
- Mortgage (P&I)
- −$1,306
- Tax from tax record
- −$63 /mo · $756/yr
- Insurance
- −$104
- HOA
- −$869
- Vacancy / Maint / Mgmt
- −$621
- Net cashflow
- $-7
Break-even live
UW: 25.0% down · 7.5% · 30yr · 1.5% tax · 5.0% vac · 8.0% maint · 8.0% mgmt
Financing live
Cash to close
- Down payment
- $62,250
- Closing costs
- $7,470
- Reserves months
- —
- Total cash needed
- —
Loan-product check · same deal, 3 products live
Conventional
25% down · 7.5% · 30yr
- Down + closing
- —
- Monthly P&I
- —
- Monthly cashflow
- —
- DSCR
- —
- Eligible?
- —
Personal DTI + credit; lowest rate.
DSCR
20% down · 8.5% · 30yr
- Down + closing
- —
- Monthly P&I
- —
- Monthly cashflow
- —
- DSCR
- —
- Eligible?
- —
No personal income docs; deal must DSCR.
Hard money
10% down · 12.0% · 12mo
- Down + closing
- —
- Monthly P&I
- —
- Monthly cashflow
- —
- DSCR
- —
- Eligible?
- —
Short-term bridge; refi at stabilization.
Rent comps 40 comps
| Address | Beds | Baths | Sqft | Rent | $/sqft | DOM | Units | Dist |
|---|---|---|---|---|---|---|---|---|
| 7350 Kinghurst Dr Delray Beach, FL | 2.0 | 2.0 | 1220 | $4,500 | $3.69 | 15d | 1 | 0.06mi |
| 7350 Kinghurst Dr #305 Delray Beach, FL | 2.0 | 2.0 | 1220 | $4,500 | $3.69 | 22d | 1 | 0.06mi |
| 7301 Amberly Ln #304 Delray Beach, FL | 2.0 | 2.0 | 1080 | $1,495 | $1.38 | 8d | 1 | 0.18mi |
| 7260 Kinghurst Dr #205 Delray Beach, FL | 2.0 | 2.0 | 1230 | $2,800 | $2.28 | 19d | 1 | 0.18mi |
| 7515 S Oriole Blvd Delray Beach, FL | 2.0 | 2.0 | 850 | $1,700 | $2.00 | 24d | 1 | 0.19mi |
| 14856 Barletta Way Delray Beach, FL | 2.0 | 2.0 | 1406 | $3,200 | $2.28 | 24d | 1 | 0.20mi |
| 7310 Ashford Pl Delray Beach, FL | 2.0 | 2.0 | 1230 | $3,200 | $2.60 | 8d | 1 | 0.23mi |
| 7310 Ashford Pl Delray Beach, FL | 2.0 | 2.0 | 1230 | $3,200 | $2.60 | 15d | 1 | 0.23mi |
| 7310 Ashford Pl Delray Beach, FL | 2.0 | 2.0 | 1230 | $2,700 | $2.20 | 19d | 2 | 0.23mi |
| 14895 Builtmore Way Delray Beach, FL | 2.0 | 2.0 | 1103 | $1,800 | $1.63 | 24d | 1 | 0.35mi |
| 14898 Wedgefield Dr #202 Delray Beach, FL | 2.0 | 2.0 | 1103 | $2,000 | $1.81 | 18d | 1 | 0.35mi |
| 7607 Atlantic Ave Delray Beach, FL | 1.0–2.0 | 1.0–2.0 | 1086 | $3,494 | $3.22 | 2d | 6 | 0.38mi |
| 14747 Cumberland Dr #301 Delray Beach, FL | 2.0 | 2.0 | 1044 | $1,900 | $1.82 | 24d | 1 | 0.39mi |
| 14723 Cumberland Dr Unit 404 B Delray Beach, FL | 1.0 | 2.0 | 912 | $1,850 | $2.03 | 24d | 1 | 0.39mi |
| 14509 Sloan Ridge Dr Unit 10-104 Luminosa Delray Beach, FL | 3.0 | 2.0 | 1328 | $3,827 | $2.88 | 24d | 1 | 0.39mi |
| 14828 Golden Jax Ln Unit 8-105 Radiance Delray Beach, FL | 2.0 | 2.0 | 1321 | $3,948 | $2.99 | 15d | 1 | 0.39mi |
| 14828 Golden Jax Ln Unit 8103 Delray Beach, FL | 2.0 | 2.0 | 1321 | $3,949 | $2.99 | 5d | 1 | 0.39mi |
| 14828 Golden Jax Ln Unit 6-105 Radiance Delray Beach, FL | 2.0 | 2.0 | 1321 | $4,148 | $3.14 | 17d | 1 | 0.39mi |
| 14896 Bal Moral Ln Delray Beach, FL | 2.0 | 2.0 | 1040 | $2,200 | $2.12 | 24d | 1 | 0.42mi |
| 7286 Huntington Ln #105 Delray Beach, FL | 2.0 | 2.0 | 1070 | $3,350 | $3.13 | 24d | 1 | 0.42mi |
| 14800 Cumberland Dr Delray Beach, FL | 2.0 | 2.0 | 1321 | $4,048 | $3.06 | 5d | 4 | 0.44mi |
| 7512 Eagle Point Dr Unit 7512 Delray Beach, FL | 3.0 | 2.0 | 1463 | $4,000 | $2.73 | 19d | 1 | 0.49mi |
| 7512 Eagle Point Dr Delray Beach, FL | 3.0 | 2.0 | 1463 | $4,000 | $2.73 | 4d | 1 | 0.50mi |
| 7192 Huntington Ln #307 Delray Beach, FL | 2.0 | 2.0 | 1070 | $3,500 | $3.27 | 18d | 1 | 0.50mi |
| 14 Willowbrook Ln #101 Delray Beach, FL | 2.0 | 2.0 | 1005 | $1,700 | $1.69 | 5d | 1 | 0.51mi |
| 14534 Highland Center Way Delray Beach, FL | 2.0 | 2.0 | 1319 | $3,400 | $2.58 | 8d | 1 | 0.52mi |
| 15035 Michelangelo Blvd #103 Delray Beach, FL | 2.0 | 2.0 | 1079 | $2,000 | $1.85 | 24d | 1 | 0.53mi |
| 15055 Michelangelo Blvd Delray Beach, FL | 2.0–3.0 | 2.0 | 1158 | $2,125 | $1.83 | 22d | 2 | 0.55mi |
| 15015 Michelangelo Blvd #102 Delray Beach, FL | 3.0 | 2.0 | 1238 | $2,499 | $2.02 | 24d | 1 | 0.56mi |
| 15015 Michelangelo Blvd #102 Delray Beach, FL | 3.0 | 2.0 | 1238 | $2,499 | $2.02 | 3d | 1 | 0.56mi |
| 15065 Michelangelo Blvd #105 Delray Beach, FL | 2.0 | 2.0 | 1079 | $2,400 | $2.22 | 2d | 1 | 0.57mi |
| 15065 Michelangelo Blvd #105 Delray Beach, FL | 2.0 | 2.0 | 1079 | $2,400 | $2.22 | 22d | 1 | 0.57mi |
| 20 Abbey Ln #102 Delray Beach, FL | 2.0 | 2.0 | 925 | $2,600 | $2.81 | 24d | 1 | 0.57mi |
| 14556 Wiley Range Rd Delray Beach, FL | 2.0 | 2.0 | 1319 | $3,000 | $2.27 | 24d | 1 | 0.57mi |
| 21 Abbey Ln #107 Delray Beach, FL | 2.0 | 2.0 | 925 | $1,800 | $1.95 | 15d | 1 | 0.58mi |
| 23 Abbey Ln #208 Delray Beach, FL | 2.0 | 2.0 | 925 | $1,500 | $1.62 | 3d | 1 | 0.59mi |
| 10 Willowbrook Ln #105 Delray Beach, FL | 2.0 | 2.0 | 1005 | $2,100 | $2.09 | 11d | 1 | 0.60mi |
| 7076 Huntington Ln #608 Delray Beach, FL | 2.0 | 2.0 | 1230 | $2,600 | $2.11 | 24d | 1 | 0.60mi |
| 14624 Three Ponds Trl Delray Beach, FL | 3.0 | 2.0 | 1411 | $3,250 | $2.30 | 18d | 1 | 0.60mi |
| 19 Abbey Ln #206 Delray Beach, FL | 2.0 | 2.0 | 925 | $1,750 | $1.89 | 24d | 1 | 0.60mi |
HOA detail condo
- Monthly dues
- $869 · $10,428/yr
- Likely covers
- pool
- Assessments
- None detected in remarks — confirm with the listing agent.
Listing history 25 events
-
2026-06-18days on market $249,000 Active 60 DOM
-
2026-06-17days on market $249,000 Active 59 DOM
-
2026-06-16days on market $249,000 Active 58 DOM
-
2026-06-15days on market $249,000 Active 57 DOM
-
2026-06-13days on market $249,000 Active 55 DOM
-
2026-06-09days on market $249,000 Active 51 DOM
-
2026-06-08days on market $249,000 Active 50 DOM
-
2026-06-07days on market $249,000 Active 49 DOM
-
2026-06-04pricedays on market $249,000 Active 46 DOM
-
2026-06-03days on market $260,000 Active 45 DOM
-
2026-06-02days on market $260,000 Active 44 DOM
-
2026-06-01days on market $260,000 Active 43 DOM
-
2026-05-31days on market $260,000 Active 42 DOM
-
2026-05-07price $260,000
-
2026-04-19$270,000 Active
-
2025-10-19historical
-
2025-10-03status Active
-
2025-10-01historical Active Under Contract
-
2025-05-29$289,000 Active
-
2011-08-16soldstatus $83,000
-
2011-08-10soldstatus $83,000 249-char remark
Show marketing remark (249 chars)
CORNER FIRST FLOOR UNIT!!LAKE & GOLF VIEWS. ALL NEW TILE, BRAND NEW KITCHEN W/ GRANITE COUNTERS & NEW APPLIANCES. FURNISHED WITH A FEW EXCLUSIONS. FEW STEPS FROM CLUBHOUSE & POOL. PARKING SPOT RIGHT IN FRONT OF UNIT. PRICED RIGHT!!
-
2011-07-20historical 249-char remark
Show marketing remark (249 chars)
CORNER FIRST FLOOR UNIT!!LAKE & GOLF VIEWS. ALL NEW TILE, BRAND NEW KITCHEN W/ GRANITE COUNTERS & NEW APPLIANCES. FURNISHED WITH A FEW EXCLUSIONS. FEW STEPS FROM CLUBHOUSE & POOL. PARKING SPOT RIGHT IN FRONT OF UNIT. PRICED RIGHT!!
-
2011-05-05$85,000 249-char remark
Show marketing remark (249 chars)
CORNER FIRST FLOOR UNIT!!LAKE & GOLF VIEWS. ALL NEW TILE, BRAND NEW KITCHEN W/ GRANITE COUNTERS & NEW APPLIANCES. FURNISHED WITH A FEW EXCLUSIONS. FEW STEPS FROM CLUBHOUSE & POOL. PARKING SPOT RIGHT IN FRONT OF UNIT. PRICED RIGHT!!
-
2004-06-14soldstatus $155,000
-
2003-12-22soldstatus $125,000
ⓘ Source: listings_history table (triggers on properties + properties_extension) + one-shot
backfill from property_details.listing_events for pre-trigger history.
Tax reassessment forecast FL · Resets to sale price
- Current annual tax
- $756 · $63/mo
- Projected year-2 tax
- $2,067 · $172/mo
- Expected delta
- +$1,311/yr (+$109/mo · 173.5%)
ⓘ Screening estimate from a state-policy table — verify with the county assessor before closing.
Climate risk First Street
- Flood 1/10 Low FEMA zone X (unshaded) · 0% chance over 30 yrs
- Wildfire 3/10 Moderate
- Heat 9/10 Extreme 7 d/yr ≥107°F today · 25 d/yr by 30 yrs out
- Wind 10/10 Extreme 99% chance of damaging wind over 30 yrs
- Air quality 2/10 Low 0 unhealthy d/yr today · 2 by 30 yrs out
Nearby sold comps map
Loading sold comps map…
Walkable amenities ~0.75 mi
Loading nearby amenities…
Taxation est. · year 1
- Rental income
- $35,467
- − Mortgage interest
- −$13,948
- − Property taxes
- −$756
- − Insurance
- −$1,245
- − Repairs & maintenance
- −$2,837
- − Management
- −$2,837
- − HOA
- −$10,428
- − Depreciation
- −$7,244
- Taxable loss
- −$3,828
- Est. tax savings @ 24.0%
- +$919
- After-tax cash flow
- $839/yr
For passive investors: Depreciation is non-cash, so a rental often shows a tax loss while cash-flowing — sheltering income. Rental losses are passive: they offset passive income freely, and up to $25,000/yr can offset ordinary (W-2) income if you actively participate and your MAGI is under $100k (phasing out to $0 by $150k); unused losses carry forward. On sale, claimed depreciation is recaptured at up to 25%, and gains may owe capital-gains tax (a 1031 exchange can defer both). Figures are a year-1 estimate at your 24.0% rate — not tax advice; consult a CPA.
Schools (NCES district)
- District
- Palm Beach
- NCES district ID
- 1201500
- Math proficiency
- 46% ▼ -16.00%
- Reading proficiency
- 53% ▼ -4.00%
- Median HH income
- $53,943
- Composite
- 42.72/100
- National rank
- #3160
- State rank
- #34 of 73 in FL
Livability — Delray Beach
- Score
- 77/100
- State rank
- #202
- US rank
- #3160
Category grades
Schools grade is shown separately in the Schools card above.
Census & demographics
- County
- Palm Beach County · 1,438,312 people
- City population
- 123,167
- Metro
- Miami-Fort Lauderdale-Pompano Beach, FL
- Population (ZIP)
- 28,431
- Household income
- $80,187
- Rent vs Own
- Severe rent burden
- 494.0
Population outlook (Palm Beach County) Hauer SSP2
- Today (2025)
- 1,637,487 people
- By 2030
- 1,743,255 · +6.5%
- By 2040
- 1,948,712 · +19.0%
- By 2050
- 2,132,979 · +30.3%
- By 2075
- 2,530,027 · +54.5%
- By 2100
- 2,706,979 · +65.3%
Race, ethnicity, and origin ACS 2023
- Neighborhood character
- Predominantly White (79%)
- Race & ethnicity
- White 79% Hispanic / Latino 13% Two or more races 9% Black 4%
- Hispanic origin (detail)
- Puerto Rican 3% Dominican 1%
- Common ancestry
- Romanian 9% Scotch-Irish 9% Italian 2%
- Foreign-born
- 20% · Canada, Jamaica, Guatemala
- Languages at home
- 80% English-only · Spanish 12% Other Indo-European 2% French/Haitian/Cajun 2%
Political lean MEDSL · Palm Beach
- 2024 margin
- Toss-up / Even · D 50.0% · R 49.2%
- 2008→2024 swing
- -22.1pp toward R · 2008: 22.9pp · 2024: 0.8pp
- All cycles
- 2024: D+0.8 2020: D+12.8 2016: D+15.3 2012: D+17.0 2008: D+22.9
Not yet ingested
- Civics
- —
Market trends
- HPI YoY
- ▲ 0.69%
- Current HPI
- 242.5138
- Rent YoY
- ▲ 0.51%
- Metro
- Miami-Fort Lauderdale-Pompano Beach, FL
- State GDP YoY
- ▲ 3.28%
- F500 in state
- 36
Industry mix (Fortune 500 HQ in FL)
| Industry | F500 HQs | Revenue |
|---|---|---|
| Industrial Technology | 2 | $29B |
|
||
| Insurance | 2 | $17B |
|
||
| Retail | 1 | $60B |
|
||
| Technology Distribution | 1 | $58B |
|
||
| Homebuilding | 1 | $35B |
|
||
| Technology Manufacturing | 1 | $35B |
|
||
Price history
+108.0% since first listed12 events — show timeline
- 2026-05-07 Price Changed $260,000 Beaches MLS
- 2026-04-19 Listed $270,000 Beaches MLS
- 2025-10-19 Listing Removed — Beaches MLS
- 2025-10-03 Relisted — Beaches MLS
- 2025-10-01 Contingent — Beaches MLS
- 2025-05-29 Listed $289,000 Beaches MLS
- 2011-08-16 Sold (Public Records) $83,000 Public Records
- 2011-08-10 Sold (MLS) $83,000 Beaches MLS
- 2011-07-20 Listing Removed — Beaches MLS
- 2011-05-05 Listed $85,000 Beaches MLS
- 2004-06-14 Sold (Public Records) $155,000 Public Records
- 2003-12-22 Sold (Public Records) $125,000 Public Records
Property tax history
+0.1%/yrLatest (2025): $756 · +2.7% YoY. Source: county tax records.
Cash-flow waterfall
monthlySold comps — $/sqft
last 12 mo · ≤1 miLoading sold comps…