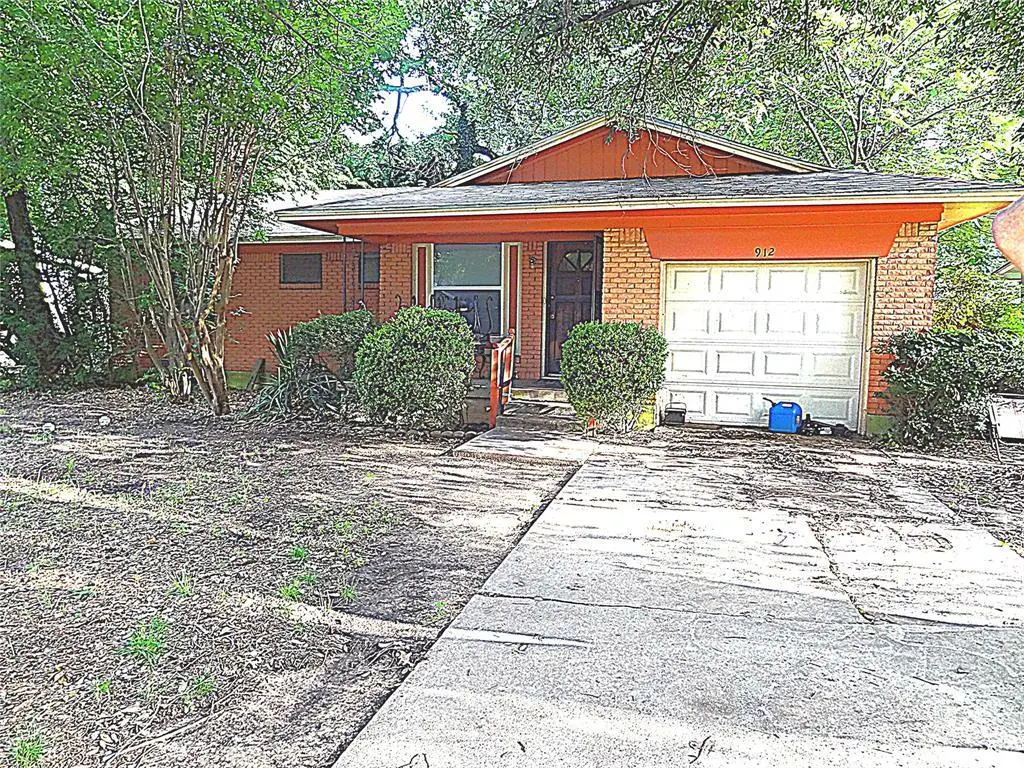
912 Sierra Dr · Denton, TX
Flood risk 7/10 · Major
- FEMA flood zone
- X (unshaded)
- Chance of flooding over 30 yrs
- 0.99%
- Est. flood insurance / yr
- $507 – $1,088
Fire risk 4/10 · Minor
- Est. fire insurance / yr
- $1,222 – $2,270
Heat risk 7/10 · Major
- Hot days now (above 109°F)
- 7 days/yr
- Hot days in 30 yrs
- 21 days/yr
Wind risk 4/10 · Minor
- Chance of severe wind over 30 yrs
- 24.0%
Air-quality risk 4/10 · Minor
- Unhealthy air days now
- 4 days/yr
- Unhealthy air days in 30 yrs
- 5 days/yr
Risk factors via First Street. Map © Google.
Why this score? — see what drove the D+ grade
The composite is a weighted blend of 9 inputs, each scored 0–100. Each bar is that input's sub-score; the figure is the points it added to the 100-point composite (weight × sub-score).
- Cash flow +13.3/30.0
- ARV discount +13.2/15.0
- Livability +4.4/5.0
- DSCR +4.0/10.0
- 1% rule +3.6/10.0
- Schools +3.5/10.0
- Condition / age +2.5/5.0
- Rent growth +0.8/5.0
- Appreciation +0.0/10.0
$199,900
🖨 Deal sheet (PDF) 📄 Offer letter ✓ Due diligence
Listing remarks MLS
Welcome HOME!! This 3-bedroom, 1 Full Bath and half Bath, Single-Story HOME, is nestled in a Quiet Neighborhood in the HEART of Downtown Denton, TX. This CHARMING OASIS has a SPACIOUS living area, Plus a Dining Area. Great Location*NEAR UNT, SHOPPING, DINING, AND ENTERTAINMENT, with nearby jogging and biking trails. Priced to Sell*Schedule an appointment, BEFORE IT IS GONE! Buyer and Buyer's Agent to Verify all information.
Key facts
- Near unt
- 7,492 sq ft lot
- Garage
Tags
Neighborhood map
What this means for you Summary
Snapshot
- This is a 3-bed/1.5-bath single-family listed at $200k.
Deal economics
- At list price, monthly cash flow is $-66 ($-789/yr) — negative.
- To cash-flow at today's rent, offer at most $188k (5.8% below list).
- To meet the 1% rule (rent ≥ 1% of price), the offer needs to be $173k (13.7% below list).
- Recommended offer: $173k (13.7% below list) — sets the bar for 1% rule.
- Cap rate 6.3% vs local median 3.4% in Denton — top-decile yield for the area; either an underpriced asset or a hidden risk that comps aren't pricing in. Stress-test before assuming the spread holds.
Location & tenants
- Location reads 88/100 on livability (#2 in TX, #210 nationally) — a professional / high-income tenant draw. Strengths: amenities A+, commute A+, housing A+.
- Denton ISD (urban): math 36% / reading 43% proficiency, ranked #383 of 826 in TX (top 46%) — families likely to look elsewhere, expect single-tenant / working-renter base with shorter leases.
- Market conditions: Rents falling (-6.9%/yr); 146 active listings in the ZIP; 40 comparable units currently listed for rent nearby; rentals at typical pace (median 27d on market — plan ~3-4 weeks tenant-placement turnaround); solid renter incomes; 10,531 units permitted in Denton County in 2024 (2,713 in 5+ unit buildings).
Forward outlook
- Local home prices are declining (-3.0%/yr); year-one equity from $1k of loan paydown is wiped out by about $6k of value loss. Plan a longer hold.
- Denton County population projected at +66% by 2050 — long-run rental-demand tailwind backs the buy-and-hold thesis.
Negotiation context
- It's been on market 102 days — a 9% lower offer ($182k) is reasonable based on typical stale-listing flexibility.
- 2 sale attempts; this cycle's ask has dropped $30k (13%) from the opening price — seller is motivated, your offer sets the floor, not the list.
Risks & watch-outs
- Watch-outs: flood insurance adds $66/mo.
- Climate carrying-cost: major flood risk; extreme-heat days projected 7→21/yr by 2055 (HVAC capex compounding) — expect insurance premiums to compound above CPI over the hold.
Questions for the listing agent
- What do current leases actually rent for vs. the listed asking? Can we see a recent rent roll and the last 12 months of T-12 income?
- It's been on market 102 days. Have you received any prior offers? Is the seller open to a 14% concession, seller financing, or rate buy-down credit?
- Built in 1965 — when were the roof, HVAC, electrical panel, plumbing, and water heater last replaced?
- What's the actual annual flood-insurance premium (NFIP or private), and is the property in a SFHA with mandatory coverage?
- Why hasn't it sold? Are there any deal-killer items the seller is aware of (foundation, flood, title, zoning, code violations)?
- Is there a deadline driving the sale (1031 exchange, divorce, estate, relocation)? That informs how much negotiation room exists.
- Schools are B-rated — typically a magnet for longer-tenancy family renters. What's the average tenant stay here, and is there a school-zone premium baked into asking?
- The area grade is low — what's the realistic commute time and amenity access for the typical tenant pool here? Any planned neighborhood developments (good or bad) we should know about?
- What's the average days-on-market for RENTAL listings here right now (not sales)? A rising rental-DOM trend means longer vacancies and softer asking-rent achievability than the comps imply.
- What's the recent tenant-quality profile in this submarket — average credit score on applications, eviction rate, late-payment / NSF rate, and stable-employment percentage? A property-management company in the area should have these aggregated.
- How much new for-sale + rental construction is in the pipeline within 1–3 miles? Heavy new supply typically softens prices + rents 12–24 months out; constrained supply supports both.
Investment metrics
- 1% rule
- 0.86% ✗
- Cap rate
- 6.30%
- Cash-on-cash
- 0.01%
- DSCR
- 1.00
- GRM
- 9.7
CMA / ARV
- ARV (median comp)
- $228,990
- List price
- $199,900
- Delta
- -12.70%
- Verdict
- UNDERPRICED
- Comps
- 20 within 1.0 mi
Show comp detail 12 sales within ~0.75 mi
| Address | Dist | Beds/Ba | Sqft | Sold | Price | $/sf | Match |
|---|---|---|---|---|---|---|---|
| 913 Laguna Dr | 0.08mi | 3/2.0 | 1,184 (+8%) | 12mo | $249,500 | $211 | 71 |
| 3323 Valley View Rd | 0.28mi | 3/1.5 | 1,058 (-4%) | 14mo | $258,000 | $244 | 70 |
| 3304 Avon Dr | 0.36mi | 3/1.5 | 1,163 (+6%) | 12mo | $257,500 | $221 | 63 |
| 504 Aspen Dr | 0.34mi | 3/2.0 | 1,160 (+6%) | 12mo | $285,000 | $246 | 63 |
| 700 Windswept Ct | 0.36mi | 2/2.0 (-1) | 1,184 (+8%) | 2mo | $251,800 | $213 | 61 |
| 507 Yucca Dr | 0.41mi | 3/2.0 | 1,165 (+6%) | 10mo | $130,000 | $112 | 60 |
| 625 Windswept Ct | 0.34mi | 2/2.0 (-1) | 1,184 (+8%) | 5mo | $249,000 | $210 | 59 |
| 3403 Huisache St | 0.43mi | 3/2.0 | 1,210 (+10%) | 4mo | $274,800 | $227 | 58 |
| 3904 Titan Trl | 0.61mi | 3/1.5 | 1,005 (-8%) | 7mo | $200,000 | $199 | 52 |
| 412 Foxwood Cir | 0.45mi | 3/2.0 | 1,229 (+12%) | 14mo | $299,900 | $244 | 45 |
| 3342 Ashley Cir | 0.60mi | 3/2.0 | 1,233 (+12%) | 5mo | $289,000 | $234 | 45 |
| 525 Pershing Dr | 0.71mi | 3/2.0 | 1,200 (+10%) | 15mo | $259,900 | $217 | 37 |
Match score weights: distance 35% · size 25% · config 20% · recency 20%. Top-matched comps best support the ARV.
Projected returns pro-forma
-3.0% appreciation · 0.0% rent growth · sell at horizon
- IRR
- -22.1%
- Equity multiple
- 0.26×
- Total profit
- $-41,583
- Equity at exit
- $29,806
- IRR
- -26.4%
- Equity multiple
- -0.09×
- Total profit
- $-60,922
- Equity at exit
- $17,284
Cash invested: $55,972 (down + closing). Projections, not guarantees.
Landlord ↔ Tenant lean methodology
- Overall (STATE)
- 87 Strongly Landlord-Friendly
- State Texas
- 87 Strongly Landlord-Friendly · R+5
- County
- — inherits STATE
- City
- — inherits STATE
ZIP-level market 76209
- Rents YoY
- -6.9%
- Active inventory
- 146
- Price-to-rent
- 9.7×
Monthly cashflow live
- Estimated rent
- $1,726 high interval (Pro) →
- Mortgage (P&I)
- −$1,048
- Tax from tax record
- −$231 /mo · $2,771/yr
- Insurance
- −$83
- Flood insurance flood zone
- −$66 /mo · $798/yr
- HOA
- −$0
- Vacancy / Maint / Mgmt
- −$362
- Net cashflow
- $-66
Break-even live
Sensitivity live
| Price | -10% $47 | -5% $-9 | +0% $-66 | +5% $-122 | +10% $-179 |
|---|---|---|---|---|---|
| Rent | -10% $-202 | -5% $-134 | +0% $-66 | +5% $2 | +10% $71 |
| Rate | -1.0pp $35 | -0.5pp $-15 | base $-66 | +0.5pp $-118 | +1.0pp $-170 |
UW: 25.0% down · 7.5% · 30yr · 1.5% tax · 5.0% vac · 8.0% maint · 8.0% mgmt
Financing live
Cash to close
- Down payment
- $49,975
- Closing costs
- $5,997
- Reserves months
- —
- Total cash needed
- —
Loan-product check · same deal, 3 products live
Conventional
25% down · 7.5% · 30yr
- Down + closing
- —
- Monthly P&I
- —
- Monthly cashflow
- —
- DSCR
- —
- Eligible?
- —
Personal DTI + credit; lowest rate.
DSCR
20% down · 8.5% · 30yr
- Down + closing
- —
- Monthly P&I
- —
- Monthly cashflow
- —
- DSCR
- —
- Eligible?
- —
No personal income docs; deal must DSCR.
Hard money
10% down · 12.0% · 12mo
- Down + closing
- —
- Monthly P&I
- —
- Monthly cashflow
- —
- DSCR
- —
- Eligible?
- —
Short-term bridge; refi at stabilization.
Rent comps 40 comps
| Address | Beds | Baths | Sqft | Rent | $/sqft | DOM | Units | Dist |
|---|---|---|---|---|---|---|---|---|
| 929 Sierra Dr Denton, TX | 3.0 | 1.5 | 958 | $2,050 | $2.14 | 45d | 1 | 0.02mi |
| 808 Laguna Dr Denton, TX | 3.0 | 1.0 | 910 | $1,565 | $1.72 | 4d | 1 | 0.11mi |
| 1605 Stuart Rd Denton, TX | 3.0 | 2.0 | 1403 | $1,900 | $1.35 | 45d | 1 | 0.15mi |
| 701 Wolftrap Dr Denton, TX | 3.0 | 2.0 | 1346 | $2,000 | $1.49 | 26d | 1 | 0.27mi |
| 3001 Gray Wolf Cir Unit 2 Denton, TX | 3.0 | 2.0 | 1000 | $1,800 | $1.80 | 45d | 1 | 0.29mi |
| 3001 Gray Wolf Cir Unit 121 Denton, TX | 3.0 | 2.0 | 1000 | $1,500 | $1.50 | 26d | 1 | 0.30mi |
| 624 Wolftrap Dr Unit 626 Denton, TX | 2.0 | 1.5 | 1024 | $1,475 | $1.44 | 12d | 1 | 0.30mi |
| 3501 Valley View Rd Denton, TX | 3.0 | 1.5 | 1078 | $1,795 | $1.67 | 45d | 1 | 0.34mi |
| 521 E Windsor Dr Denton, TX | 1.0–2.0 | 1.0 | 711 | $1,086 | $1.53 | 1d | 7 | 0.35mi |
| 713 Sun Valley Dr Denton, TX | 3.0 | 2.0 | 1176 | $2,250 | $1.91 | 26d | 1 | 0.39mi |
| 3028 N Bell Ave Denton, TX | 3.0 | 2.0 | 1061 | $1,700 | $1.60 | 26d | 1 | 0.47mi |
| 3024 N Bell Ave Unit 3028 Denton, TX | 3.0 | 2.0 | 1061 | $1,700 | $1.60 | 26d | 1 | 0.47mi |
| 3815 Stuart Rd Denton, TX | 1.0–2.0 | 1.0–2.0 | 689 | $1,355 | $1.97 | 1d | 4 | 0.47mi |
| 3815 Stuart Rd Unit 2BR2BATH Denton, TX | 2.0 | 2.0 | 837 | $1,325 | $1.58 | 45d | 1 | 0.47mi |
| 3132 Cedar Hill St Denton, TX | 3.0 | 2.0 | 1378 | $1,850 | $1.34 | 26d | 1 | 0.47mi |
| 3812 Stuart Rd Denton, TX | 2.0 | 1.5 | 1098 | $1,350 | $1.23 | 26d | 1 | 0.48mi |
| 3012 N Bell Ave Denton, TX | 3.0 | 2.0 | 1061 | $1,650 | $1.56 | 45d | 1 | 0.49mi |
| 3817 Yellowstone Pl Unit ADU Denton, TX | 2.0 | 2.0 | 800 | $1,700 | $2.12 | 45d | 1 | 0.49mi |
| 3008 N Bell Ave Unit 3012 Denton, TX | 3.0 | 2.0 | 1061 | $1,650 | $1.56 | 45d | 1 | 0.50mi |
| 3008 N Bell Ave Denton, TX | 3.0 | 2.0 | 1061 | $1,750 | $1.65 | 26d | 1 | 0.50mi |
| 3225 Hollycreek Denton, TX | 2.0 | 2.0 | 1260 | $1,695 | $1.35 | 1d | 1 | 0.52mi |
| 3805 Atlas Dr Denton, TX | 3.0 | 1.0 | 1392 | $1,795 | $1.29 | 26d | 1 | 0.53mi |
| 3117 Inglewood St Denton, TX | 3.0 | 2.0 | 1163 | $1,790 | $1.54 | 45d | 1 | 0.54mi |
| 3825 Camelot St Unit A Denton, TX | 2.0 | 1.0 | 922 | $1,300 | $1.41 | 1d | 1 | 0.58mi |
| 3825 Camelot St Denton, TX | 2.0 | 1.0 | 922 | $1,300 | $1.41 | 14d | 1 | 0.58mi |
| 3825 Camelot St Denton, TX | 2.0 | 1.0 | 922 | $1,300 | $1.41 | 22d | 1 | 0.58mi |
| 217 Tanglewood St Denton, TX | 3.0 | 2.0 | 1288 | $1,970 | $1.53 | 0d | 1 | 0.58mi |
| 3232 N Locust St Denton, TX | 2.0 | 2.0 | 928 | $1,485 | $1.60 | 14d | 1 | 0.62mi |
| 3232 N Locust St Denton, TX | 3.0 | 2.0 | 1164 | $1,851 | $1.59 | 45d | 1 | 0.62mi |
| 2731 E Sherman Dr Unit 2102 Denton, TX | 2.0 | 2.0 | 1007 | $1,399 | $1.39 | 7d | 1 | 0.70mi |
| 629 Apollo Dr Denton, TX | 3.0 | 1.5 | 1016 | $1,800 | $1.77 | 45d | 1 | 0.73mi |
| 4108 Selene Dr Denton, TX | 3.0 | 1.5 | 1068 | $1,730 | $1.62 | 22d | 1 | 0.75mi |
| 1255 Poinsettia Blvd Denton, TX | 1.0–3.0 | 1.0–2.0 | 979 | $1,930 | $1.97 | 1d | 8 | 0.76mi |
| 1250 Randall St Denton, TX | 1.0–3.0 | 1.0–2.0 | 902 | $2,446 | $2.71 | 0d | 67 | 0.79mi |
| 2951 Picadilly Ln Denton, TX | 1.0–2.0 | 1.0–2.0 | 1083 | $1,931 | $1.78 | 1d | 25 | 0.79mi |
| 201 Coronado Dr Denton, TX | 1.0–2.0 | 1.0–2.0 | 727 | $1,260 | $1.73 | 1d | 12 | 0.80mi |
| 2219 Kingston Trce Denton, TX | 3.0 | 2.0 | 1075 | $1,645 | $1.53 | 20d | 1 | 0.87mi |
| 2421 N Bell Ave Denton, TX | 1.0–2.0 | 1.0 | 850 | $1,400 | $1.65 | 45d | 1 | 0.88mi |
| 3909 N Loop 288 Denton, TX | 1.0–2.0 | 1.0–2.0 | 878 | $2,023 | $2.30 | 0d | 23 | 0.90mi |
| 3919 Canton Ct Denton, TX | 3.0 | 2.0 | 1481 | $2,195 | $1.48 | 45d | 1 | 0.91mi |
Listing history 20 events
-
2026-06-21days on market $199,900 Active 102 DOM
-
2026-06-18days on market $199,900 Active 99 DOM
-
2026-06-17days on market $199,900 Active 98 DOM
-
2026-06-16days on market $199,900 Active 97 DOM
-
2026-06-15days on market $199,900 Active 96 DOM
-
2026-06-13days on market $199,900 Active 94 DOM
-
2026-06-09days on market $199,900 Active 90 DOM
-
2026-06-08days on market $199,900 Active 89 DOM
-
2026-06-07pricedays on market $199,900 Active 88 DOM
-
2026-06-04days on market $229,900 Active 85 DOM
-
2026-06-03days on market $229,900 Active 84 DOM
-
2026-06-02days on market $229,900 Active 83 DOM
-
2026-06-01days on market $229,900 Active 82 DOM
-
2026-05-31days on market $229,900 Active 81 DOM
-
2026-03-11$229,900 Active 431-char remark
Show marketing remark (431 chars)
Welcome HOME!! This 3-bedroom, 1 Full Bath and half Bath, Single-Story HOME, is nestled in a Quiet Neighborhood in the HEART of Downtown Denton, TX. This CHARMING OASIS has a SPACIOUS living area, Plus a Dining Area. Great Location*NEAR UNT, SHOPPING, DINING, AND ENTERTAINMENT, with nearby jogging and biking trails. Priced to Sell*Schedule an appointment, BEFORE IT IS GONE! Buyer and Buyer's Agent to Verify all information.
-
2025-08-21historical
-
2025-06-05$250,000 Active
-
2010-09-03soldstatus
-
1993-09-08soldstatus
-
1992-06-29soldstatus
ⓘ Source: listings_history table (triggers on properties + properties_extension) + one-shot
backfill from property_details.listing_events for pre-trigger history.
Tax reassessment forecast TX · Resets to sale price
- Current annual tax
- $2,771 · $231/mo
- Projected year-2 tax
- $3,658 · $305/mo
- Expected delta
- +$887/yr (+$74/mo · 32.0%)
ⓘ Screening estimate from a state-policy table — verify with the county assessor before closing.
Climate risk First Street
- Flood 7/10 Severe FEMA zone X (unshaded) · 99% chance over 30 yrs
- Wildfire 4/10 Moderate
- Heat 7/10 Severe 7 d/yr ≥109°F today · 21 d/yr by 30 yrs out
- Wind 4/10 Moderate 24% chance of damaging wind over 30 yrs
- Air quality 4/10 Moderate 4 unhealthy d/yr today · 5 by 30 yrs out
Nearby sold comps map
Loading sold comps map…
Walkable amenities ~0.75 mi
Loading nearby amenities…
Taxation est. · year 1
- Rental income
- $20,707
- − Mortgage interest
- −$11,198
- − Property taxes
- −$2,771
- − Insurance
- −$1,797
- − Repairs & maintenance
- −$1,657
- − Management
- −$1,657
- − Depreciation
- −$5,815
- Taxable loss
- −$4,187
- Est. tax savings @ 24.0%
- +$1,005
- After-tax cash flow
- $216/yr
For passive investors: Depreciation is non-cash, so a rental often shows a tax loss while cash-flowing — sheltering income. Rental losses are passive: they offset passive income freely, and up to $25,000/yr can offset ordinary (W-2) income if you actively participate and your MAGI is under $100k (phasing out to $0 by $150k); unused losses carry forward. On sale, claimed depreciation is recaptured at up to 25%, and gains may owe capital-gains tax (a 1031 exchange can defer both). Figures are a year-1 estimate at your 24.0% rate — not tax advice; consult a CPA.
Schools (NCES district)
- District
- Denton ISD
- NCES district ID
- 4816740
- Math proficiency
- 36% ▼ -18.00%
- Reading proficiency
- 43% ▼ -9.00%
- Median HH income
- $58,913
- Composite
- 34.91/100
- National rank
- #5075
- State rank
- #383 of 826 in TX
Livability — Denton
- Score
- 88/100
- State rank
- #2
- US rank
- #210
Category grades
Schools grade is shown separately in the Schools card above.
Census & demographics
- Census place
- Denton, TX
- County
- Denton County · 901,654 people
- City population
- 127,990
- Metro
- Dallas-Fort Worth-Arlington, TX
- Population (ZIP)
- 27,982
- Household income
- $75,069
- Rent vs Own
- Severe rent burden
- 1815.0
Population outlook (Denton County) Hauer SSP2
- Today (2025)
- 1,053,010 people
- By 2030
- 1,192,269 · +13.2%
- By 2040
- 1,472,920 · +39.9%
- By 2050
- 1,746,506 · +65.9%
- By 2075
- 2,358,497 · +124.0%
- By 2100
- 2,779,183 · +163.9%
Race, ethnicity, and origin ACS 2023
- Neighborhood character
- Diverse neighborhood (Simpson 0.62)
- Race & ethnicity
- White 50% Hispanic / Latino 33% Two or more races 18% Black 10% Asian 2%
- Hispanic origin (detail)
- Mexican 22% Puerto Rican 2%
- Common ancestry
- Lithuanian 3% Serbian 2% Slovak 2%
- Foreign-born
- 15% · Canada
- Languages at home
- 74% English-only · Spanish 23% Arabic 1% Chinese 1%
Political lean MEDSL · Denton
- 2024 margin
- R (+13.2) · D 42.7% · R 55.8% · Other 1.5%
- 2008→2024 swing
- +11.0pp toward D · 2008: -24.2pp · 2024: -13.2pp
- All cycles
- 2024: R+13.2 2020: R+8.1 2016: R+20.2 2012: R+31.7 2008: R+24.2
Not yet ingested
- Civics
- —
Market trends
- HPI YoY
- ▼ -174.53%
- Current HPI
- 310.6124
- Rent YoY
- ▼ -6.91%
- Metro
- Dallas-Fort Worth-Arlington, TX
- State GDP YoY
- ▲ 3.95%
- F500 in state
- 110
Industry mix (Fortune 500 HQ in TX)
| Industry | F500 HQs | Revenue |
|---|---|---|
| Energy | 16 | $1,198B |
|
||
| Technology | 5 | $198B |
|
||
| Engineering / Construction | 4 | $72B |
|
||
| Energy Services | 3 | $60B |
|
||
| Utilities | 3 | $41B |
|
||
| Healthcare | 2 | $330B |
|
||
Price history
-8.0% since first listed6 events — show timeline
- 2026-03-11 Listed $229,900 NTREIS
- 2025-08-21 Listing Removed — NTREIS
- 2025-06-05 Listed $250,000 NTREIS
- 2010-09-03 Sold (Public Records) — Public Records
- 1993-09-08 Sold (Public Records) — Public Records
- 1992-06-29 Sold (Public Records) — Public Records
Property tax history
+3.0%/yrLatest (2025): $2,771 · -2.2% YoY. Source: county tax records.
Cash-flow waterfall
monthlySold comps — $/sqft
last 12 mo · ≤1 miLoading sold comps…