 Duplex
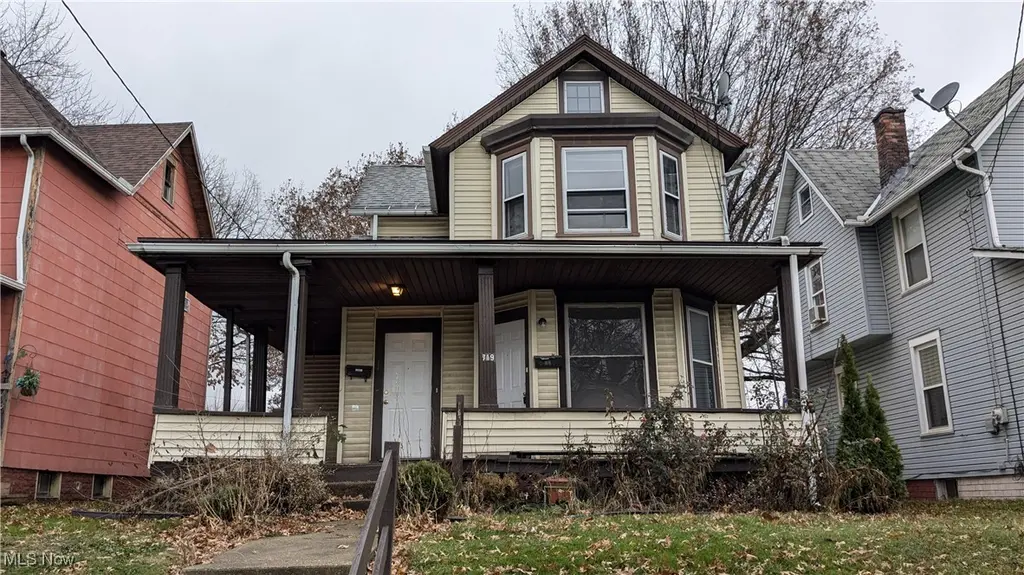
719 Prospect Ave SW · Canton, OH
Flood risk 1/10 · Minimal
- FEMA flood zone
- X (unshaded)
- Chance of flooding over 30 yrs
- 0.0%
- Est. flood insurance / yr
- $473 – $860
Fire risk 1/10 · Minimal
- Est. fire insurance / yr
- $713 – $1,323
Heat risk 3/10 · Minor
- Hot days now (above 96°F)
- 7 days/yr
- Hot days in 30 yrs
- 17 days/yr
Wind risk 1/10 · Minimal
- Chance of severe wind over 30 yrs
- —
Air-quality risk 2/10 · Minimal
- Unhealthy air days now
- 0 days/yr
- Unhealthy air days in 30 yrs
- 1 days/yr
Risk factors via First Street. Map © Google.
Why this score? — see what drove the C+ grade
The composite is a weighted blend of 9 inputs, each scored 0–100. Each bar is that input's sub-score; the figure is the points it added to the 100-point composite (weight × sub-score).
- Cash flow +30.0/30.0
- DSCR +10.0/10.0
- 1% rule +9.8/10.0
- Livability +3.6/5.0
- Rent growth +2.5/5.0
- Condition / age +2.5/5.0
- Schools +1.7/10.0
- ARV discount +0.0/15.0
- Appreciation +0.0/10.0
$115,000
🖨 Deal sheet 📄 Offer letter ✓ Due diligence
Multi-family units
County records classify this as Multi-Family (2-4 Unit). Listing-text estimate: 2 units. confirmed
Listing remarks MLS
Investment opportunity! Turnkey Canton Duplex up for grabs. One unit occupied, One unit vacant. Featuring 2 / 2 bedrooms 1 bath units. Each unit has separate furnace and hot water tank and is separately metered for all Utilities, including water. Grab your favorite Realtor and check this one out today.
Key facts
- 5,601 sq ft lot
- Built 1888
- Listed 316 days
Neighborhood map
What this means for you Summary
Snapshot
- This is a 2 × 2-bed/1.0-bath units multifamily listed at $115k.
Deal economics
- At list price, monthly cash flow is $589 ($7k/yr) — positive. Per door: $295/mo.
- The deal already cash-flows at list — no discount required.
- Meets the 1% rule at list price ($2k rent vs $115k).
- Recommended offer: $101k (12.0% below list) — sets the bar for market timing.
- Cap rate 12.4% vs local median 5.1% in Canton — top-decile yield for the area; either an underpriced asset or a hidden risk that comps aren't pricing in. Stress-test before assuming the spread holds.
Location & tenants
- Location reads 71/100 on livability (#441 in OH) — a middle-class / working-renter tenant base. Strengths: commute A+, cost of living A+, housing A; Watch: crime F, employment F.
- Canton City (urban): math 17% / reading 26% proficiency, ranked #627 of 656 in OH (top 96%) — low school quality limits family demand, transient renter base, plan for 1-2y turnover; 76% free/reduced lunch — lower-income household profile, screen leases tightly.
- Market conditions: 87 active listings in the ZIP; 16 comparable units currently listed for rent nearby; rentals at typical pace (median 21d on market — plan ~3-4 weeks tenant-placement turnaround); 528 units permitted in Stark County in 2024 (84 in 5+ unit buildings).
- This rent runs 35% of the median local income ($58k/yr) — at the standard rent-burdened threshold; future hikes will face affordability resistance.
Forward outlook
- Local home prices are declining (-3.0%/yr); year-one equity from $795 of loan paydown is wiped out by about $3k of value loss. Plan a longer hold.
- Stark County population projected to shrink 8% by 2050 — rents likely to lag national; underwrite the cash flow, not the appreciation.
- At projected returns (-3.0% appreciation + 3.0% rent growth), your $32k cash investment doubles in ~6 years — after that, you're playing with house money.
Negotiation context
- It's been on market 316 days — a 12% lower offer ($101k) is reasonable based on typical stale-listing flexibility.
- 5 sale attempts since 22y ago with the ask held roughly flat each time — persistent listings suggest the price (not the market) is what's stuck; bring a comps-based counter.
- Current owner paid $55k; list at $115k implies a 109% gain — meaningful room to come down on a strong offer.
Risks & watch-outs
- Watch-outs: built in 1888 — expect roof / HVAC / electrical / plumbing capex.
Questions for the listing agent
- It's been on market 316 days. Have you received any prior offers? Is the seller open to a 12% concession, seller financing, or rate buy-down credit?
- Can we see the unit-by-unit rent roll, current vacancy, and any below-market leases? What's the average tenancy length?
- What capital expenditures (roof, boiler, parking lot, exteriors) have been made in the last 5 years, and what's planned in the next 2?
- Built in 1888 — when were the roof, HVAC, electrical panel, plumbing, and water heater last replaced?
- Why hasn't it sold? Are there any deal-killer items the seller is aware of (foundation, flood, title, zoning, code violations)?
- Is there a deadline driving the sale (1031 exchange, divorce, estate, relocation)? That informs how much negotiation room exists.
- Crime grade is F in this area — have there been break-ins, vandalism, or insurance claims at this property in the last 3 years? What carrier currently insures it and at what premium?
- What's the average days-on-market for RENTAL listings here right now (not sales)? A rising rental-DOM trend means longer vacancies and softer asking-rent achievability than the comps imply.
- What's the recent tenant-quality profile in this submarket — average credit score on applications, eviction rate, late-payment / NSF rate, and stable-employment percentage? A property-management company in the area should have these aggregated.
- How much new apartment / multifamily construction is in the pipeline within 1–3 miles? Heavy new supply (>2% of stock underway) typically softens rents 12–24 months out; light construction supports rent growth.
Investment metrics
- 1% rule
- 1.48% ✓
- Cap rate
- 12.44%
- Cash-on-cash
- 21.96%
- DSCR
- 1.98
- GRM
- 5.6
CMA / ARV
- ARV (median comp)
- $85,020
- List price
- $115,000
- Delta
- 35.26%
- Verdict
- OVERPRICED
- Comps
- 20 within 1.0 mi
Show comp detail 8 sales within ~0.75 mi
| Address | Dist | Beds/Ba | Sqft | Sold | Price | $/sf | Match |
|---|---|---|---|---|---|---|---|
| 924 Prospect Ave SW | 0.11mi | 3/2.0 (-1) | 1,664 (-1%) | 9mo | $70,000 | $42 | 82 |
| 706 Dueber Ave SW | 0.10mi | 3/2.0 (-1) | 1,576 (-6%) | 9mo | $70,000 | $44 | 73 |
| 1001 Harrison Ave SW | 0.35mi | 3/2.0 (-1) | 1,688 (+1%) | 7mo | $126,000 | $75 | 72 |
| 1002 Dartmouth Ave SW | 0.68mi | 5/2.0 (+1) | 1,780 (+6%) | 2mo | $117,000 | $66 | 51 |
| 2318 9th St SW | 0.45mi | 4/2.5 | 1,781 (+6%) | 18mo | $55,000 | $31 | 51 |
| 514 Lawn Ave NW | 0.67mi | 4/2.0 | 1,758 (+5%) | 12mo | $70,000 | $40 | 51 |
| 2515 Grigsby Pl SW | 0.58mi | 3/2.0 (-1) | 1,516 (-10%) | 3mo | $90,000 | $59 | 50 |
| 1033 Monnot Pl NW | 0.73mi | 4/2.0 | 1,440 (-14%) | 7mo | $72,000 | $50 | 36 |
Match score weights: distance 35% · size 25% · config 20% · recency 20%. Top-matched comps best support the ARV.
Projected returns pro-forma
-3.0% appreciation · 3.0% rent growth · sell at horizon
- IRR
- 14.6%
- Equity multiple
- 1.59×
- Total profit
- $18,889
- Equity at exit
- $17,147
- IRR
- 23.4%
- Equity multiple
- 3.01×
- Total profit
- $64,768
- Equity at exit
- $9,943
Cash invested: $32,200 (down + closing). Projections, not guarantees.
Landlord ↔ Tenant lean methodology
- Overall (STATE)
- 73 Landlord-Friendly
- State Ohio
- 73 Landlord-Friendly · R+6
- County
- — inherits STATE
- City
- — inherits STATE
ZIP-level market 44706
- Active inventory
- 87
- Price-to-rent
- 11.3×
Monthly cashflow live
- Estimated rent
- $1,701 high interval (Pro) →
- Mortgage (P&I)
- −$603
- Tax from tax record
- −$104 /mo · $1,244/yr
- Insurance
- −$48
- HOA
- −$0
- Vacancy / Maint / Mgmt
- −$357
- Net cashflow
- $589
Break-even live
2-unit breakdown (identical units grouped — click to expand)
| Units | Beds | Baths | Est. rent |
|---|---|---|---|
| 2× units | 2 | 1 | $1,702 |
| #1 | 2 | 1 | $851 |
| #2 | 2 | 1 | $851 |
| Total (2 units) | $1,701 | ||
UW: 25.0% down · 7.5% · 30yr · 1.5% tax · 5.0% vac · 8.0% maint · 8.0% mgmt
Financing live
Cash to close
- Down payment
- $28,750
- Closing costs
- $3,450
- Reserves months
- —
- Total cash needed
- —
Loan-product check · same deal, 3 products live
Conventional
25% down · 7.5% · 30yr
- Down + closing
- —
- Monthly P&I
- —
- Monthly cashflow
- —
- DSCR
- —
- Eligible?
- —
Personal DTI + credit; lowest rate.
DSCR
20% down · 8.5% · 30yr
- Down + closing
- —
- Monthly P&I
- —
- Monthly cashflow
- —
- DSCR
- —
- Eligible?
- —
No personal income docs; deal must DSCR.
Hard money
10% down · 12.0% · 12mo
- Down + closing
- —
- Monthly P&I
- —
- Monthly cashflow
- —
- DSCR
- —
- Eligible?
- —
Short-term bridge; refi at stabilization.
Rent comps 16 comps
| Address | Beds | Baths | Sqft | Rent | $/sqft | DOM | Units | Dist |
|---|---|---|---|---|---|---|---|---|
| 1023 Harrison Ave SW Canton, OH | 3.0 | 1.0 | 1224 | $1,250 | $1.02 | 20d | 1 | 0.37mi |
| 1100 5th St SW Canton, OH | 4.0 | 1.0 | 1397 | $1,200 | $0.86 | 43d | 1 | 0.44mi |
| 2306 6th St SW Canton, OH | 4.0 | 1.5 | 2086 | $1,200 | $0.58 | 20d | 1 | 0.45mi |
| 1117 Arlington Ave SW Canton, OH | 3.0 | 1.0 | 1240 | $1,200 | $0.97 | 13d | 1 | 0.53mi |
| 2316 2nd St SW Canton, OH | 3.0 | 1.0 | 1125 | $1,095 | $0.97 | 43d | 1 | 0.53mi |
| 1016 2nd St NW Canton, OH | 1.0–3.0 | 1.0–2.0 | 916 | $1,050 | $1.15 | 13d | 20 | 0.65mi |
| 1241 Bedford Ave SW Canton, OH | 3.0 | 2.0 | 1152 | $1,200 | $1.04 | 13d | 1 | 0.68mi |
| 1507 Stark Ave SW Canton, OH | 3.0 | 1.0 | 1188 | $975 | $0.82 | 43d | 1 | 0.76mi |
| 1137 7th St NW Canton, OH | 3.0 | 1.0 | 1736 | $1,095 | $0.63 | 43d | 1 | 0.81mi |
| 900 Roslyn Ave SW Canton, OH | 3.0 | 1.0 | 1320 | $1,175 | $0.89 | 13d | 1 | 1.07mi |
| 1014 Roslyn Ave SW Canton, OH | 3.0 | 1.0 | 1128 | $1,150 | $1.02 | 20d | 1 | 1.08mi |
| 2510 10th St NW Canton, OH | 3.0 | 1.5 | 1468 | $1,175 | $0.80 | 20d | 1 | 1.08mi |
| 1005 Broad Ave NW Unit 201 Canton, OH | 3.0 | 1.0 | 1200 | $800 | $0.67 | 20d | 1 | 1.20mi |
| 1216 14th St NW Canton, OH | 3.0 | 1.0 | 1352 | $1,100 | $0.81 | 20d | 1 | 1.35mi |
| 1421 Piper Ct NW Canton, OH | 3.0 | 1.5 | 1311 | $995 | $0.76 | 20d | 1 | 1.39mi |
| 1008 14th St NW Canton, OH | 3.0 | 1.5 | 1100 | $898 | $0.82 | 20d | 1 | 1.40mi |
Listing history 28 events
-
2026-06-18days on market $115,000 Active 316 DOM
-
2026-06-17days on market $115,000 Active 315 DOM
-
2026-06-16days on market $115,000 Active 314 DOM
-
2026-06-15days on market $115,000 Active 313 DOM
-
2026-06-14days on market $115,000 Active 311 DOM
-
2026-06-13days on market $115,000 Active 310 DOM
-
2026-06-10days on market $115,000 Active 308 DOM
-
2026-06-09days on market $115,000 Active 307 DOM
-
2026-06-08days on market $115,000 Active 306 DOM
-
2026-06-07days on market $115,000 Active 305 DOM
-
2026-06-05days on market $115,000 Active 302 DOM
-
2026-06-03days on market $115,000 Active 301 DOM
-
2026-06-02days on market $115,000 Active 300 DOM
-
2026-06-01days on market $115,000 Active 299 DOM
-
2026-05-31days on market $115,000 Active 298 DOM
-
2026-05-30days on market $115,000 Active 297 DOM
-
2025-08-05$115,000 Active 303-char remark
Show marketing remark (303 chars)
Investment opportunity! Turnkey Canton Duplex up for grabs. One unit occupied, One unit vacant. Featuring 2 / 2 bedrooms 1 bath units. Each unit has separate furnace and hot water tank and is separately metered for all Utilities, including water. Grab your favorite Realtor and check this one out today.
-
2023-10-05soldstatus $55,000 Closed 216-char remark
Show marketing remark (216 chars)
Great turnkey investment property - is currently on month to month rent with no formal lease in place - separate electrical/ gas/ water meter/furnace and hot water tanks. Hot water tank for upstairs replaced in 2019.
-
2023-10-04soldstatus $55,000
-
2023-09-13status Pending 216-char remark
Show marketing remark (216 chars)
Great turnkey investment property - is currently on month to month rent with no formal lease in place - separate electrical/ gas/ water meter/furnace and hot water tanks. Hot water tank for upstairs replaced in 2019.
-
2023-09-07status Active 216-char remark
Show marketing remark (216 chars)
Great turnkey investment property - is currently on month to month rent with no formal lease in place - separate electrical/ gas/ water meter/furnace and hot water tanks. Hot water tank for upstairs replaced in 2019.
-
2023-08-29status Pending 216-char remark
Show marketing remark (216 chars)
Great turnkey investment property - is currently on month to month rent with no formal lease in place - separate electrical/ gas/ water meter/furnace and hot water tanks. Hot water tank for upstairs replaced in 2019.
-
2023-08-25$59,900 Active 216-char remark
Show marketing remark (216 chars)
Great turnkey investment property - is currently on month to month rent with no formal lease in place - separate electrical/ gas/ water meter/furnace and hot water tanks. Hot water tank for upstairs replaced in 2019.
-
2005-07-11historical
-
2005-03-06$59,900
-
2004-06-19historical
-
2004-03-19$59,900
-
1985-03-14soldstatus $14,000
ⓘ Source: listings_history table (triggers on properties + properties_extension) + one-shot
backfill from property_details.listing_events for pre-trigger history.
Tax reassessment forecast OH · Partial reset (capped growth)
- Current annual tax
- $1,244 · $104/mo
- Projected year-2 tax
- $1,519 · $127/mo
- Expected delta
- +$275/yr (+$23/mo · 22.1%)
ⓘ Screening estimate from a state-policy table — verify with the county assessor before closing.
Climate risk First Street
- Flood 1/10 Low FEMA zone X (unshaded) · 0% chance over 30 yrs
- Wildfire 1/10 Low
- Heat 3/10 Moderate 7 d/yr ≥96°F today · 17 d/yr by 30 yrs out
- Wind 1/10 Low
- Air quality 2/10 Low 0 unhealthy d/yr today · 1 by 30 yrs out
Nearby sold comps map
Loading sold comps map…
Walkable amenities ~0.75 mi
Loading nearby amenities…
Taxation est. · year 1
- Rental income
- $20,412
- − Mortgage interest
- −$6,442
- − Property taxes
- −$1,244
- − Insurance
- −$575
- − Repairs & maintenance
- −$1,633
- − Management
- −$1,633
- − Depreciation
- −$3,345
- Taxable income
- $5,540
- Est. tax owed @ 24.0%
- −$1,330
- After-tax cash flow
- $5,740/yr
For passive investors: Depreciation is non-cash, so a rental often shows a tax loss while cash-flowing — sheltering income. Rental losses are passive: they offset passive income freely, and up to $25,000/yr can offset ordinary (W-2) income if you actively participate and your MAGI is under $100k (phasing out to $0 by $150k); unused losses carry forward. On sale, claimed depreciation is recaptured at up to 25%, and gains may owe capital-gains tax (a 1031 exchange can defer both). Figures are a year-1 estimate at your 24.0% rate — not tax advice; consult a CPA.
Schools (NCES district)
- District
- Canton City
- NCES district ID
- 3904371
- Math proficiency
- 17% ▼ -17.00%
- Reading proficiency
- 26% ▼ -12.00%
- Median HH income
- $28,825
- Composite
- 17.1/100
- National rank
- #9116
- State rank
- #627 of 656 in OH
Livability — Canton
- Score
- 71/100
- State rank
- #441
- US rank
- #7259
Category grades
Schools grade is shown separately in the Schools card above.
Census & demographics
- Census place
- Canton, OH
- County
- Stark County · 272,865 people
- City population
- 103,614
- Metro
- Canton-Massillon, OH
- Population (ZIP)
- 16,496
- Household income
- $58,228
- Rent vs Own
- Severe rent burden
- 502.0
Population outlook (Stark County) Hauer SSP2
- Today (2025)
- 373,708 people
- By 2030
- 371,245 · -0.7%
- By 2040
- 361,331 · -3.3%
- By 2050
- 345,290 · -7.6%
- By 2075
- 302,669 · -19.0%
- By 2100
- 238,870 · -36.1%
Race, ethnicity, and origin ACS 2023
- Neighborhood character
- Predominantly White (84%)
- Race & ethnicity
- White 84% Black 8% Two or more races 6% Hispanic / Latino 3%
- Common ancestry
- Romanian 4% Italian 3% Lithuanian 2%
- Foreign-born
- 1% · Canada
- Languages at home
- 98% English-only · Spanish 2%
Political lean MEDSL · Stark
- 2024 margin
- Strong R (+21.9) · D 38.6% · R 60.5%
- 2008→2024 swing
- -27.4pp toward R · 2008: 5.5pp · 2024: -21.9pp
- All cycles
- 2024: R+21.9 2020: R+18.5 2016: R+17.4 2012: R+0.4 2008: D+5.5
Not yet ingested
- Civics
- —
Market trends
- HPI YoY
- ▼ -156.35%
- Current HPI
- 239.851
- Rent YoY
- —
- Metro
- Canton-Massillon, OH
- State GDP YoY
- ▲ 1.98%
- F500 in state
- 48
Industry mix (Fortune 500 HQ in OH)
| Industry | F500 HQs | Revenue |
|---|---|---|
| Insurance | 3 | $145B |
|
||
| Industrial Machinery | 3 | $49B |
|
||
| Financial Services | 3 | $24B |
|
||
| Consumer Goods | 2 | $93B |
|
||
| Aerospace / Defense | 2 | $47B |
|
||
| Utilities | 2 | $33B |
|
||
Price history
+721.4% since first listed12 events — show timeline
- 2025-08-05 Listed $115,000 MLSNOW
- 2023-10-05 Sold (MLS) $55,000 MLSNOW
- 2023-10-04 Sold (Public Records) $55,000 Public Records
- 2023-09-13 Pending — MLSNOW
- 2023-09-07 Relisted — MLSNOW
- 2023-08-29 Pending — MLSNOW
- 2023-08-25 Listed $59,900 MLSNOW
- 2005-07-11 Listing Removed — MLSNOW
- 2005-03-06 Listed $59,900 MLSNOW
- 2004-06-19 Listing Removed — MLSNOW
- 2004-03-19 Listed $59,900 MLSNOW
- 1985-03-14 Sold (Public Records) $14,000 Public Records
Property tax history
+7.4%/yrLatest (2024): $1,244 · +99.2% YoY. Source: county tax records.
Cash-flow waterfall
monthlySold comps — $/sqft
last 12 mo · ≤1 miLoading sold comps…