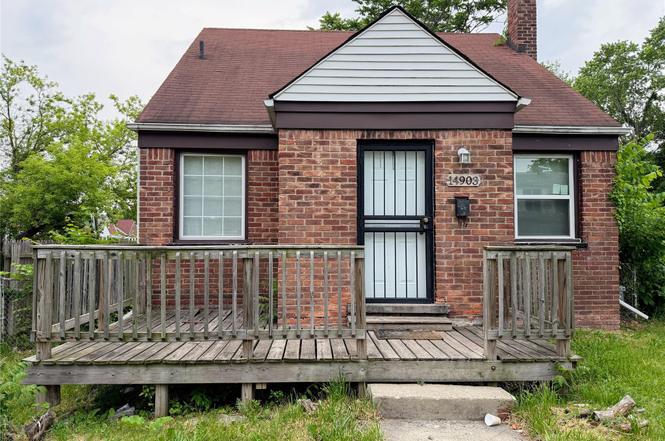
14903 Woodmont Ave · Detroit, MI
Flood risk 1/10 · Minimal
- FEMA flood zone
- X (unshaded)
- Chance of flooding over 30 yrs
- 0.0%
- Est. flood insurance / yr
- $473 – $860
Fire risk 1/10 · Minimal
- Est. fire insurance / yr
- $784 – $1,456
Heat risk 3/10 · Minor
- Hot days now (above 98°F)
- 7 days/yr
- Hot days in 30 yrs
- 15 days/yr
Wind risk 2/10 · Minimal
- Chance of severe wind over 30 yrs
- —
Air-quality risk 3/10 · Minor
- Unhealthy air days now
- 2 days/yr
- Unhealthy air days in 30 yrs
- 5 days/yr
Risk factors via First Street. Map © Google.
Why this score? — see what drove the C- grade
The composite is a weighted blend of 9 inputs, each scored 0–100. Each bar is that input's sub-score; the figure is the points it added to the 100-point composite (weight × sub-score).
- Cash flow +18.6/30.0
- 1% rule +7.9/10.0
- ARV discount +7.5/15.0
- DSCR +5.8/10.0
- Rent growth +3.9/5.0
- Livability +3.7/5.0
- Condition / age +2.5/5.0
- Schools +1.3/10.0
- Appreciation +0.0/10.0
$100,000
🖨 Deal sheet (PDF) 📄 Offer letter ✓ Due diligence
Listing remarks MLS
Welcome to 14903 Woodmont Avenue, a home that feels warm and inviting from the moment you step onto the front porch. Nestled on a quiet corner lot on Detroit's northwest side, this classic brick bungalow has been lovingly updated to balance its original charm with everything you need for modern life. Inside, the sunlit living room features beautifully refinished hardwood floors, making it the perfect spot to gather with family or unwind after a long day. You will love cooking in the bright eat-in kitchen, while the updated bathroom offers a cozy, relaxing space to recharge. Behind the scenes, the home offers ultimate peace of mind with brand-new, energy-efficient vinyl windows that keep your utility bills low, alongside completely updated PEX plumbing throughout the entire house. With three comfortable bedrooms - including a spacious upper-level retreat that feels like your own private getaway - and a full basement ready for your ideas, this home is truly ready for you to move right in and start making your own memories.
Key facts
- Quiet corner lot
- Front porch
- Updated bathroom
Tags
Property features AI
Finance
- Other: Property classified as residential; Lot approximately 0.12 acres (35 x 150)
- HOA & community: Sidewalks; Pets allowed
Exterior
- Parking: No garage
- Utilities: Public water; Public sewer
- Home design: Single-family residence; One and one-half stories; Ground-level entry; Brick construction
- Construction: Asphalt roof; Block foundation
- Exterior features: Porch; Back yard fencing (fenced); Corner lot; Paved road access
Interior
- Kitchen: Stainless steel appliances; Free-standing refrigerator; Free-standing freezer
- Bedrooms: 5 total rooms (includes bedrooms and living spaces)
- Bathrooms: 1 full bathroom
- Heating & cooling: Forced air heating; Natural gas heating; No central cooling
- Interior features: ENERGY STAR qualified windows; Lighting; Therapeutic whirlpool
- Laundry & utility: Gas water heater
Neighborhood map
What this means for you Summary
Snapshot
- This is a 3-bed/1.0-bath single-family listed at $100k.
Deal economics
- At list price, monthly cash flow is $97 ($1k/yr) — positive.
- The deal already cash-flows at list — no discount required.
- Meets the 1% rule at list price ($1k rent vs $100k).
- Cap rate 7.5% vs local median 10.1% in Detroit — below-typical yield; the buyer is paying a premium for something (appreciation thesis, condition, location) that the cap rate doesn't capture.
Location & tenants
- Location reads 73/100 on livability (#218 in MI) — a middle-class / working-renter tenant base. Strengths: amenities A+, commute A+, cost of living A+; Watch: schools F, crime F, employment F.
- Detroit Public Schools Community District (urban): math 10% / reading 24% proficiency, ranked #499 of 540 in MI (top 92%) — low school quality limits family demand, transient renter base, plan for 1-2y turnover; 90% free/reduced lunch — lower-income household profile, screen leases tightly.
- Market conditions: Rents rising fast (+5.6%/yr); 391 active listings in the ZIP; 40 comparable units currently listed for rent nearby; rentals at typical pace (median 22d on market — plan ~3-4 weeks tenant-placement turnaround); lower-income renter base — watch delinquency; 2,639 units permitted in Wayne County in 2024 (1,216 in 5+ unit buildings).
- This rent runs 42% of the median local income ($37k/yr) — at the standard rent-burdened threshold; future hikes will face affordability resistance.
Forward outlook
- Local home prices are declining (-3.0%/yr); year-one equity from $691 of loan paydown is wiped out by about $3k of value loss. Plan a longer hold.
- Wayne County population projected at -17% by 2050 — secular population decline; favor cash flow + early exit over multi-decade hold.
Negotiation context
- Only 11 days on market — expect competitive offers; lowballing is unlikely to land.
- 20 sale attempts since 12y ago with the ask held roughly flat each time — persistent listings suggest the price (not the market) is what's stuck; bring a comps-based counter.
- Current owner paid $53k; list at $100k implies a 88% gain — meaningful room to come down on a strong offer.
Risks & watch-outs
- Watch-outs: property tax is 4.3% of price; built in 1950 — expect roof / HVAC / electrical / plumbing capex.
Questions for the listing agent
- Built in 1950 — when were the roof, HVAC, electrical panel, plumbing, and water heater last replaced?
- Property tax is high relative to price — has the assessment been appealed recently, and will the sale trigger a re-assessment?
- Is there a deadline driving the sale (1031 exchange, divorce, estate, relocation)? That informs how much negotiation room exists.
- Schools are F-rated, which usually means shorter tenancies and higher turnover. Who's the typical renter profile here, and what's been the actual vacancy rate?
- Crime grade is F in this area — have there been break-ins, vandalism, or insurance claims at this property in the last 3 years? What carrier currently insures it and at what premium?
- What's the average days-on-market for RENTAL listings here right now (not sales)? A rising rental-DOM trend means longer vacancies and softer asking-rent achievability than the comps imply.
- What's the recent tenant-quality profile in this submarket — average credit score on applications, eviction rate, late-payment / NSF rate, and stable-employment percentage? A property-management company in the area should have these aggregated.
- How much new for-sale + rental construction is in the pipeline within 1–3 miles? Heavy new supply typically softens prices + rents 12–24 months out; constrained supply supports both.
Investment metrics
- 1% rule
- 1.29% ✓
- Cap rate
- 7.45%
- Cash-on-cash
- 4.15%
- DSCR
- 1.18
- GRM
- 6.5
CMA / ARV
- ARV (on-the-fly)
- $61,230
- Comps found
- 12
Show comp detail 12 sales within ~0.75 mi
| Address | Dist | Beds/Ba | Sqft | Sold | Price | $/sf | Match |
|---|---|---|---|---|---|---|---|
| 15324 Murray Hill St | 0.25mi | 3/1.0 | 959 (+2%) | 11mo | $125,000 | $130 | 76 |
| 15454 Asbury Park | 0.36mi | 3/1.5 | 956 (+2%) | 5mo | $149,000 | $156 | 75 |
| 16342 Ellsworth St | 0.12mi | 3/1.5 | 1,064 (+13%) | 7mo | $43,000 | $40 | 65 |
| 14781 Saint Marys St | 0.16mi | 3/1.0 | 1,054 (+12%) | 8mo | $68,000 | $65 | 65 |
| 15300 Asbury Park Park | 0.20mi | 3/1.0 | 1,052 (+12%) | 7mo | $58,500 | $56 | 65 |
| 15751 Biltmore St | 0.49mi | 3/1.0 | 1,000 (+6%) | 5mo | $119,000 | $119 | 63 |
| 15328 Prevost St | 0.41mi | 3/1.0 | 1,009 (+7%) | 10mo | $89,900 | $89 | 61 |
| 15808 Southfield Rd | 0.71mi | 3/1.0 | 1,000 (+6%) | 8mo | $45,000 | $45 | 50 |
| 15421 Prest St | 0.67mi | 3/1.0 | 1,024 (+9%) | 9mo | $62,000 | $61 | 47 |
| 15452 Southfield Rd | 0.56mi | 2/1.0 (-1) | 846 (-10%) | 11mo | $51,000 | $60 | 43 |
| 15496 Winthrop St | 0.63mi | 3/1.0 | 1,073 (+14%) | 8mo | $52,000 | $48 | 41 |
| 14314 Southfield Fwy | 0.64mi | 2/1.0 (-1) | 827 (-12%) | 13mo | $125,000 | $151 | 34 |
Match score weights: distance 35% · size 25% · config 20% · recency 20%. Top-matched comps best support the ARV.
Projected returns pro-forma
-3.0% appreciation · 5.59% rent growth · sell at horizon
- IRR
- -6.0%
- Equity multiple
- 0.77×
- Total profit
- $-6,427
- Equity at exit
- $14,910
- IRR
- 7.4%
- Equity multiple
- 1.64×
- Total profit
- $17,931
- Equity at exit
- $8,646
Cash invested: $28,000 (down + closing). Projections, not guarantees.
Landlord ↔ Tenant lean methodology
- Overall (STATE)
- 62 Landlord-Friendly
- State Michigan
- 62 Landlord-Friendly · EVEN
- County
- — inherits STATE
- City
- — inherits STATE
ZIP-level market 48227
- Rents YoY
- 5.6%
- Active inventory
- 391
- Price-to-rent
- 6.5×
Monthly cashflow live
- Estimated rent
- $1,291 high interval (Pro) →
- Mortgage (P&I)
- −$524
- Tax from tax record
- −$357 /mo · $4,282/yr
- Insurance
- −$42
- HOA
- −$0
- Vacancy / Maint / Mgmt
- −$271
- Net cashflow
- $97
Break-even live
Sensitivity live
| Price | -10% $153 | -5% $125 | +0% $97 | +5% $68 | +10% $40 |
|---|---|---|---|---|---|
| Rent | -10% $-5 | -5% $46 | +0% $97 | +5% $148 | +10% $199 |
| Rate | -1.0pp $147 | -0.5pp $122 | base $97 | +0.5pp $71 | +1.0pp $45 |
UW: 25.0% down · 7.5% · 30yr · 1.5% tax · 5.0% vac · 8.0% maint · 8.0% mgmt
Financing live
Cash to close
- Down payment
- $25,000
- Closing costs
- $3,000
- Reserves months
- —
- Total cash needed
- —
Loan-product check · same deal, 3 products live
Conventional
25% down · 7.5% · 30yr
- Down + closing
- —
- Monthly P&I
- —
- Monthly cashflow
- —
- DSCR
- —
- Eligible?
- —
Personal DTI + credit; lowest rate.
DSCR
20% down · 8.5% · 30yr
- Down + closing
- —
- Monthly P&I
- —
- Monthly cashflow
- —
- DSCR
- —
- Eligible?
- —
No personal income docs; deal must DSCR.
Hard money
10% down · 12.0% · 12mo
- Down + closing
- —
- Monthly P&I
- —
- Monthly cashflow
- —
- DSCR
- —
- Eligible?
- —
Short-term bridge; refi at stabilization.
Rent comps 40 comps
| Address | Beds | Baths | Sqft | Rent | $/sqft | DOM | Units | Dist |
|---|---|---|---|---|---|---|---|---|
| 14753 Saint Marys St Detroit, MI | 2.0 | 1.0 | 900 | $1,150 | $1.28 | 6d | 1 | 0.19mi |
| 14753 Saint Marys St Detroit, MI | 2.0 | 1.0 | 900 | $1,150 | $1.28 | 13d | 1 | 0.19mi |
| 15065 Gilchrist St Detroit, MI | 3.0 | 1.0 | 1100 | $1,250 | $1.14 | 45d | 1 | 0.20mi |
| 14836 Rutherford St Unit 2 Detroit, MI | 2.0 | 1.0 | 1104 | $950 | $0.86 | 45d | 1 | 0.30mi |
| 14535 Mettetal St Unit 1 Detroit, MI | 2.0 | 1.0 | 965 | $1,000 | $1.04 | 45d | 1 | 0.31mi |
| 14716 Archdale St Detroit, MI | 2.0 | 1.0 | 900 | $1,100 | $1.22 | 45d | 1 | 0.39mi |
| 15375 Prevost St Detroit, MI | 4.0 | 1.0 | 907 | $1,300 | $1.43 | 18d | 1 | 0.40mi |
| 15736 Biltmore St Detroit, MI | 3.0 | 1.5 | 1000 | $1,200 | $1.20 | 18d | 1 | 0.45mi |
| 14893 Prest St Detroit, MI | 3.0 | 1.0 | 1100 | $1,000 | $0.91 | 16d | 1 | 0.58mi |
| 15100 Whitcomb St Detroit, MI | 2.0 | 1.0 | 750 | $925 | $1.23 | 45d | 1 | 0.68mi |
| 14814 Sussex St Unit 2 Detroit, MI | 3.0 | 1.0 | 1100 | $1,000 | $0.91 | 45d | 1 | 0.75mi |
| 15468 Sussex St #2 Detroit, MI | 2.0 | 1.0 | 900 | $1,250 | $1.39 | 45d | 1 | 0.82mi |
| 15330 Coyle St Unit 1 Detroit, MI | 3.0 | 1.0 | 1000 | $1,375 | $1.38 | 25d | 1 | 0.82mi |
| 15330 Coyle St Unit 2 Detroit, MI | 3.0 | 1.0 | 1000 | $1,450 | $1.45 | 25d | 1 | 0.82mi |
| 15330 Coyle St Unit 1 Detroit, MI | 3.0 | 1.0 | 1000 | $1,425 | $1.43 | 13d | 1 | 0.82mi |
| 15328 Coyle St Detroit, MI | 3.0 | 1.0 | 1000 | $1,450 | $1.45 | 19d | 1 | 0.82mi |
| 15341 Lauder St Detroit, MI | 4.0 | 1.5 | 1080 | $1,475 | $1.37 | 18d | 1 | 0.92mi |
| 14264 Coyle St Detroit, MI | 2.0 | 1.0 | 1000 | $1,150 | $1.15 | 45d | 1 | 0.96mi |
| 13600 Southfield Fwy Detroit, MI | 2.0 | 1.0 | 848 | $1,100 | $1.30 | 6d | 1 | 1.00mi |
| 15073 Strathmoor St Detroit, MI | 2.0 | 1.0 | 860 | $1,350 | $1.57 | 18d | 1 | 1.08mi |
| 12840 Grandmont Ave Detroit, MI | 3.0 | 1.0 | 1100 | $1,200 | $1.09 | 45d | 1 | 1.11mi |
| 14559 Strathmoor St Detroit, MI | 2.0 | 1.0 | 1033 | $1,150 | $1.11 | 21d | 1 | 1.12mi |
| 13591 Faust Ave Detroit, MI | 2.0 | 1.0 | 1000 | $1,275 | $1.27 | 45d | 1 | 1.16mi |
| 12944 Rosemont Ave Detroit, MI | 2.0 | 1.0 | 800 | $1,050 | $1.31 | 6d | 1 | 1.16mi |
| 12941 Penrod St Detroit, MI | 2.0 | 1.0 | 1000 | $1,275 | $1.27 | 45d | 1 | 1.21mi |
| 12711 Grandmont Ave Detroit, MI | 3.0 | 1.0 | 1000 | $1,400 | $1.40 | 19d | 1 | 1.21mi |
| 17165 Prevost St Detroit, MI | 3.0 | 1.0 | 1060 | $2,400 | $2.26 | 3d | 1 | 1.26mi |
| 19431 Lyndon St Detroit, MI | 2.0 | 1.0 | 1000 | $1,275 | $1.27 | 45d | 1 | 1.28mi |
| 12950 Glastonbury Ave Detroit, MI | 3.0 | 1.0 | 1000 | $1,400 | $1.40 | 25d | 1 | 1.30mi |
| 12875 Faust Ave Detroit, MI | 2.0 | 1.0 | 735 | $1,200 | $1.63 | 6d | 1 | 1.30mi |
| 14347 Westwood St Detroit, MI | 2.0 | 1.0 | 706 | $1,200 | $1.70 | 25d | 1 | 1.30mi |
| 13514 Stahelin Ave Detroit, MI | 3.0 | 1.0 | 1000 | $1,400 | $1.40 | 19d | 1 | 1.31mi |
| 19050 W Davison St Detroit, MI | 3.0 | 1.0 | 1118 | $1,400 | $1.25 | 45d | 1 | 1.41mi |
| 13331 Strathmoor St Detroit, MI | 3.0 | 1.0 | 1084 | $1,100 | $1.01 | 18d | 1 | 1.42mi |
| 14284 Cruse St Detroit, MI | 3.0 | 1.0 | 1121 | $1,150 | $1.03 | 18d | 1 | 1.42mi |
| 15387 Lesure St Detroit, MI | 3.0 | 1.0 | 1064 | $1,350 | $1.27 | 13d | 1 | 1.44mi |
| 15519 Plainview Ave Detroit, MI | 3.0 | 1.0 | 900 | $1,396 | $1.55 | 18d | 1 | 1.45mi |
| 14903 Tracey St Detroit, MI | 3.0 | 1.0 | 1004 | $1,100 | $1.10 | 18d | 1 | 1.47mi |
| 14258 Plainview Ave Detroit, MI | 3.0 | 1.0 | 918 | $1,200 | $1.31 | 45d | 1 | 1.47mi |
| 15517 Lesure St Unit BDRM1A Detroit, MI | 2.0 | 1.0 | 1000 | $850 | $0.85 | 25d | 1 | 1.47mi |
Listing history 8 events
-
2026-06-21days on market $100,000 Active 11 DOM
-
2026-06-18days on market $100,000 Active 8 DOM
-
2026-06-17days on market $100,000 Active 7 DOM
-
2026-06-16days on market $100,000 Active 6 DOM
-
2026-06-15days on market $100,000 Active 5 DOM
-
2026-06-13days on market $100,000 Active 3 DOM
-
2026-06-13remarks 693-char remark
-
2026-06-13$100,000 Active 2 DOM
ⓘ Source: listings_history table (triggers on properties + properties_extension) + one-shot
backfill from property_details.listing_events for pre-trigger history.
Tax reassessment forecast MI · Partial reset (capped growth)
- Current annual tax
- $4,282 · $357/mo
- Projected year-2 tax
- $4,282 · $357/mo
- Expected delta
- $0/yr ($0/mo · 0.0%)
ⓘ Screening estimate from a state-policy table — verify with the county assessor before closing.
Climate risk First Street
- Flood 1/10 Low FEMA zone X (unshaded) · 0% chance over 30 yrs
- Wildfire 1/10 Low
- Heat 3/10 Moderate 7 d/yr ≥98°F today · 15 d/yr by 30 yrs out
- Wind 2/10 Low
- Air quality 3/10 Moderate 2 unhealthy d/yr today · 5 by 30 yrs out
Nearby sold comps map
Loading sold comps map…
Walkable amenities ~0.75 mi
Loading nearby amenities…
Taxation est. · year 1
- Rental income
- $15,489
- − Mortgage interest
- −$5,602
- − Property taxes
- −$4,282
- − Insurance
- −$500
- − Repairs & maintenance
- −$1,239
- − Management
- −$1,239
- − Depreciation
- −$2,909
- Taxable loss
- −$282
- Est. tax savings @ 24.0%
- +$68
- After-tax cash flow
- $1,229/yr
For passive investors: Depreciation is non-cash, so a rental often shows a tax loss while cash-flowing — sheltering income. Rental losses are passive: they offset passive income freely, and up to $25,000/yr can offset ordinary (W-2) income if you actively participate and your MAGI is under $100k (phasing out to $0 by $150k); unused losses carry forward. On sale, claimed depreciation is recaptured at up to 25%, and gains may owe capital-gains tax (a 1031 exchange can defer both). Figures are a year-1 estimate at your 24.0% rate — not tax advice; consult a CPA.
Schools (NCES district)
- District
- Detroit Public Schools Community District
- NCES district ID
- 2601103
- Math proficiency
- 10% ▼ -2.00%
- Reading proficiency
- 24% ▲ 6.00%
- Median HH income
- $25,815
- Composite
- 13.06/100
- National rank
- #9564
- State rank
- #499 of 540 in MI
Livability — Detroit
- Score
- 73/100
- State rank
- #218
- US rank
- #5427
Category grades
Schools grade is shown separately in the Schools card above.
Census & demographics
- Census place
- Detroit, MI
- County
- Wayne County · 1,562,939 people
- City population
- 572,865
- Metro
- Detroit-Warren-Dearborn, MI
- Population (ZIP)
- 40,302
- Household income
- $36,527
- Rent vs Own
- Severe rent burden
- 2371.0
Population outlook (Wayne County) Hauer SSP2
- Today (2025)
- 1,675,273 people
- By 2030
- 1,620,300 · -3.3%
- By 2040
- 1,502,341 · -10.3%
- By 2050
- 1,384,039 · -17.4%
- By 2075
- 1,124,592 · -32.9%
- By 2100
- 881,193 · -47.4%
Race, ethnicity, and origin ACS 2023
- Neighborhood character
- Predominantly Black (95%)
- Race & ethnicity
- Black 95% Two or more races 3% White 1%
- Foreign-born
- 1%
- Languages at home
- 98% English-only · Spanish 1% French/Haitian/Cajun 1%
Political lean MEDSL · Wayne
- 2024 margin
- Strong D (+29.0) · D 62.7% · R 33.7% · Other 3.6%
- 2008→2024 swing
- -20.5pp toward R · 2008: 49.5pp · 2024: 29.0pp
- All cycles
- 2024: D+29.0 2020: D+38.1 2016: D+37.3 2012: D+46.9 2008: D+49.5
Not yet ingested
- Civics
- —
Market trends
- HPI YoY
- ▼ -125.00%
- Current HPI
- 186.4158
- Rent YoY
- ▲ 5.59%
- Metro
- Detroit-Warren-Dearborn, MI
- State GDP YoY
- ▲ 1.37%
- F500 in state
- 28
Industry mix (Fortune 500 HQ in MI)
| Industry | F500 HQs | Revenue |
|---|---|---|
| Automotive Parts | 3 | $48B |
|
||
| Automotive | 2 | $372B |
|
||
| Chemicals | 1 | $45B |
|
||
| Automotive Retail | 1 | $29B |
|
||
| Healthcare / Medical Devices | 1 | $23B |
|
||
| Automotive Technology | 1 | $20B |
|
||
Price history
+900.0% since first listed65 events — show timeline
- 2026-06-10 Listed $100,000 REALCOMP
- 2026-06-10 Listed $100,000 MiRealSource-MiMLS
- 2025-10-28 Listing Removed — MiRealSource-MiMLS
- 2025-10-28 Listing Removed — REALCOMP
- 2025-07-05 Rental Removed $1,175 PROPERTYWARE
- 2025-06-22 Price Changed $1,175 PROPERTYWARE
- 2025-05-30 Price Changed $105,000 MiRealSource-MiMLS
- 2025-05-29 Price Changed $105,000 REALCOMP
- 2025-05-12 Listed $114,900 REALCOMP
- 2025-05-12 Listed $114,900 MiRealSource-MiMLS
- 2025-04-08 Listed for Rent $1,250 PROPERTYWARE
- 2025-03-22 Rental Removed $1,250 PROPERTYWARE
- 2025-02-21 Price Changed $1,250 PROPERTYWARE
- 2025-01-31 Listed for Rent $1,300 PROPERTYWARE
- 2024-12-05 Sold (MLS) $53,250 MiRealSource-MiMLS
- 2024-12-05 Sold (MLS) $53,250 SW Michigan MLS
- 2024-12-05 Sold (MLS) $53,250 REALCOMP
- 2024-11-13 Pending — MiRealSource-MiMLS
- 2024-11-13 Pending — REALCOMP
- 2024-11-13 Pending — SW Michigan MLS
- 2024-10-26 Contingent — REALCOMP
- 2024-10-26 Contingent — MiRealSource-MiMLS
- 2024-10-26 Contingent — SW Michigan MLS
- 2024-10-19 Relisted — REALCOMP
- 2024-10-19 Relisted — MiRealSource-MiMLS
- 2024-10-19 Relisted — SW Michigan MLS
- 2024-10-16 Contingent — REALCOMP
- 2024-10-16 Contingent — MiRealSource-MiMLS
- 2024-10-16 Contingent — SW Michigan MLS
- 2024-09-28 Listed $74,900 MiRealSource-MiMLS
- 2024-09-28 Listed $74,900 SW Michigan MLS
- 2024-09-28 Listed $74,900 REALCOMP
- 2022-06-02 Sold (Public Records) $47,500 Public Records
- 2022-05-20 Sold (MLS) $47,500 MiRealSource-MiMLS
- 2022-05-20 Sold (MLS) $47,500 REALCOMP
- 2022-05-18 Pending — MiRealSource-MiMLS
- 2022-05-18 Pending — REALCOMP
- 2022-04-19 Listed $54,900 MiRealSource-MiMLS
- 2022-04-19 Listed $54,900 REALCOMP
- 2017-12-29 Sold (MLS) $36,000 MiRealSource-MiMLS
- 2017-12-29 Sold (MLS) $36,000 REALCOMP
- 2017-12-22 Pending — MiRealSource-MiMLS
- 2017-12-22 Pending — REALCOMP
- 2017-10-13 Price Changed $36,000 MiRealSource-MiMLS
- 2017-10-12 Price Changed $36,000 REALCOMP
- 2017-10-12 Price Changed $36,500 REALCOMP
- 2017-09-08 Listed $37,500 MiRealSource-MiMLS
- 2017-09-08 Listed $37,500 REALCOMP
- 2016-09-28 Listing Removed — REALCOMP
- 2016-09-28 Listing Removed — MiRealSource-MiMLS
- 2016-09-02 Price Changed $35,000 MiRealSource-MiMLS
- 2016-09-02 Price Changed $35,000 REALCOMP
- 2016-08-27 Price Changed $37,000 MiRealSource-MiMLS
- 2016-08-26 Price Changed $37,000 REALCOMP
- 2016-08-01 Listed $30,000 MiRealSource-MiMLS
- 2016-08-01 Listed $30,000 REALCOMP
- 2015-02-25 Sold (MLS) $3,515 MiRealSource-MiMLS
- 2015-02-25 Sold (MLS) $3,515 REALCOMP
- 2015-01-12 Listing Removed — REALCOMP
- 2015-01-11 Listing Removed — MiRealSource-MiMLS
- 2014-12-29 Price Changed $3,700 REALCOMP
- 2014-12-05 Listed $4,100 REALCOMP
- 2014-12-05 Listed $3,700 MiRealSource-MiMLS
- 1993-06-18 Sold (Public Records) $35,500 Public Records
- 1992-12-10 Sold (Public Records) $10,000 Public Records
Property tax history
+8.9%/yrLatest (2025): $4,282 · +32.1% YoY. Source: county tax records.
Cash-flow waterfall
monthlySold comps — $/sqft
last 12 mo · ≤1 miLoading sold comps…