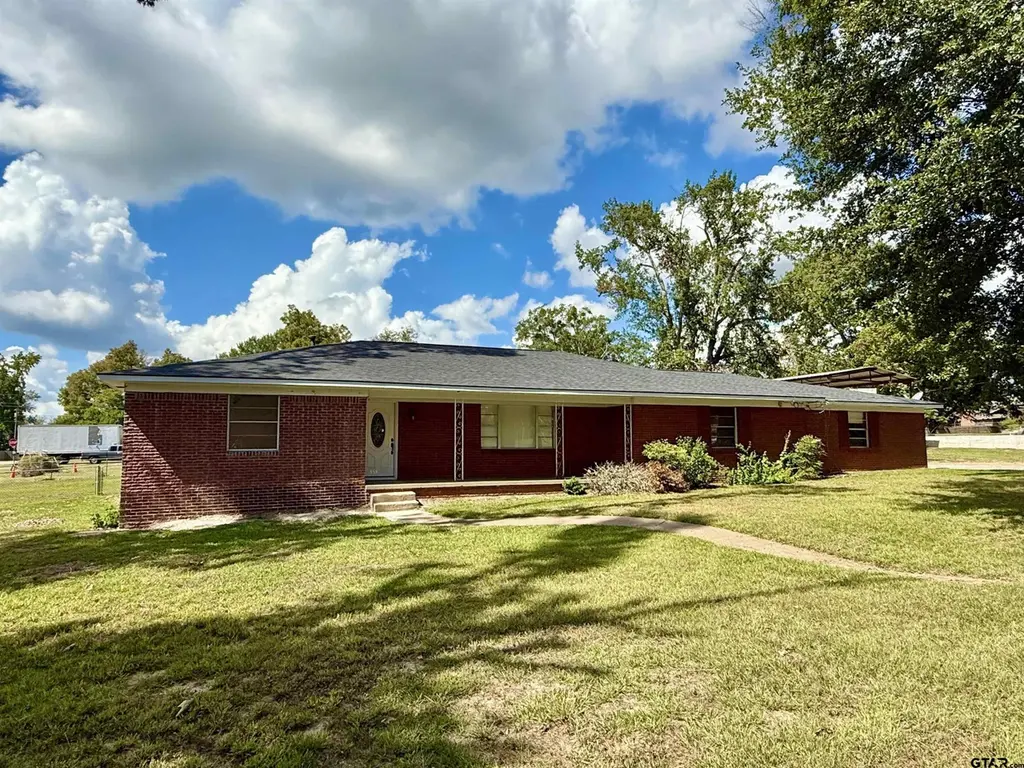
559 Elm St · Frankston, TX
Flood risk 1/10 · Minimal
- FEMA flood zone
- X (unshaded)
- Chance of flooding over 30 yrs
- 0.0%
- Est. flood insurance / yr
- $507 – $1,088
Fire risk 4/10 · Minor
- Est. fire insurance / yr
- $1,222 – $2,270
Heat risk 7/10 · Major
- Hot days now (above 109°F)
- 7 days/yr
- Hot days in 30 yrs
- 26 days/yr
Wind risk 6/10 · Moderate
- Chance of severe wind over 30 yrs
- 67.0%
Air-quality risk 1/10 · Minimal
- Unhealthy air days now
- 0 days/yr
- Unhealthy air days in 30 yrs
- 0 days/yr
Risk factors via First Street. Map © Google.
Why this score? — see what drove the D grade
The composite is a weighted blend of 9 inputs, each scored 0–100. Each bar is that input's sub-score; the figure is the points it added to the 100-point composite (weight × sub-score).
- ARV discount +12.4/15.0
- Appreciation +10.0/10.0
- Cash flow +4.5/30.0
- Schools +4.4/10.0
- Livability +3.1/5.0
- Rent growth +2.5/5.0
- Condition / age +2.5/5.0
- 1% rule +0.8/10.0
- DSCR +0.0/10.0
$245,000
🖨 Deal sheet 📄 Offer letter ✓ Due diligence
Listing remarks
Great home or investment opportunity in the heart of Frankston, conveniently located on a large corner lot with fenced yard close to schools, grocery stores, and local amenities. The home offers room for the family, with a spacious 3 bedroom, 2 full bath layout with a large bonus living room in addition to an open concept living dining space. Home features several major improvements including an updated HVAC, and kitchen with granite countertops, custom wood cabinetry, and appliances, a new roof in 2023, and recently leveled in 2025. If you're looking for your next investment property, or the perfect starter home to make your own the potential is here.
Key facts
- 0.55 acre lot
- Listed 50 days
Property features AI
Exterior
- Parking: Concrete driveway; Paved parking
- Security: Smoke detector(s)
- Utilities: Cable available; Public sewer
- Home design: Single family detached; Single-story
- Construction: Brick and stone construction; Composition roof
- Exterior features: Covered porch; Chain link fencing; Outbuilding
Interior
- Kitchen: Dishwasher; Electric oven; Electric range; Microwave; Disposal
- Bathrooms: 2 full bathrooms
- Heating & cooling: Central heating (electric); Central air; Ceiling fan(s)
- Interior features: Walk-in closet(s); Pantry; Smoke detector(s)
Neighborhood map
What this means for you Summary
Snapshot
- This is a 3-bed/2.0-bath single-family listed at $245k.
Deal economics
- At list price, monthly cash flow is $-635 ($-8k/yr) — negative.
- To cash-flow at today's rent, offer at most $133k (45.8% below list).
- To meet the 1% rule (rent ≥ 1% of price), the offer needs to be $142k (42.2% below list).
- Recommended offer: $133k (45.8% below list) — sets the bar for cash-flow.
Location & tenants
- Location reads 62/100 on livability (#918 in TX) — a middle-class / working-renter tenant base. Strengths: cost of living A+; Watch: employment D+, amenities F, commute F.
- Frankston ISD (rural): math 54% / reading 49% proficiency, ranked #155 of 826 in TX (top 19%) — acceptable for families but not a draw, mixed tenant base, ~2y average lease.
- Zoned schools: Frankston El (math 57% / reading 52%, grade C, #621 of 4,322 statewide, top 15%, 373 students, 63% FRL); Frankston Middle (math 57% / reading 42%, grade C, #356 of 1,662 statewide, top 23%, 184 students, 62% FRL); Frankston H S (math 24% / reading 62%, grade F, #708 of 1,632 statewide, top 44%, 245 students, 50% FRL).
- Market conditions: 191 active listings in the ZIP; 29 units permitted in Anderson County in 2024 (0 in 5+ unit buildings).
Forward outlook
- In year one you build about $26k of equity ($2k loan paydown + $24k appreciation (10.0% local appreciation)).
- Anderson County population projected at +4% by 2050 — modest demand growth; plan on rents tracking national, not racing it.
- By year 2, paydown + projected appreciation supports a ~$42k cash-out refi (75% LTV) — recoverable capital for the next deal without selling this one.
Negotiation context
- It's been on market 50 days — a 3% lower offer ($238k) is reasonable based on typical stale-listing flexibility.
Risks & watch-outs
- Climate carrying-cost: major wind risk, 67% chance of damaging wind over 30y; extreme-heat days projected 7→26/yr by 2055 (HVAC capex compounding) — expect insurance premiums to compound above CPI over the hold.
Questions for the listing agent
- What do current leases actually rent for vs. the listed asking? Can we see a recent rent roll and the last 12 months of T-12 income?
- It's been on market 50 days. Have you received any prior offers? Is the seller open to a 46% concession, seller financing, or rate buy-down credit?
- Is there a deadline driving the sale (1031 exchange, divorce, estate, relocation)? That informs how much negotiation room exists.
- The area grade is low — what's the realistic commute time and amenity access for the typical tenant pool here? Any planned neighborhood developments (good or bad) we should know about?
- What's the average days-on-market for RENTAL listings here right now (not sales)? A rising rental-DOM trend means longer vacancies and softer asking-rent achievability than the comps imply.
- What's the recent tenant-quality profile in this submarket — average credit score on applications, eviction rate, late-payment / NSF rate, and stable-employment percentage? A property-management company in the area should have these aggregated.
- How much new for-sale + rental construction is in the pipeline within 1–3 miles? Heavy new supply typically softens prices + rents 12–24 months out; constrained supply supports both.
Investment metrics
- 1% rule
- 0.58% ✗
- Cap rate
- 3.18%
- Cash-on-cash
- -11.11%
- DSCR
- 0.51
- GRM
- 14.4
CMA / ARV
- ARV (median comp)
- $274,883
- List price
- $245,000
- Delta
- -10.87%
- Verdict
- UNDERPRICED
- Comps
- 6 within 1.0 mi
Show comp detail 3 sales within ~0.75 mi
| Address | Dist | Beds/Ba | Sqft | Sold | Price | $/sf | Match |
|---|---|---|---|---|---|---|---|
| 409 N Elm St | 0.09mi | 4/2.0 (+1) | 2,407 (+2%) | 1mo | $344,900 | $143 | 88 |
| 149 Pecan St | 0.50mi | 4/3.5 (+1) | 2,340 (-1%) | 1mo | $270,000 | $115 | 62 |
| 190 N Commerce St | 0.48mi | 4/2.0 (+1) | 2,256 (-5%) | 11mo | $195,000 | $86 | 56 |
Match score weights: distance 35% · size 25% · config 20% · recency 20%. Top-matched comps best support the ARV.
Projected returns pro-forma
10.0% appreciation · 3.0% rent growth · sell at horizon
- IRR
- 16.5%
- Equity multiple
- 2.36×
- Total profit
- $93,024
- Equity at exit
- $220,715
- IRR
- 15.8%
- Equity multiple
- 5.46×
- Total profit
- $305,882
- Equity at exit
- $475,981
Cash invested: $68,600 (down + closing). Projections, not guarantees.
Landlord ↔ Tenant lean methodology
- Overall (STATE)
- 87 Strongly Landlord-Friendly
- State Texas
- 87 Strongly Landlord-Friendly · R+5
- County
- — inherits STATE
- City
- — inherits STATE
ZIP-level market 75763
- Home prices YoY
- 22.2%
- Active inventory
- 191
- Price-to-rent
- 14.4×
Monthly cashflow live
- Estimated rent
- $1,417 medium interval (Pro) →
- Mortgage (P&I)
- −$1,285
- Tax from tax record
- −$368 /mo · $4,411/yr
- Insurance
- −$102
- HOA
- −$0
- Vacancy / Maint / Mgmt
- −$297
- Net cashflow
- $-635
Break-even live
UW: 25.0% down · 7.5% · 30yr · 1.5% tax · 5.0% vac · 8.0% maint · 8.0% mgmt
Financing live
Cash to close
- Down payment
- $61,250
- Closing costs
- $7,350
- Reserves months
- —
- Total cash needed
- —
Loan-product check · same deal, 3 products live
Conventional
25% down · 7.5% · 30yr
- Down + closing
- —
- Monthly P&I
- —
- Monthly cashflow
- —
- DSCR
- —
- Eligible?
- —
Personal DTI + credit; lowest rate.
DSCR
20% down · 8.5% · 30yr
- Down + closing
- —
- Monthly P&I
- —
- Monthly cashflow
- —
- DSCR
- —
- Eligible?
- —
No personal income docs; deal must DSCR.
Hard money
10% down · 12.0% · 12mo
- Down + closing
- —
- Monthly P&I
- —
- Monthly cashflow
- —
- DSCR
- —
- Eligible?
- —
Short-term bridge; refi at stabilization.
Listing history 18 events
-
2026-06-18days on market $245,000 Active 50 DOM
-
2026-06-17days on market $245,000 Active 49 DOM
-
2026-06-16days on market $245,000 Active 48 DOM
-
2026-06-15days on market $245,000 Active 47 DOM
-
2026-06-13days on market $245,000 Active 45 DOM
-
2026-06-12days on market $245,000 Active 44 DOM
-
2026-06-09days on market $245,000 Active 41 DOM
-
2026-06-08days on market $245,000 Active 40 DOM
-
2026-06-08days on market $245,000 Active 39 DOM
-
2026-06-05days on market $245,000 Active 37 DOM
-
2026-06-03days on market $245,000 Active 35 DOM
-
2026-06-02days on market $245,000 Active 34 DOM
-
2026-06-02price $245,000 Active 33 DOM
-
2026-06-01days on market $255,000 Active 33 DOM
-
2026-05-31days on market $255,000 Active 32 DOM
-
2026-04-29$255,000 Active 660-char remark
-
2026-02-09price $265,000
-
2025-04-09soldstatus
ⓘ Source: listings_history table (triggers on properties + properties_extension) + one-shot
backfill from property_details.listing_events for pre-trigger history.
Tax reassessment forecast TX · Resets to sale price
- Current annual tax
- $4,411 · $368/mo
- Projected year-2 tax
- $4,484 · $374/mo
- Expected delta
- +$73/yr (+$6/mo · 1.7%)
ⓘ Screening estimate from a state-policy table — verify with the county assessor before closing.
Climate risk First Street
- Flood 1/10 Low FEMA zone X (unshaded) · 0% chance over 30 yrs
- Wildfire 4/10 Moderate
- Heat 7/10 Severe 7 d/yr ≥109°F today · 26 d/yr by 30 yrs out
- Wind 6/10 Major 67% chance of damaging wind over 30 yrs
- Air quality 1/10 Low 0 unhealthy d/yr today · 0 by 30 yrs out
Nearby sold comps map
Loading sold comps map…
Walkable amenities ~0.75 mi
Loading nearby amenities…
Taxation est. · year 1
- Rental income
- $16,998
- − Mortgage interest
- −$13,724
- − Property taxes
- −$4,411
- − Insurance
- −$1,225
- − Repairs & maintenance
- −$1,360
- − Management
- −$1,360
- − Depreciation
- −$7,127
- Taxable loss
- −$12,208
- Est. tax savings @ 24.0%
- +$2,930
- After-tax cash flow
- $-4,695/yr
For passive investors: Depreciation is non-cash, so a rental often shows a tax loss while cash-flowing — sheltering income. Rental losses are passive: they offset passive income freely, and up to $25,000/yr can offset ordinary (W-2) income if you actively participate and your MAGI is under $100k (phasing out to $0 by $150k); unused losses carry forward. On sale, claimed depreciation is recaptured at up to 25%, and gains may owe capital-gains tax (a 1031 exchange can defer both). Figures are a year-1 estimate at your 24.0% rate — not tax advice; consult a CPA.
Schools (NCES district)
- District
- Frankston ISD
- NCES district ID
- 4819770
- Math proficiency
- 54% ▼ -1.00%
- Reading proficiency
- 49% ▲ 2.00%
- Median HH income
- $48,226
- Composite
- 43.89/100
- National rank
- #2916
- State rank
- #155 of 826 in TX
Livability — Frankston
- Score
- 62/100
- State rank
- #918
- US rank
- #16383
Category grades
Schools grade is shown separately in the Schools card above.
Census & demographics
- Census place
- Frankston, TX
- Population (ZIP)
- 6,319
Population outlook (Anderson County) Hauer SSP2
- Today (2025)
- 56,663 people
- By 2030
- 57,373 · +1.3%
- By 2040
- 58,960 · +4.1%
- By 2050
- 59,073 · +4.3%
- By 2075
- 53,737 · -5.2%
- By 2100
- 42,516 · -25.0%
Race, ethnicity, and origin ACS 2023
- Neighborhood character
- Predominantly White (79%)
- Race & ethnicity
- White 79% Two or more races 10% Hispanic / Latino 8% Black 5%
- Hispanic origin (detail)
- Mexican 7%
- Common ancestry
- Lithuanian 3% Iranian 2% Slovak 1%
- Foreign-born
- 3% · Canada
- Languages at home
- 94% English-only · Spanish 6%
Political lean MEDSL · Anderson
- 2024 margin
- Solid R (+61.8) · D 18.8% · R 80.6%
- 2008→2024 swing
- -18.3pp toward R · 2008: -43.5pp · 2024: -61.8pp
- All cycles
- 2024: R+61.8 2020: R+58.0 2016: R+58.1 2012: R+52.2 2008: R+43.5
Not yet ingested
- Civics
- —
Market trends
- HPI YoY
- ▲ 53.53%
- Current HPI
- 295.14
- Rent YoY
- —
- Metro
- —
- State GDP YoY
- ▲ 3.95%
- F500 in state
- 110
Industry mix (Fortune 500 HQ in TX)
| Industry | F500 HQs | Revenue |
|---|---|---|
| Energy | 16 | $1,198B |
|
||
| Technology | 5 | $198B |
|
||
| Engineering / Construction | 4 | $72B |
|
||
| Energy Services | 3 | $60B |
|
||
| Utilities | 3 | $41B |
|
||
| Healthcare | 2 | $330B |
|
||
Price history
-7.5% since first listed4 events — show timeline
- 2026-06-01 Price Changed $245,000 GTAR
- 2026-04-29 Listed $255,000 GTAR
- 2026-02-09 Price Changed $265,000 GTAR
- 2025-04-09 Sold (Public Records) — Public Records
Property tax history
+3.2%/yrLatest (2025): $4,411 · +30.0% YoY. Source: county tax records.
Cash-flow waterfall
monthlySold comps — $/sqft
last 12 mo · ≤1 miLoading sold comps…