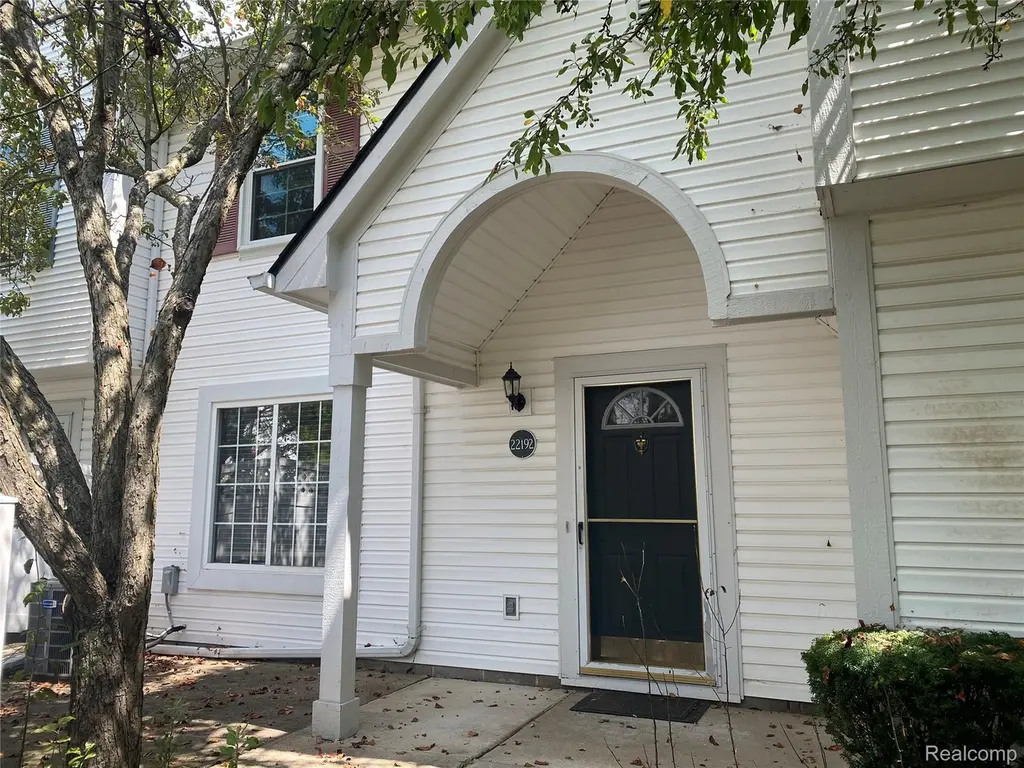
22192 Cape Cod Way Way · Farmington Hills, MI
Flood risk 1/10 · Minimal
- FEMA flood zone
- X (unshaded)
- Chance of flooding over 30 yrs
- 0.0%
- Est. flood insurance / yr
- $507 – $1,088
Fire risk 1/10 · Minimal
- Est. fire insurance / yr
- $784 – $1,456
Heat risk 3/10 · Minor
- Hot days now (above 97°F)
- 7 days/yr
- Hot days in 30 yrs
- 15 days/yr
Wind risk 2/10 · Minimal
- Chance of severe wind over 30 yrs
- —
Air-quality risk 3/10 · Minor
- Unhealthy air days now
- 2 days/yr
- Unhealthy air days in 30 yrs
- 4 days/yr
Risk factors via First Street. Map © Google.
Why this score? — see what drove the D grade
The composite is a weighted blend of 9 inputs, each scored 0–100. Each bar is that input's sub-score; the figure is the points it added to the 100-point composite (weight × sub-score).
- ARV discount +10.3/15.0
- Cash flow +7.9/30.0
- Rent growth +5.0/5.0
- Schools +4.6/10.0
- 1% rule +4.2/10.0
- Livability +4.0/5.0
- Condition / age +2.5/5.0
- DSCR +2.0/10.0
- Appreciation +0.0/10.0
$157,000
🖨 Deal sheet 📄 Offer letter ✓ Due diligence
Listing remarks MLS
This home is located in the popular and affordable Nantucket complex. This unit has a fabulous location close to the pool and clubhouse. Open floor plan. Efficient kitchen with granite counters and all appliances. Half bath on the main floor. First floor laundry with room for storage. Newer carpeting. These units feature 2 bedrooms and 2 1/2 baths. Included is the 1 car carport.
Key facts
- Close to pool
- Laundry room
- Efficient kitchen
Tags
Neighborhood map
What this means for you Summary
Snapshot
- This is a 2-bed/2.5-bath condo listed at $157k.
Deal economics
- At list price, monthly cash flow is $-168 ($-2k/yr) — negative.
- To cash-flow at today's rent, offer at most $127k (18.9% below list).
- To meet the 1% rule (rent ≥ 1% of price), the offer needs to be $144k (8.5% below list).
- Recommended offer: $127k (18.9% below list) — sets the bar for cash-flow.
- Cap rate 5.0% vs local median 3.5% in Farmington Hills — top-decile yield for the area; either an underpriced asset or a hidden risk that comps aren't pricing in. Stress-test before assuming the spread holds.
Location & tenants
- Location reads 81/100 on livability (#64 in MI, #1,364 nationally) — a professional / high-income tenant draw. Strengths: employment A+, housing A+, crime A; Watch: amenities D, health & safety F.
- Farmington Public School District (urban): math 45% / reading 58% proficiency, ranked #78 of 540 in MI (top 14%) — acceptable for families but not a draw, mixed tenant base, ~2y average lease; only 19% free/reduced lunch — higher-income household profile.
- Market conditions: Rents rising fast (+10.8%/yr); 156 active listings in the ZIP; 13 comparable units currently listed for rent nearby; rentals leasing fast (median 12d on market — plan ~1-2 weeks tenant-placement turnaround); solid renter incomes; 2,614 units permitted in Oakland County in 2024 (721 in 5+ unit buildings).
Forward outlook
- Local home prices are declining (-3.0%/yr); year-one equity from $1k of loan paydown is wiped out by about $5k of value loss. Plan a longer hold.
- Oakland County population projected at +10% by 2050 — modest demand growth; plan on rents tracking national, not racing it.
Negotiation context
- Only 9 days on market — expect competitive offers; lowballing is unlikely to land.
- 4 sale attempts with the ask held roughly flat each time — persistent listings suggest the price (not the market) is what's stuck; bring a comps-based counter.
- Current owner paid $101k; list at $157k implies a 55% gain — meaningful room to come down on a strong offer.
Risks & watch-outs
- Watch-outs: HOA is 23% of rent.
Questions for the listing agent
- What do current leases actually rent for vs. the listed asking? Can we see a recent rent roll and the last 12 months of T-12 income?
- What does the HOA fee cover, when was the last increase, and are there any pending special assessments or reserve-fund shortfalls?
- Any open or pending special assessments — roof, HVAC, plumbing, elevator, façade? What's the per-unit balance and payoff schedule, and is the seller paying it off at close or rolling it to the buyer?
- Is there a deadline driving the sale (1031 exchange, divorce, estate, relocation)? That informs how much negotiation room exists.
- Schools are B-rated — typically a magnet for longer-tenancy family renters. What's the average tenant stay here, and is there a school-zone premium baked into asking?
- The area grade is low — what's the realistic commute time and amenity access for the typical tenant pool here? Any planned neighborhood developments (good or bad) we should know about?
- What's the average days-on-market for RENTAL listings here right now (not sales)? A rising rental-DOM trend means longer vacancies and softer asking-rent achievability than the comps imply.
- What's the recent tenant-quality profile in this submarket — average credit score on applications, eviction rate, late-payment / NSF rate, and stable-employment percentage? A property-management company in the area should have these aggregated.
- How much new apartment / multifamily construction is in the pipeline within 1–3 miles? Heavy new supply (>2% of stock underway) typically softens rents 12–24 months out; light construction supports rent growth.
Investment metrics
- 1% rule
- 0.92% ✗
- Cap rate
- 5.01%
- Cash-on-cash
- -4.60%
- DSCR
- 0.80
- GRM
- 9.1
CMA / ARV
- ARV (median comp)
- $167,431
- List price
- $157,000
- Delta
- -2.65%
- Verdict
- FAIR
- Comps
- 20 within 1.0 mi
Projected returns pro-forma
-3.0% appreciation · 8.0% rent growth · sell at horizon
- IRR
- -17.4%
- Equity multiple
- 0.35×
- Total profit
- $-28,416
- Equity at exit
- $23,409
- IRR
- -0.9%
- Equity multiple
- 0.92×
- Total profit
- $-3,361
- Equity at exit
- $13,574
Cash invested: $43,960 (down + closing). Projections, not guarantees.
Landlord ↔ Tenant lean methodology
- Overall (STATE)
- 62 Landlord-Friendly
- State Michigan
- 62 Landlord-Friendly · EVEN
- County
- — inherits STATE
- City
- — inherits STATE
ZIP-level market 48336
- Rents YoY
- 10.8%
- Active inventory
- 156
- Price-to-rent
- 9.1×
Monthly cashflow live
- Estimated rent
- $1,437 high interval (Pro) →
- Mortgage (P&I)
- −$823
- Tax from tax record
- −$90 /mo · $1,076/yr
- Insurance
- −$65
- HOA
- −$325
- Vacancy / Maint / Mgmt
- −$302
- Net cashflow
- $-168
Break-even live
UW: 25.0% down · 7.5% · 30yr · 1.5% tax · 5.0% vac · 8.0% maint · 8.0% mgmt
Financing live
Cash to close
- Down payment
- $39,250
- Closing costs
- $4,710
- Reserves months
- —
- Total cash needed
- —
Loan-product check · same deal, 3 products live
Conventional
25% down · 7.5% · 30yr
- Down + closing
- —
- Monthly P&I
- —
- Monthly cashflow
- —
- DSCR
- —
- Eligible?
- —
Personal DTI + credit; lowest rate.
DSCR
20% down · 8.5% · 30yr
- Down + closing
- —
- Monthly P&I
- —
- Monthly cashflow
- —
- DSCR
- —
- Eligible?
- —
No personal income docs; deal must DSCR.
Hard money
10% down · 12.0% · 12mo
- Down + closing
- —
- Monthly P&I
- —
- Monthly cashflow
- —
- DSCR
- —
- Eligible?
- —
Short-term bridge; refi at stabilization.
Rent comps 13 comps
| Address | Beds | Baths | Sqft | Rent | $/sqft | DOM | Units | Dist |
|---|---|---|---|---|---|---|---|---|
| 23085 Floral St Farmington, MI | 2.0 | 1.0 | 950 | $1,495 | $1.57 | 10d | 1 | 0.54mi |
| 23237 Tulane Ave Farmington Hills, MI | 3.0 | 1.5 | 1104 | $2,000 | $1.81 | 10d | 1 | 0.68mi |
| 23210 Middlebelt Rd Unit 205 Farmington Hills, MI | 1.0 | 1.0 | 750 | $1,195 | $1.59 | 10d | 1 | 0.71mi |
| 23210 Middlebelt Rd Unit 206 Farmington Hills, MI | 1.0 | 1.0 | 750 | $1,195 | $1.59 | 43d | 1 | 0.71mi |
| 23210 Middlebelt Rd Unit 108 Farmington Hills, MI | 1.0 | 1.0 | 750 | $1,195 | $1.59 | 4d | 1 | 0.71mi |
| 23210 Middlebelt Rd Farmington Hills, MI | 1.0 | 1.0 | 750 | $1,195 | $1.59 | 12d | 1 | 0.71mi |
| 23812 Middlebelt Rd Farmington Hills, MI | 1.0 | 1.0 | 750 | $1,110 | $1.48 | 43d | 1 | 0.95mi |
| 28532 Grayling Ave Farmington Hills, MI | 2.0 | 1.0 | 700 | $1,395 | $1.99 | 24d | 1 | 1.13mi |
| 28530 Grayling Ave Farmington Hills, MI | 2.0 | 1.0 | 600 | $1,295 | $2.16 | 24d | 1 | 1.15mi |
| 31200 Morlock St Livonia, MI | 1.0–2.0 | 1.0 | 900 | $1,505 | $1.67 | 1d | 10 | 1.20mi |
| 27883 Independence St Farmington Hills, MI | 1.0 | 1.0 | 750 | $975 | $1.30 | 24d | 1 | 1.23mi |
| 23611 Bicking Ct Farmington, MI | 3.0 | 1.0 | 1117 | $2,100 | $1.88 | 43d | 1 | 1.27mi |
| 33203 N Manor Dr Farmington, MI | 1.0–2.0 | 1.0 | 855 | $1,478 | $1.73 | 2d | 14 | 1.44mi |
HOA detail condo
- Monthly dues
- $325 · $3,900/yr
- Likely covers
- pool
- Assessments
- None detected in remarks — confirm with the listing agent.
Listing history 24 events
-
2026-06-18days on market $157,000 Active 9 DOM
-
2026-06-17days on market $157,000 Active 8 DOM
-
2026-06-16days on market $157,000 Active 7 DOM
-
2026-06-15days on market $157,000 Active 6 DOM
-
2026-06-13days on market $157,000 Active 4 DOM
-
2026-06-13days on market $157,000 Active 3 DOM
-
2026-06-10remarks 532-char remark
-
2026-06-10pricedays on market $157,000 Active 1 DOM
-
2026-06-09days on market $163,000 Active 168 DOM
-
2026-06-08days on market $163,000 Active 167 DOM
-
2026-06-07days on market $163,000 Active 166 DOM
-
2026-06-04days on market $163,000 Active 163 DOM
-
2026-06-02days on market $163,000 Active 161 DOM
-
2026-06-01days on market $163,000 Active 160 DOM
-
2026-05-31days on market $163,000 Active 159 DOM
-
2025-12-23historical
Show marketing remark (381 chars)
This home is located in the popular and affordable Nantucket complex. This unit has a fabulous location close to the pool and clubhouse. Open floor plan. Efficient kitchen with granite counters and all appliances. Half bath on the main floor. First floor laundry with room for storage. Newer carpeting. These units feature 2 bedrooms and 2 1/2 baths. Included is the 1 car carport.
-
2025-12-23$163,000 Active 381-char remark
Show marketing remark (381 chars)
This home is located in the popular and affordable Nantucket complex. This unit has a fabulous location close to the pool and clubhouse. Open floor plan. Efficient kitchen with granite counters and all appliances. Half bath on the main floor. First floor laundry with room for storage. Newer carpeting. These units feature 2 bedrooms and 2 1/2 baths. Included is the 1 car carport.
-
2025-12-23historical
Show marketing remark (381 chars)
This home is located in the popular and affordable Nantucket complex. This unit has a fabulous location close to the pool and clubhouse. Open floor plan. Efficient kitchen with granite counters and all appliances. Half bath on the main floor. First floor laundry with room for storage. Newer carpeting. These units feature 2 bedrooms and 2 1/2 baths. Included is the 1 car carport.
-
2025-12-23$163,000 Active
Show marketing remark (381 chars)
This home is located in the popular and affordable Nantucket complex. This unit has a fabulous location close to the pool and clubhouse. Open floor plan. Efficient kitchen with granite counters and all appliances. Half bath on the main floor. First floor laundry with room for storage. Newer carpeting. These units feature 2 bedrooms and 2 1/2 baths. Included is the 1 car carport.
-
2025-10-21price $165,000
-
2025-10-20price $165,000
-
2025-08-25$169,000 Active
-
2025-08-25$169,000 Active
-
1998-08-14soldstatus $101,240
ⓘ Source: listings_history table (triggers on properties + properties_extension) + one-shot
backfill from property_details.listing_events for pre-trigger history.
Tax reassessment forecast MI · Partial reset (capped growth)
- Current annual tax
- $1,076 · $90/mo
- Projected year-2 tax
- $1,747 · $146/mo
- Expected delta
- +$671/yr (+$56/mo · 62.3%)
ⓘ Screening estimate from a state-policy table — verify with the county assessor before closing.
Climate risk First Street
- Flood 1/10 Low FEMA zone X (unshaded) · 0% chance over 30 yrs
- Wildfire 1/10 Low
- Heat 3/10 Moderate 7 d/yr ≥97°F today · 15 d/yr by 30 yrs out
- Wind 2/10 Low
- Air quality 3/10 Moderate 2 unhealthy d/yr today · 4 by 30 yrs out
Nearby sold comps map
Loading sold comps map…
Walkable amenities ~0.75 mi
Loading nearby amenities…
Taxation est. · year 1
- Rental income
- $17,241
- − Mortgage interest
- −$8,794
- − Property taxes
- −$1,076
- − Insurance
- −$785
- − Repairs & maintenance
- −$1,379
- − Management
- −$1,379
- − HOA
- −$3,900
- − Depreciation
- −$4,567
- Taxable loss
- −$4,640
- Est. tax savings @ 24.0%
- +$1,114
- After-tax cash flow
- $-907/yr
For passive investors: Depreciation is non-cash, so a rental often shows a tax loss while cash-flowing — sheltering income. Rental losses are passive: they offset passive income freely, and up to $25,000/yr can offset ordinary (W-2) income if you actively participate and your MAGI is under $100k (phasing out to $0 by $150k); unused losses carry forward. On sale, claimed depreciation is recaptured at up to 25%, and gains may owe capital-gains tax (a 1031 exchange can defer both). Figures are a year-1 estimate at your 24.0% rate — not tax advice; consult a CPA.
Schools (NCES district)
- District
- Farmington Public School District
- NCES district ID
- 2614070
- Math proficiency
- 45% ▼ -5.00%
- Reading proficiency
- 58% ▼ -1.00%
- Median HH income
- $72,846
- Composite
- 46.17/100
- National rank
- #2497
- State rank
- #78 of 540 in MI
Livability — Farmington Hills
- Score
- 81/100
- State rank
- #64
- US rank
- #1364
Category grades
Schools grade is shown separately in the Schools card above.
Census & demographics
- Census place
- Farmington Hills, MI
- County
- Oakland County · 1,009,092 people
- City population
- 67,612
- Metro
- Detroit-Warren-Dearborn, MI
- Population (ZIP)
- 26,432
- Household income
- $88,938
- Rent vs Own
- Severe rent burden
- 733.0
Population outlook (Oakland County) Hauer SSP2
- Today (2025)
- 1,335,747 people
- By 2030
- 1,375,100 · +2.9%
- By 2040
- 1,435,385 · +7.5%
- By 2050
- 1,469,250 · +10.0%
- By 2075
- 1,531,946 · +14.7%
- By 2100
- 1,450,485 · +8.6%
Race, ethnicity, and origin ACS 2023
- Neighborhood character
- Predominantly White (71%)
- Race & ethnicity
- White 71% Black 13% Two or more races 7% Asian 6% Hispanic / Latino 4%
- Common ancestry
- Romanian 10% Slovak 3% Lithuanian 3%
- Foreign-born
- 12% · Canada, China, South Korea
- Languages at home
- 85% English-only · Other Indo-European 5% Arabic 2% Spanish 2%
Political lean MEDSL · Oakland
- 2024 margin
- D (+10.6) · D 54.4% · R 43.8% · Other 1.9%
- 2008→2024 swing
- -3.9pp toward R · 2008: 14.5pp · 2024: 10.6pp
- All cycles
- 2024: D+10.6 2020: D+14.1 2016: D+8.1 2012: D+8.1 2008: D+14.5
Not yet ingested
- Civics
- —
Market trends
- HPI YoY
- ▼ -273.86%
- Current HPI
- 177.4299
- Rent YoY
- ▲ 10.83%
- Metro
- Detroit-Warren-Dearborn, MI
- State GDP YoY
- ▲ 1.37%
- F500 in state
- 28
Industry mix (Fortune 500 HQ in MI)
| Industry | F500 HQs | Revenue |
|---|---|---|
| Automotive Parts | 3 | $48B |
|
||
| Automotive | 2 | $372B |
|
||
| Chemicals | 1 | $45B |
|
||
| Automotive Retail | 1 | $29B |
|
||
| Healthcare / Medical Devices | 1 | $23B |
|
||
| Automotive Technology | 1 | $20B |
|
||
Price history
+61.0% since first listed9 events — show timeline
- 2025-12-23 Listed $163,000 REALCOMP
- 2025-12-23 Listing Removed — REALCOMP
- 2025-12-23 Listed $163,000 MiRealSource-MiMLS
- 2025-12-23 Listing Removed — MiRealSource-MiMLS
- 2025-10-21 Price Changed $165,000 MiRealSource-MiMLS
- 2025-10-20 Price Changed $165,000 REALCOMP
- 2025-08-25 Listed $169,000 REALCOMP
- 2025-08-25 Listed $169,000 MiRealSource-MiMLS
- 1998-08-14 Sold (Public Records) $101,240 Public Records
Property tax history
+2.4%/yrLatest (2025): $1,076 · -21.4% YoY. Source: county tax records.
Cash-flow waterfall
monthlySold comps — $/sqft
last 12 mo · ≤1 miLoading sold comps…