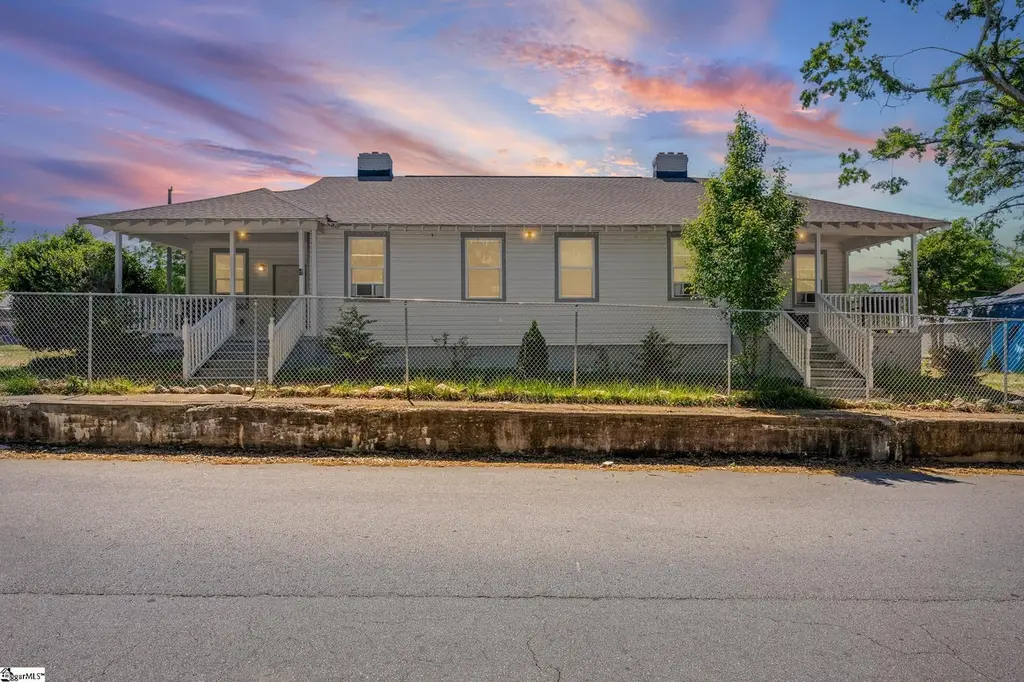
27 Smythe St · Belton, SC
Flood risk 1/10 · Minimal
- FEMA flood zone
- X (unshaded)
- Chance of flooding over 30 yrs
- 0.0%
- Est. flood insurance / yr
- $507 – $1,088
Fire risk 4/10 · Minor
- Est. fire insurance / yr
- $783 – $1,453
Heat risk 6/10 · Moderate
- Hot days now (above 105°F)
- 7 days/yr
- Hot days in 30 yrs
- 17 days/yr
Wind risk 2/10 · Minimal
- Chance of severe wind over 30 yrs
- 4.0%
Air-quality risk 3/10 · Minor
- Unhealthy air days now
- 2 days/yr
- Unhealthy air days in 30 yrs
- 4 days/yr
Risk factors via First Street. Map © Google.
Why this score? — see what drove the D grade
The composite is a weighted blend of 9 inputs, each scored 0–100. Each bar is that input's sub-score; the figure is the points it added to the 100-point composite (weight × sub-score).
- Cash flow +13.3/30.0
- ARV discount +7.5/15.0
- Schools +4.1/10.0
- DSCR +4.0/10.0
- Livability +3.7/5.0
- 1% rule +3.2/10.0
- Appreciation +2.6/10.0
- Rent growth +2.5/5.0
- Condition / age +2.5/5.0
$190,000
🖨 Deal sheet (PDF) 📄 Offer letter ✓ Due diligence
Listing remarks
Calling all investors! 27 Smythe St is a recently renovated duplex located in the heart of Belton and within walking distance to downtown. This fully updated property features two units - each offering 1 bedroom and 1 bath - that are currently occupied, providing immediate rental income! Brand new roof as well as newer windows, doors, and floors. Each unit includes a Living Room that could serve as a 2nd Bedroom, an eat-in Kitchen with all new appliances, a covered front porch, a covered back porch, and an enclosed Laundry with a washer and dryer in each unit located off the rear porch. Additional features include street parking available directly in front of the home as well as ample parki
Key facts
- Brand new roof
- Newer doors
- Newer windows
Tags
Property features AI
Finance
- Financial info: Multi-unit property with 2 total units
- HOA & community: No community amenities
Exterior
- Parking: Off-street parking; 2 spaces per unit; Other parking details noted in remarks
- Utilities: Public water; Public sewer; Electric water heater; Public garbage pickup; Power for cooling via wall/window units
- Home design: Single-story property; Built in 1959; Crawl space foundation
- Construction: Composition shingle roof; Vinyl siding construction; Crawl space foundation; Approximate year built: 1959
- Exterior features: Vinyl siding; Approximate lot dimensions: 107x81x107x81
Interior
- Kitchen: Unit 2 kitchen/breakfast room; Unit 2 microwave; Unit 2 refrigerator; Unit 2 stand-alone electric range
- Bedrooms: Unit 1: 1 bedroom (level 1); Unit 2: 1 bedroom (level 1)
- Flooring: Unit 2 laminate flooring
- Bathrooms: Unit 1: 1 full bathroom; Unit 2: 1 full bathroom
- Heating & cooling: Heating: Other/See Remarks; Cooling: Wall/window units
- Interior features: Front porch; Outside storage
- Laundry & utility: Unit 2 washer; Unit 2 dryer; Electric water heater
Neighborhood map
What this means for you Summary
Snapshot
- This is a 4-bed/4.0-bath other listed at $190k.
Deal economics
- At list price, monthly cash flow is $1 ($14/yr) — positive.
- The deal already cash-flows at list — no discount required.
- To meet the 1% rule (rent ≥ 1% of price), the offer needs to be $155k (18.4% below list).
- Recommended offer: $155k (18.4% below list) — sets the bar for 1% rule.
- Cap rate 6.3% vs local median 3.7% in Belton — top-decile yield for the area; either an underpriced asset or a hidden risk that comps aren't pricing in. Stress-test before assuming the spread holds.
Location & tenants
- Location reads 74/100 on livability (#32 in SC, #4,723 nationally) — a middle-class / working-renter tenant base. Strengths: cost of living A+, health & safety A+, housing A; Watch: commute F, employment F.
- Anderson 02 (rural): math 46% / reading 52% proficiency, ranked #16 of 80 in SC (top 20%) — families likely to look elsewhere, expect single-tenant / working-renter base with shorter leases.
- Zoned schools: Belton Elementary (math 48% / reading 47%, grade D, #199 of 597 statewide, top 35%, 372 students, 86% FRL); Belton Middle (math 37% / reading 46%, grade F, #68 of 229 statewide, top 31%, 495 students, 77% FRL); Belton Honea Path High (math 58% / reading 86%, grade B+, #48 of 196 statewide, top 26%, 1,097 students, 67% FRL) — zoned schools average 76% FRL vs 46% district-wide (30 pts higher); higher-poverty schools than district average — tighter screening recommended.
- Market conditions: 134 active listings in the ZIP; 1 comparable units currently listed for rent nearby; 1,255 units permitted in Anderson County in 2024 (0 in 5+ unit buildings).
Forward outlook
- Local home prices are declining (-3.0%/yr); year-one equity from $1k of loan paydown is wiped out by about $6k of value loss. Plan a longer hold.
- Anderson County population projected at +14% by 2050 — modest demand growth; plan on rents tracking national, not racing it.
Negotiation context
- It's been on market 60 days — a 3% lower offer ($184k) is reasonable based on typical stale-listing flexibility.
- Current owner paid $60k; list at $190k implies a 217% gain — meaningful room to come down on a strong offer.
Risks & watch-outs
- Watch-outs: built in 1959 — expect roof / HVAC / electrical / plumbing capex.
- Climate carrying-cost: extreme-heat days projected 7→17/yr by 2055 (HVAC capex compounding) — expect insurance premiums to compound above CPI over the hold.
Questions for the listing agent
- It's been on market 60 days. Have you received any prior offers? Is the seller open to a 18% concession, seller financing, or rate buy-down credit?
- Built in 1959 — when were the roof, HVAC, electrical panel, plumbing, and water heater last replaced?
- Is there a deadline driving the sale (1031 exchange, divorce, estate, relocation)? That informs how much negotiation room exists.
- The area grade is low — what's the realistic commute time and amenity access for the typical tenant pool here? Any planned neighborhood developments (good or bad) we should know about?
- What's the average days-on-market for RENTAL listings here right now (not sales)? A rising rental-DOM trend means longer vacancies and softer asking-rent achievability than the comps imply.
- What's the recent tenant-quality profile in this submarket — average credit score on applications, eviction rate, late-payment / NSF rate, and stable-employment percentage? A property-management company in the area should have these aggregated.
- How much new for-sale + rental construction is in the pipeline within 1–3 miles? Heavy new supply typically softens prices + rents 12–24 months out; constrained supply supports both.
Investment metrics
- 1% rule
- 0.82% ✗
- Cap rate
- 6.30%
- Cash-on-cash
- 0.03%
- DSCR
- 1.00
- GRM
- 10.2
CMA / ARV
No comps found within radius.
Projected returns pro-forma
-3.0% appreciation · 3.0% rent growth · sell at horizon
- IRR
- -16.3%
- Equity multiple
- 0.42×
- Total profit
- $-30,746
- Equity at exit
- $28,330
- IRR
- -8.0%
- Equity multiple
- 0.50×
- Total profit
- $-26,806
- Equity at exit
- $16,428
Cash invested: $53,200 (down + closing). Projections, not guarantees.
Landlord ↔ Tenant lean methodology
- Overall (STATE)
- 90 Strongly Landlord-Friendly
- State South Carolina
- 90 Strongly Landlord-Friendly · R+6
- County
- — inherits STATE
- City
- — inherits STATE
ZIP-level market 29627
- Home prices YoY
- -1.3%
- Active inventory
- 134
- Price-to-rent
- 10.2×
Monthly cashflow live
- Estimated rent
- $1,550 medium interval (Pro) →
- Mortgage (P&I)
- −$996
- Tax from tax record
- −$148 /mo · $1,773/yr
- Insurance
- −$79
- HOA
- −$0
- Vacancy / Maint / Mgmt
- −$326
- Net cashflow
- $1
Break-even live
Sensitivity live
| Price | -10% $109 | -5% $55 | +0% $1 | +5% $-53 | +10% $-106 |
|---|---|---|---|---|---|
| Rent | -10% $-121 | -5% $-60 | +0% $1 | +5% $62 | +10% $124 |
| Rate | -1.0pp $97 | -0.5pp $49 | base $1 | +0.5pp $-48 | +1.0pp $-98 |
UW: 25.0% down · 7.5% · 30yr · 1.5% tax · 5.0% vac · 8.0% maint · 8.0% mgmt
Financing live
Cash to close
- Down payment
- $47,500
- Closing costs
- $5,700
- Reserves months
- —
- Total cash needed
- —
Loan-product check · same deal, 3 products live
Conventional
25% down · 7.5% · 30yr
- Down + closing
- —
- Monthly P&I
- —
- Monthly cashflow
- —
- DSCR
- —
- Eligible?
- —
Personal DTI + credit; lowest rate.
DSCR
20% down · 8.5% · 30yr
- Down + closing
- —
- Monthly P&I
- —
- Monthly cashflow
- —
- DSCR
- —
- Eligible?
- —
No personal income docs; deal must DSCR.
Hard money
10% down · 12.0% · 12mo
- Down + closing
- —
- Monthly P&I
- —
- Monthly cashflow
- —
- DSCR
- —
- Eligible?
- —
Short-term bridge; refi at stabilization.
Rent comps 1 comps
| Address | Beds | Baths | Sqft | Rent | $/sqft | DOM | Units | Dist |
|---|---|---|---|---|---|---|---|---|
| 130 Ellison St Belton, SC | 3.0 | 2.0 | 1400 | $1,550 | $1.11 | 4d | 1 | 0.15mi |
Listing history 18 events
-
2026-06-22days on market $190,000 Active 60 DOM
-
2026-06-18days on market $190,000 Active 57 DOM
-
2026-06-17days on market $190,000 Active 56 DOM
-
2026-06-16days on market $190,000 Active 55 DOM
-
2026-06-15price $190,000 Active 54 DOM
-
2026-06-15days on market $200,000 Active 54 DOM
-
2026-06-13days on market $200,000 Active 52 DOM
-
2026-06-10days on market $200,000 Active 49 DOM
-
2026-06-09days on market $200,000 Active 48 DOM
-
2026-06-08days on market $200,000 Active 47 DOM
-
2026-06-07days on market $200,000 Active 46 DOM
-
2026-06-03days on market $200,000 Active 42 DOM
-
2026-06-03days on market $200,000 Active 41 DOM
-
2026-06-01days on market $200,000 Active 40 DOM
-
2026-05-31days on market $200,000 Active 39 DOM
-
2026-05-16price $200,000
-
2026-04-22$210,000 Active
-
2024-10-04soldstatus $60,000
ⓘ Source: listings_history table (triggers on properties + properties_extension) + one-shot
backfill from property_details.listing_events for pre-trigger history.
Tax reassessment forecast SC · Resets to sale price
- Current annual tax
- $1,773 · $148/mo
- Projected year-2 tax
- $1,773 · $148/mo
- Expected delta
- $0/yr ($0/mo · 0.0%)
ⓘ Screening estimate from a state-policy table — verify with the county assessor before closing.
Climate risk First Street
- Flood 1/10 Low FEMA zone X (unshaded) · 0% chance over 30 yrs
- Wildfire 4/10 Moderate
- Heat 6/10 Major 7 d/yr ≥105°F today · 17 d/yr by 30 yrs out
- Wind 2/10 Low 4% chance of damaging wind over 30 yrs
- Air quality 3/10 Moderate 2 unhealthy d/yr today · 4 by 30 yrs out
Nearby sold comps map
Loading sold comps map…
Walkable amenities ~0.75 mi
Loading nearby amenities…
Taxation est. · year 1
- Rental income
- $18,600
- − Mortgage interest
- −$10,643
- − Property taxes
- −$1,773
- − Insurance
- −$950
- − Repairs & maintenance
- −$1,488
- − Management
- −$1,488
- − Depreciation
- −$5,527
- Taxable loss
- −$3,270
- Est. tax savings @ 24.0%
- +$785
- After-tax cash flow
- $799/yr
For passive investors: Depreciation is non-cash, so a rental often shows a tax loss while cash-flowing — sheltering income. Rental losses are passive: they offset passive income freely, and up to $25,000/yr can offset ordinary (W-2) income if you actively participate and your MAGI is under $100k (phasing out to $0 by $150k); unused losses carry forward. On sale, claimed depreciation is recaptured at up to 25%, and gains may owe capital-gains tax (a 1031 exchange can defer both). Figures are a year-1 estimate at your 24.0% rate — not tax advice; consult a CPA.
Schools (NCES district)
- District
- Anderson 02
- NCES district ID
- 4500810
- Math proficiency
- 46% ▼ -1.00%
- Reading proficiency
- 52% ▲ 5.00%
- Median HH income
- $38,940
- Composite
- 40.88/100
- National rank
- #3623
- State rank
- #16 of 80 in SC
Livability — Belton
- Score
- 74/100
- State rank
- #32
- US rank
- #4723
Category grades
Schools grade is shown separately in the Schools card above.
Census & demographics
- Census place
- Belton, SC
- City population
- 16,518
- Population (ZIP)
- 16,518
Population outlook (Anderson County) Hauer SSP2
- Today (2025)
- 210,546 people
- By 2030
- 217,791 · +3.4%
- By 2040
- 230,643 · +9.5%
- By 2050
- 240,220 · +14.1%
- By 2075
- 259,518 · +23.3%
- By 2100
- 258,696 · +22.9%
Race, ethnicity, and origin ACS 2023
- Neighborhood character
- Predominantly White (83%)
- Race & ethnicity
- White 83% Black 12% Two or more races 4% Hispanic / Latino 2%
- Common ancestry
- Serbian 3% Slovak 2% Lithuanian 1%
- Foreign-born
- 2% · Canada
- Languages at home
- 97% English-only · Russian/Polish/Slavic 2% Spanish 1%
Political lean MEDSL · Anderson
- 2024 margin
- Solid R (+47.4) · D 25.7% · R 73.1% · Other 1.2%
- 2008→2024 swing
- -14.1pp toward R · 2008: -33.3pp · 2024: -47.4pp
- All cycles
- 2024: R+47.4 2020: R+42.0 2016: R+43.7 2012: R+36.4 2008: R+33.3
Not yet ingested
- Civics
- —
Market trends
- HPI YoY
- ▼ -4.78%
- Current HPI
- 355.0273
- Rent YoY
- —
- Metro
- —
- State GDP YoY
- ▲ 4.51%
- F500 in state
- 2
Industry mix (Fortune 500 HQ in SC)
| Industry | F500 HQs | Revenue |
|---|---|---|
| Packaging | 1 | $7B |
|
||
Price history
+233.3% since first listed3 events — show timeline
- 2026-05-16 Price Changed $200,000 Greater Greenville MLS
- 2026-04-22 Listed $210,000 Greater Greenville MLS
- 2024-10-04 Sold (Public Records) $60,000 Public Records
Property tax history
+37.2%/yrLatest (2025): $1,773 · +34.6% YoY. Source: county tax records.
Cash-flow waterfall
monthlySold comps — $/sqft
last 12 mo · ≤1 miLoading sold comps…