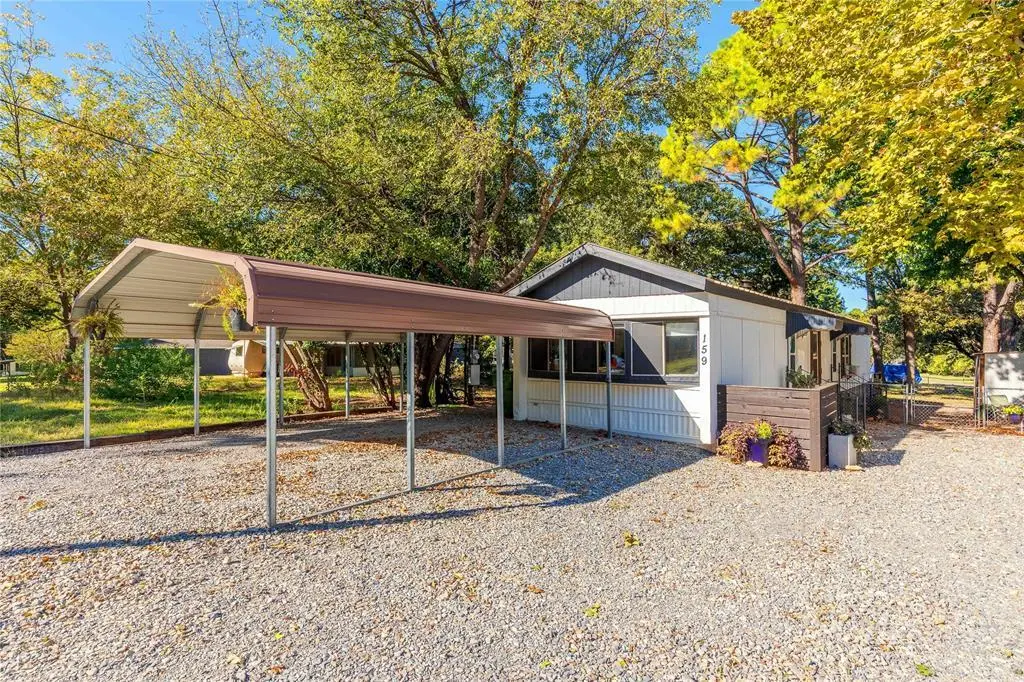
159 Oklahoma Ave · Preston, TX
Flood risk 1/10 · Minimal
- FEMA flood zone
- X (unshaded)
- Chance of flooding over 30 yrs
- 0.0%
- Est. flood insurance / yr
- $507 – $1,088
Fire risk 3/10 · Minor
- Est. fire insurance / yr
- $1,222 – $2,270
Heat risk 6/10 · Moderate
- Hot days now (above 110°F)
- 7 days/yr
- Hot days in 30 yrs
- 21 days/yr
Wind risk 4/10 · Minor
- Chance of severe wind over 30 yrs
- 18.0%
Air-quality risk 3/10 · Minor
- Unhealthy air days now
- 2 days/yr
- Unhealthy air days in 30 yrs
- 3 days/yr
Risk factors via First Street. Map © Google.
Why this score? — see what drove the D grade
The composite is a weighted blend of 9 inputs, each scored 0–100. Each bar is that input's sub-score; the figure is the points it added to the 100-point composite (weight × sub-score).
- ARV discount +15.0/15.0
- Cash flow +10.8/30.0
- Schools +3.7/10.0
- DSCR +3.1/10.0
- Livability +2.8/5.0
- 1% rule +2.5/10.0
- Rent growth +2.5/5.0
- Condition / age +2.5/5.0
- Appreciation +0.0/10.0
$180,000
🖨 Deal sheet (PDF) 📄 Offer letter ✓ Due diligence
Listing remarks MLS
Lake property with beach access. Whether you plan on using it as a get a way or an income producing property, this place should be on your list. Very well maintained Lake Home with deck, storage shed and a fenced in backyard for your animals. Vinyl flooring for easy cleaning with exception of bedrooms. Furniture negotiable
Key facts
- Vinyl flooring
- Fenced in backyard
- Storage shed
Tags
Neighborhood map
What this means for you Summary
Snapshot
- This is a 2-bed/2.0-bath manufactured listed at $180k.
Deal economics
- At list price, monthly cash flow is $-81 ($-975/yr) — negative.
- To cash-flow at today's rent, offer at most $166k (8.0% below list).
- To meet the 1% rule (rent ≥ 1% of price), the offer needs to be $135k (25.1% below list).
- Recommended offer: $135k (25.1% below list) — sets the bar for 1% rule.
- Cap rate 5.8% vs local median 2.9% in Preston — top-decile yield for the area; either an underpriced asset or a hidden risk that comps aren't pricing in. Stress-test before assuming the spread holds.
Location & tenants
- Location reads 56/100 on livability (#1,306 in TX) — a working-class tenant base; expect higher turnover. Strengths: crime A+, cost of living A+, housing A+; Watch: employment D, amenities F, commute F.
- Pottsboro ISD (suburban): math 39% / reading 48% proficiency, ranked #288 of 826 in TX (top 35%) — families likely to look elsewhere, expect single-tenant / working-renter base with shorter leases.
- Zoned schools: Pottsboro El (math 45% / reading 50%, grade D, #989 of 4,322 statewide, top 23%, 543 students, 41% FRL); Pottsboro Middle (math 37% / reading 43%, grade F, #646 of 1,662 statewide, top 40%, 459 students, 40% FRL); Pottsboro H S (math 37% / reading 57%, grade D-, #591 of 1,632 statewide, top 38%, 487 students, 30% FRL) — zoned schools at 37% FRL track the district average.
- Market conditions: 293 active listings in the ZIP; solid renter incomes; 2,272 units permitted in Grayson County in 2024 (750 in 5+ unit buildings).
Forward outlook
- Local home prices are declining (-3.0%/yr); year-one equity from $1k of loan paydown is wiped out by about $5k of value loss. Plan a longer hold.
- Grayson County population projected at +12% by 2050 — modest demand growth; plan on rents tracking national, not racing it.
Negotiation context
- It's been on market 233 days — a 12% lower offer ($158k) is reasonable based on typical stale-listing flexibility.
- 6 sale attempts since 7y ago with the ask held roughly flat each time — persistent listings suggest the price (not the market) is what's stuck; bring a comps-based counter.
Risks & watch-outs
- Climate carrying-cost: extreme-heat days projected 7→21/yr by 2055 (HVAC capex compounding) — expect insurance premiums to compound above CPI over the hold.
Questions for the listing agent
- What do current leases actually rent for vs. the listed asking? Can we see a recent rent roll and the last 12 months of T-12 income?
- It's been on market 233 days. Have you received any prior offers? Is the seller open to a 25% concession, seller financing, or rate buy-down credit?
- Built in 1972 — when were the roof, HVAC, electrical panel, plumbing, and water heater last replaced?
- Why hasn't it sold? Are there any deal-killer items the seller is aware of (foundation, flood, title, zoning, code violations)?
- Is there a deadline driving the sale (1031 exchange, divorce, estate, relocation)? That informs how much negotiation room exists.
- Schools are F-rated, which usually means shorter tenancies and higher turnover. Who's the typical renter profile here, and what's been the actual vacancy rate?
- The area grade is low — what's the realistic commute time and amenity access for the typical tenant pool here? Any planned neighborhood developments (good or bad) we should know about?
- What's the average days-on-market for RENTAL listings here right now (not sales)? A rising rental-DOM trend means longer vacancies and softer asking-rent achievability than the comps imply.
- What's the recent tenant-quality profile in this submarket — average credit score on applications, eviction rate, late-payment / NSF rate, and stable-employment percentage? A property-management company in the area should have these aggregated.
- How much new for-sale + rental construction is in the pipeline within 1–3 miles? Heavy new supply typically softens prices + rents 12–24 months out; constrained supply supports both.
Investment metrics
- 1% rule
- 0.75% ✗
- Cap rate
- 5.75%
- Cash-on-cash
- -1.94%
- DSCR
- 0.91
- GRM
- 11.1
CMA / ARV
- ARV (median comp)
- $246,866
- List price
- $180,000
- Delta
- -27.09%
- Verdict
- UNDERPRICED
- Comps
- 6 within 1.0 mi
Show comp detail 1 sale within ~0.75 mi
| Address | Dist | Beds/Ba | Sqft | Sold | Price | $/sf | Match |
|---|---|---|---|---|---|---|---|
| 247 Elizabeth St | 0.36mi | 2/1.0 | 840 (-9%) | 22mo | $58,000 | $69 | 46 |
Match score weights: distance 35% · size 25% · config 20% · recency 20%. Top-matched comps best support the ARV.
Projected returns pro-forma
-3.0% appreciation · 3.0% rent growth · sell at horizon
- IRR
- -19.5%
- Equity multiple
- 0.32×
- Total profit
- $-34,384
- Equity at exit
- $26,839
- IRR
- -12.4%
- Equity multiple
- 0.27×
- Total profit
- $-36,768
- Equity at exit
- $15,563
Cash invested: $50,400 (down + closing). Projections, not guarantees.
Landlord ↔ Tenant lean methodology
- Overall (STATE)
- 87 Strongly Landlord-Friendly
- State Texas
- 87 Strongly Landlord-Friendly · R+5
- County
- — inherits STATE
- City
- — inherits STATE
ZIP-level market 75076
- Home prices YoY
- -17.3%
- Active inventory
- 293
- Price-to-rent
- 11.1×
Monthly cashflow live
- Estimated rent
- $1,348 medium interval (Pro) →
- Mortgage (P&I)
- −$944
- Tax from tax record
- −$127 /mo · $1,527/yr
- Insurance
- −$75
- HOA
- −$0
- Vacancy / Maint / Mgmt
- −$283
- Net cashflow
- $-81
Break-even live
Sensitivity live
| Price | -10% $21 | -5% $-30 | +0% $-81 | +5% $-132 | +10% $-183 |
|---|---|---|---|---|---|
| Rent | -10% $-188 | -5% $-135 | +0% $-81 | +5% $-28 | +10% $25 |
| Rate | -1.0pp $9 | -0.5pp $-35 | base $-81 | +0.5pp $-128 | +1.0pp $-175 |
UW: 25.0% down · 7.5% · 30yr · 1.5% tax · 5.0% vac · 8.0% maint · 8.0% mgmt
Financing live
Cash to close
- Down payment
- $45,000
- Closing costs
- $5,400
- Reserves months
- —
- Total cash needed
- —
Loan-product check · same deal, 3 products live
Conventional
25% down · 7.5% · 30yr
- Down + closing
- —
- Monthly P&I
- —
- Monthly cashflow
- —
- DSCR
- —
- Eligible?
- —
Personal DTI + credit; lowest rate.
DSCR
20% down · 8.5% · 30yr
- Down + closing
- —
- Monthly P&I
- —
- Monthly cashflow
- —
- DSCR
- —
- Eligible?
- —
No personal income docs; deal must DSCR.
Hard money
10% down · 12.0% · 12mo
- Down + closing
- —
- Monthly P&I
- —
- Monthly cashflow
- —
- DSCR
- —
- Eligible?
- —
Short-term bridge; refi at stabilization.
Listing history 38 events
-
2026-06-21days on market $180,000 Active 233 DOM
-
2026-06-19days on market $180,000 Active 231 DOM
-
2026-06-18days on market $180,000 Active 230 DOM
-
2026-06-17days on market $180,000 Active 229 DOM
-
2026-06-16days on market $180,000 Active 228 DOM
-
2026-06-15days on market $180,000 Active 227 DOM
-
2026-06-14days on market $180,000 Active 225 DOM
-
2026-06-13days on market $180,000 Active 224 DOM
-
2026-06-10days on market $180,000 Active 222 DOM
-
2026-06-09days on market $180,000 Active 221 DOM
-
2026-06-08days on market $180,000 Active 220 DOM
-
2026-06-07days on market $180,000 Active 219 DOM
-
2026-06-03days on market $180,000 Active 215 DOM
-
2026-06-02days on market $180,000 Active 214 DOM
-
2026-06-01days on market $180,000 Active 213 DOM
-
2026-05-31days on market $180,000 Active 212 DOM
-
2026-05-30days on market $180,000 Active 211 DOM
-
2025-10-31$180,000 Active 328-char remark
Show marketing remark (328 chars)
Lake property with beach access. Whether you plan on using it as a get a way or an income producing property, this place should be on your list. Very well maintained Lake Home with deck, storage shed and a fenced in backyard for your animals. Vinyl flooring for easy cleaning with exception of bedrooms. Furniture negotiable
-
2022-08-26soldstatus
-
2022-08-25soldstatus Closed 680-char remark
Show marketing remark (680 chars)
Live the LAKE LIFE at Texoma in this highly desirable neighborhood on the Preston Peninsula! You'll feel like you are on vacation year 'round! Wake up to coffee on the deck. Plenty of space to grill out and have friends and family around. Only a short distance to one of the most beautiful beaches you'll find on the lake as well as two local marinas. Beautiful treed drive into your property. Completely remodeled, kitchen with large island, fresh paint in and out, new water heater, stove, washer and dryer fenced yard, ready to go for the season. Platted access to beach areas, best place on the lake to ride your golf cart around! Call your favorite agent to tour today!
-
2022-07-10status Pending 680-char remark
Show marketing remark (680 chars)
Live the LAKE LIFE at Texoma in this highly desirable neighborhood on the Preston Peninsula! You'll feel like you are on vacation year 'round! Wake up to coffee on the deck. Plenty of space to grill out and have friends and family around. Only a short distance to one of the most beautiful beaches you'll find on the lake as well as two local marinas. Beautiful treed drive into your property. Completely remodeled, kitchen with large island, fresh paint in and out, new water heater, stove, washer and dryer fenced yard, ready to go for the season. Platted access to beach areas, best place on the lake to ride your golf cart around! Call your favorite agent to tour today!
-
2022-06-30historical Active Option Contract 680-char remark
Show marketing remark (680 chars)
Live the LAKE LIFE at Texoma in this highly desirable neighborhood on the Preston Peninsula! You'll feel like you are on vacation year 'round! Wake up to coffee on the deck. Plenty of space to grill out and have friends and family around. Only a short distance to one of the most beautiful beaches you'll find on the lake as well as two local marinas. Beautiful treed drive into your property. Completely remodeled, kitchen with large island, fresh paint in and out, new water heater, stove, washer and dryer fenced yard, ready to go for the season. Platted access to beach areas, best place on the lake to ride your golf cart around! Call your favorite agent to tour today!
-
2022-06-13$162,500 Active 680-char remark
Show marketing remark (680 chars)
Live the LAKE LIFE at Texoma in this highly desirable neighborhood on the Preston Peninsula! You'll feel like you are on vacation year 'round! Wake up to coffee on the deck. Plenty of space to grill out and have friends and family around. Only a short distance to one of the most beautiful beaches you'll find on the lake as well as two local marinas. Beautiful treed drive into your property. Completely remodeled, kitchen with large island, fresh paint in and out, new water heater, stove, washer and dryer fenced yard, ready to go for the season. Platted access to beach areas, best place on the lake to ride your golf cart around! Call your favorite agent to tour today!
-
2022-01-17historical
-
2021-09-22price $162,500
-
2021-08-20status Active
-
2021-08-19historical Active Option Contract
-
2021-07-14price $167,500
-
2021-06-07$175,000 Active
-
2020-06-11soldstatus
-
2020-06-05soldstatus Sold
-
2020-05-22status Pending
-
2020-02-19status Active
-
2020-02-10historical Active Option Contract
-
2019-09-23price $84,500
-
2019-07-31price $86,500
-
2019-06-14$89,000 Active
-
2001-07-18soldstatus
ⓘ Source: listings_history table (triggers on properties + properties_extension) + one-shot
backfill from property_details.listing_events for pre-trigger history.
Tax reassessment forecast TX · Resets to sale price
- Current annual tax
- $1,527 · $127/mo
- Projected year-2 tax
- $3,294 · $274/mo
- Expected delta
- +$1,767/yr (+$147/mo · 115.7%)
ⓘ Screening estimate from a state-policy table — verify with the county assessor before closing.
Climate risk First Street
- Flood 1/10 Low FEMA zone X (unshaded) · 0% chance over 30 yrs
- Wildfire 3/10 Moderate
- Heat 6/10 Major 7 d/yr ≥110°F today · 21 d/yr by 30 yrs out
- Wind 4/10 Moderate 18% chance of damaging wind over 30 yrs
- Air quality 3/10 Moderate 2 unhealthy d/yr today · 3 by 30 yrs out
Nearby sold comps map
Loading sold comps map…
Walkable amenities ~0.75 mi
Loading nearby amenities…
Taxation est. · year 1
- Rental income
- $16,176
- − Mortgage interest
- −$10,083
- − Property taxes
- −$1,527
- − Insurance
- −$900
- − Repairs & maintenance
- −$1,294
- − Management
- −$1,294
- − Depreciation
- −$5,236
- Taxable loss
- −$4,158
- Est. tax savings @ 24.0%
- +$998
- After-tax cash flow
- $23/yr
For passive investors: Depreciation is non-cash, so a rental often shows a tax loss while cash-flowing — sheltering income. Rental losses are passive: they offset passive income freely, and up to $25,000/yr can offset ordinary (W-2) income if you actively participate and your MAGI is under $100k (phasing out to $0 by $150k); unused losses carry forward. On sale, claimed depreciation is recaptured at up to 25%, and gains may owe capital-gains tax (a 1031 exchange can defer both). Figures are a year-1 estimate at your 24.0% rate — not tax advice; consult a CPA.
Schools (NCES district)
- District
- Pottsboro ISD
- NCES district ID
- 4835580
- Math proficiency
- 39% ▼ -11.00%
- Reading proficiency
- 48% ▼ -6.00%
- Median HH income
- $50,811
- Composite
- 37.44/100
- National rank
- #4414
- State rank
- #288 of 826 in TX
Livability — Preston
- Score
- 56/100
- State rank
- #1306
- US rank
- #22637
Category grades
Schools grade is shown separately in the Schools card above.
Census & demographics
- Census place
- Preston, TX
- County
- Grayson County · 108,053 people
- Metro
- Sherman-Denison, TX
- Population (ZIP)
- 7,989
- Household income
- $76,919
- Rent vs Own
- Severe rent burden
- 169.0
Population outlook (Grayson County) Hauer SSP2
- Today (2025)
- 134,540 people
- By 2030
- 138,653 · +3.1%
- By 2040
- 145,958 · +8.5%
- By 2050
- 151,218 · +12.4%
- By 2075
- 161,802 · +20.3%
- By 2100
- 159,036 · +18.2%
Race, ethnicity, and origin ACS 2023
- Neighborhood character
- Predominantly White (88%)
- Race & ethnicity
- White 88% Two or more races 7% Hispanic / Latino 3% Asian 1% Native American 1%
- Common ancestry
- Serbian 2% Scottish 2% Scotch-Irish 2%
- Foreign-born
- 2% · Canada
- Languages at home
- 95% English-only · Spanish 3%
Political lean MEDSL · Grayson
- 2024 margin
- Solid R (+54.3) · D 22.5% · R 76.7%
- 2008→2024 swing
- -16.4pp toward R · 2008: -37.9pp · 2024: -54.3pp
- All cycles
- 2024: R+54.3 2020: R+49.9 2016: R+53.1 2012: R+48.0 2008: R+37.9
Not yet ingested
- Civics
- —
Market trends
- HPI YoY
- ▼ -51.29%
- Current HPI
- 244.52
- Rent YoY
- —
- Metro
- Sherman-Denison, TX
- State GDP YoY
- ▲ 3.95%
- F500 in state
- 110
Industry mix (Fortune 500 HQ in TX)
| Industry | F500 HQs | Revenue |
|---|---|---|
| Energy | 16 | $1,198B |
|
||
| Technology | 5 | $198B |
|
||
| Engineering / Construction | 4 | $72B |
|
||
| Energy Services | 3 | $60B |
|
||
| Utilities | 3 | $41B |
|
||
| Healthcare | 2 | $330B |
|
||
Price history
+102.2% since first listed21 events — show timeline
- 2025-10-31 Listed $180,000 NTREIS
- 2022-08-26 Sold (Public Records) — Public Records
- 2022-08-25 Sold (MLS) — NTREIS
- 2022-07-10 Pending — NTREIS
- 2022-06-30 Contingent — NTREIS
- 2022-06-13 Listed $162,500 NTREIS
- 2022-01-17 Listing Removed — NTREIS
- 2021-09-22 Price Changed $162,500 NTREIS
- 2021-08-20 Relisted — NTREIS
- 2021-08-19 Contingent — NTREIS
- 2021-07-14 Price Changed $167,500 NTREIS
- 2021-06-07 Listed $175,000 NTREIS
- 2020-06-11 Sold (Public Records) — Public Records
- 2020-06-05 Sold (MLS) — NTREIS
- 2020-05-22 Pending — NTREIS
- 2020-02-19 Relisted — NTREIS
- 2020-02-10 Contingent — NTREIS
- 2019-09-23 Price Changed $84,500 NTREIS
- 2019-07-31 Price Changed $86,500 NTREIS
- 2019-06-14 Listed $89,000 NTREIS
- 2001-07-18 Sold (Public Records) — Public Records
Property tax history
+8.3%/yrLatest (2025): $1,527 · +0.5% YoY. Source: county tax records.
Cash-flow waterfall
monthlySold comps — $/sqft
last 12 mo · ≤1 miLoading sold comps…