19040 Nottingham St · Roman Forest, TX
Flood risk 7/10 · Major
- FEMA flood zone
- AE
- Chance of flooding over 30 yrs
- 0.77%
- Est. flood insurance / yr
- $1,737 – $8,500
Fire risk 5/10 · Moderate
- Est. fire insurance / yr
- $1,222 – $2,270
Heat risk 8/10 · Major
- Hot days now (above 111°F)
- 7 days/yr
- Hot days in 30 yrs
- 23 days/yr
Wind risk 8/10 · Major
- Chance of severe wind over 30 yrs
- 99.0%
Air-quality risk 2/10 · Minimal
- Unhealthy air days now
- 2 days/yr
- Unhealthy air days in 30 yrs
- 2 days/yr
Risk factors via First Street. Map © Google.
Why this score? — see what drove the C- grade
The composite is a weighted blend of 9 inputs, each scored 0–100. Each bar is that input's sub-score; the figure is the points it added to the 100-point composite (weight × sub-score).
- Cash flow +21.0/30.0
- ARV discount +9.0/15.0
- DSCR +6.7/10.0
- 1% rule +4.8/10.0
- Livability +3.3/5.0
- Schools +2.8/10.0
- Rent growth +2.6/5.0
- Condition / age +2.5/5.0
- Appreciation +0.0/10.0
$230,000
🖨 Deal sheet (PDF) 📄 Offer letter ✓ Due diligence
Listing remarks MLS
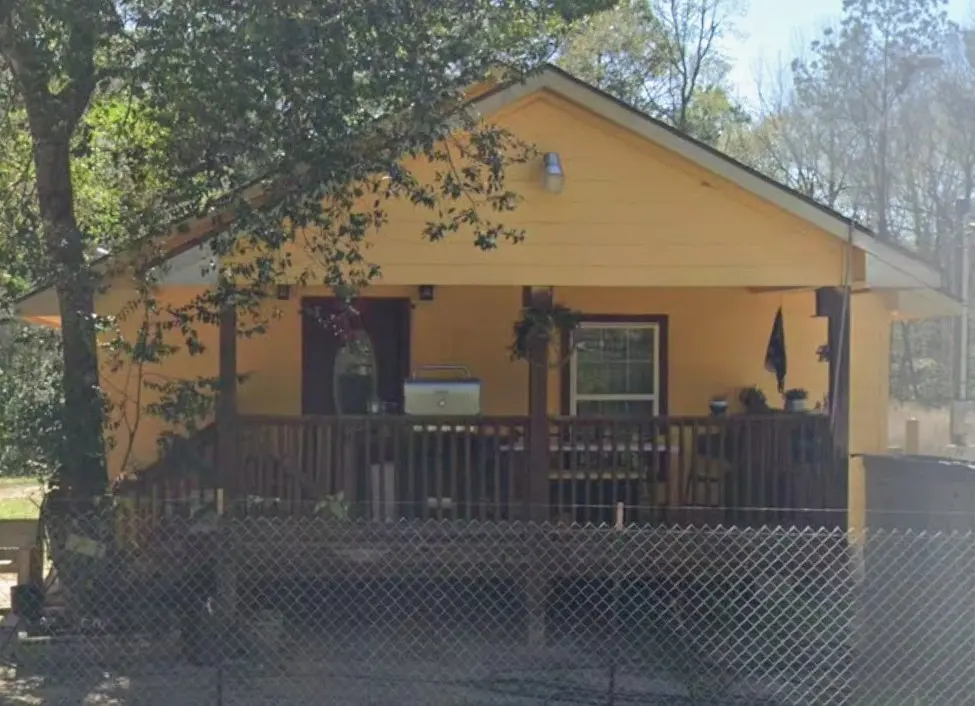
Welcome Home, where peaceful country living meets modern convenience. This mobile home, built in 2018, offers plenty of space for relaxation and outdoor enjoyment. Plenty of Yard Space, Room for gardening, Pets, or outdoor gatherings. This home is perfect for families, first-time buyers, or those looking for a quiet, country setting. Don't miss this opportunity schedule your showing today! Buyer to verify all measurements and information.
Key facts
- Country setting
- Outdoor gatherings
- Room for gardening
Tags
Neighborhood map
What this means for you Summary
Snapshot
- This is a 5-bed/1.5-bath single-family listed at $230k.
Deal economics
- At list price, monthly cash flow is $-100 ($-1k/yr) — negative.
- To cash-flow at today's rent, offer at most $212k (7.7% below list).
- To meet the 1% rule (rent ≥ 1% of price), the offer needs to be $226k (1.9% below list).
- Recommended offer: $202k (12.0% below list) — sets the bar for market timing.
- Cap rate 8.0% vs local median 4.9% in Roman Forest — top-decile yield for the area; either an underpriced asset or a hidden risk that comps aren't pricing in. Stress-test before assuming the spread holds.
Location & tenants
- Location reads 66/100 on livability (#595 in TX) — a middle-class / working-renter tenant base. Strengths: employment A+, housing A+, cost of living A; Watch: schools F, crime F, amenities F.
- New Caney ISD (suburban): math 31% / reading 32% proficiency, ranked #570 of 826 in TX (top 69%) — families likely to look elsewhere, expect single-tenant / working-renter base with shorter leases.
- Market conditions: Rents flat; 986 active listings in the ZIP; solid renter incomes; 13,259 units permitted in Montgomery County in 2024 (1,402 in 5+ unit buildings).
- This rent runs 36% of the median local income ($76k/yr) — at the standard rent-burdened threshold; future hikes will face affordability resistance.
Forward outlook
- Local home prices are declining (-3.0%/yr); year-one equity from $2k of loan paydown is wiped out by about $7k of value loss. Plan a longer hold.
- Montgomery County population projected at +65% by 2050 — long-run rental-demand tailwind backs the buy-and-hold thesis.
Negotiation context
- It's been on market 205 days — a 12% lower offer ($202k) is reasonable based on typical stale-listing flexibility.
- 3 sale attempts since 2y ago with the ask held roughly flat each time — persistent listings suggest the price (not the market) is what's stuck; bring a comps-based counter.
- Current owner paid $21k; list at $230k implies a 978% gain — meaningful room to come down on a strong offer.
Risks & watch-outs
- Watch-outs: flood insurance adds $427/mo.
- Climate carrying-cost: in FEMA flood zone AE (mandatory federal flood insurance); severe wind risk, 99% chance of damaging wind over 30y; moderate wildfire risk; extreme-heat days projected 7→23/yr by 2055 (HVAC capex compounding) — expect insurance premiums to compound above CPI over the hold.
Questions for the listing agent
- What do current leases actually rent for vs. the listed asking? Can we see a recent rent roll and the last 12 months of T-12 income?
- It's been on market 205 days. Have you received any prior offers? Is the seller open to a 12% concession, seller financing, or rate buy-down credit?
- What's the actual annual flood-insurance premium (NFIP or private), and is the property in a SFHA with mandatory coverage?
- What does the HOA fee cover, when was the last increase, and are there any pending special assessments or reserve-fund shortfalls?
- Why hasn't it sold? Are there any deal-killer items the seller is aware of (foundation, flood, title, zoning, code violations)?
- Is there a deadline driving the sale (1031 exchange, divorce, estate, relocation)? That informs how much negotiation room exists.
- Schools are F-rated, which usually means shorter tenancies and higher turnover. Who's the typical renter profile here, and what's been the actual vacancy rate?
- Crime grade is F in this area — have there been break-ins, vandalism, or insurance claims at this property in the last 3 years? What carrier currently insures it and at what premium?
- What's the average days-on-market for RENTAL listings here right now (not sales)? A rising rental-DOM trend means longer vacancies and softer asking-rent achievability than the comps imply.
- What's the recent tenant-quality profile in this submarket — average credit score on applications, eviction rate, late-payment / NSF rate, and stable-employment percentage? A property-management company in the area should have these aggregated.
- How much new for-sale + rental construction is in the pipeline within 1–3 miles? Heavy new supply typically softens prices + rents 12–24 months out; constrained supply supports both.
Investment metrics
- 1% rule
- 0.98% ✗
- Cap rate
- 7.99%
- Cash-on-cash
- 6.08%
- DSCR
- 1.27
- GRM
- 8.5
CMA / ARV
- ARV (median comp)
- $238,190
- List price
- $230,000
- Delta
- -3.44%
- Verdict
- FAIR
- Comps
- 20 within 1.0 mi
Projected returns pro-forma
-3.0% appreciation · 0.21% rent growth · sell at horizon
- IRR
- -23.1%
- Equity multiple
- 0.23×
- Total profit
- $-49,615
- Equity at exit
- $34,294
- IRR
- -29.9%
- Equity multiple
- -0.16×
- Total profit
- $-74,478
- Equity at exit
- $19,886
Cash invested: $64,400 (down + closing). Projections, not guarantees.
Landlord ↔ Tenant lean methodology
- Overall (STATE)
- 87 Strongly Landlord-Friendly
- State Texas
- 87 Strongly Landlord-Friendly · R+5
- County
- — inherits STATE
- City
- — inherits STATE
ZIP-level market 77357
- Home prices YoY
- -24.7%
- Rents YoY
- 0.2%
- Active inventory
- 986
- Price-to-rent
- 8.5×
Monthly cashflow live
- Estimated rent
- $2,255 medium interval (Pro) →
- Mortgage (P&I)
- −$1,206
- Tax from tax record
- −$139 /mo · $1,664/yr
- Insurance
- −$96
- Flood insurance flood zone
- −$427 /mo · $5,118/yr
- HOA
- −$15
- Vacancy / Maint / Mgmt
- −$474
- Net cashflow
- $-100
Break-even live
Sensitivity live
| Price | -10% $30 | -5% $-35 | +0% $-100 | +5% $-166 | +10% $-231 |
|---|---|---|---|---|---|
| Rent | -10% $-279 | -5% $-190 | +0% $-100 | +5% $-11 | +10% $78 |
| Rate | -1.0pp $15 | -0.5pp $-42 | base $-100 | +0.5pp $-160 | +1.0pp $-221 |
UW: 25.0% down · 7.5% · 30yr · 1.5% tax · 5.0% vac · 8.0% maint · 8.0% mgmt
Financing live
Cash to close
- Down payment
- $57,500
- Closing costs
- $6,900
- Reserves months
- —
- Total cash needed
- —
Loan-product check · same deal, 3 products live
Conventional
25% down · 7.5% · 30yr
- Down + closing
- —
- Monthly P&I
- —
- Monthly cashflow
- —
- DSCR
- —
- Eligible?
- —
Personal DTI + credit; lowest rate.
DSCR
20% down · 8.5% · 30yr
- Down + closing
- —
- Monthly P&I
- —
- Monthly cashflow
- —
- DSCR
- —
- Eligible?
- —
No personal income docs; deal must DSCR.
Hard money
10% down · 12.0% · 12mo
- Down + closing
- —
- Monthly P&I
- —
- Monthly cashflow
- —
- DSCR
- —
- Eligible?
- —
Short-term bridge; refi at stabilization.
HOA detail
- Monthly dues
- $15 · $180/yr
Listing history 9 events
-
2026-05-31days on market $230,000 Active 205 DOM
-
2025-11-07$230,000 Active 446-char remark
Show marketing remark (446 chars)
Welcome Home, where peaceful country living meets modern convenience. This mobile home, built in 2018, offers plenty of space for relaxation and outdoor enjoyment. Plenty of Yard Space, Room for gardening, Pets, or outdoor gatherings. This home is perfect for families, first-time buyers, or those looking for a quiet, country setting. Don't miss this opportunity schedule your showing today! Buyer to verify all measurements and information.
-
2025-05-05historical
-
2025-02-24$270,000 Active
-
2024-10-27historical
-
2024-02-28$280,000 Active
-
2024-02-17historical
-
2011-10-13soldstatus
-
2011-03-04soldstatus $21,334
ⓘ Source: listings_history table (triggers on properties + properties_extension) + one-shot
backfill from property_details.listing_events for pre-trigger history.
Tax reassessment forecast TX · Resets to sale price
- Current annual tax
- $1,664 · $139/mo
- Projected year-2 tax
- $4,209 · $351/mo
- Expected delta
- +$2,545/yr (+$212/mo · 153.0%)
ⓘ Screening estimate from a state-policy table — verify with the county assessor before closing.
Climate risk First Street
- Flood 7/10 Severe FEMA zone AE · 77% chance over 30 yrs
- Wildfire 5/10 Major
- Heat 8/10 Severe 7 d/yr ≥111°F today · 23 d/yr by 30 yrs out
- Wind 8/10 Severe 99% chance of damaging wind over 30 yrs
- Air quality 2/10 Low 2 unhealthy d/yr today · 2 by 30 yrs out
Nearby sold comps map
Loading sold comps map…
Walkable amenities ~0.75 mi
Loading nearby amenities…
Taxation est. · year 1
- Rental income
- $27,064
- − Mortgage interest
- −$12,884
- − Property taxes
- −$1,664
- − Insurance
- −$6,268
- − Repairs & maintenance
- −$2,165
- − Management
- −$2,165
- − HOA
- −$180
- − Depreciation
- −$6,691
- Taxable loss
- −$4,953
- Est. tax savings @ 24.0%
- +$1,189
- After-tax cash flow
- $-17/yr
For passive investors: Depreciation is non-cash, so a rental often shows a tax loss while cash-flowing — sheltering income. Rental losses are passive: they offset passive income freely, and up to $25,000/yr can offset ordinary (W-2) income if you actively participate and your MAGI is under $100k (phasing out to $0 by $150k); unused losses carry forward. On sale, claimed depreciation is recaptured at up to 25%, and gains may owe capital-gains tax (a 1031 exchange can defer both). Figures are a year-1 estimate at your 24.0% rate — not tax advice; consult a CPA.
Schools (NCES district)
- District
- New Caney ISD
- NCES district ID
- 4832400
- Math proficiency
- 31% ▼ -16.00%
- Reading proficiency
- 32% ▼ -6.00%
- Median HH income
- $55,380
- Composite
- 27.97/100
- National rank
- #6857
- State rank
- #570 of 826 in TX
Livability — Roman Forest
- Score
- 66/100
- State rank
- #595
- US rank
- #11338
Category grades
Schools grade is shown separately in the Schools card above.
Census & demographics
- County
- Montgomery County · 663,713 people
- Metro
- Houston-The Woodlands-Sugar Land, TX
- Population (ZIP)
- 37,592
- Household income
- $76,050
- Rent vs Own
- Severe rent burden
- 487.0
Population outlook (Montgomery County) Hauer SSP2
- Today (2025)
- 713,896 people
- By 2030
- 805,263 · +12.8%
- By 2040
- 992,708 · +39.1%
- By 2050
- 1,179,590 · +65.2%
- By 2075
- 1,628,084 · +128.1%
- By 2100
- 1,937,880 · +171.5%
Race, ethnicity, and origin ACS 2023
- Neighborhood character
- Diverse neighborhood (Simpson 0.56)
- Race & ethnicity
- Hispanic / Latino 49% White 45% Two or more races 31% Black 3%
- Hispanic origin (detail)
- Mexican 40%
- Common ancestry
- Lithuanian 2% Romanian 1% Iranian 1%
- Foreign-born
- 23% · Canada, Jamaica
- Languages at home
- 58% English-only · Spanish 40% Other Indo-European 1%
Political lean MEDSL · Montgomery
- 2024 margin
- Solid R (+45.5) · D 26.8% · R 72.3%
- 2008→2024 swing
- +7.2pp toward D · 2008: -52.7pp · 2024: -45.5pp
- All cycles
- 2024: R+45.5 2020: R+43.8 2016: R+51.4 2012: R+60.7 2008: R+52.7
Not yet ingested
- Civics
- —
Market trends
- HPI YoY
- ▼ -87.71%
- Current HPI
- 266.8315
- Rent YoY
- ▲ 0.21%
- Metro
- Houston-The Woodlands-Sugar Land, TX
- State GDP YoY
- ▲ 3.95%
- F500 in state
- 110
Industry mix (Fortune 500 HQ in TX)
| Industry | F500 HQs | Revenue |
|---|---|---|
| Energy | 16 | $1,198B |
|
||
| Technology | 5 | $198B |
|
||
| Engineering / Construction | 4 | $72B |
|
||
| Energy Services | 3 | $60B |
|
||
| Utilities | 3 | $41B |
|
||
| Healthcare | 2 | $330B |
|
||
Price history
+978.1% since first listed8 events — show timeline
- 2025-11-07 Listed $230,000 HARMLS
- 2025-05-05 Listing Removed — HARMLS
- 2025-02-24 Listed $270,000 HARMLS
- 2024-10-27 Listing Removed — HARMLS
- 2024-02-28 Listed $280,000 HARMLS
- 2024-02-17 Coming Soon — HARMLS
- 2011-10-13 Sold (Public Records) — Public Records
- 2011-03-04 Sold (Public Records) $21,334 Public Records
Property tax history
+31.9%/yrLatest (2025): $1,664 · +9.8% YoY. Source: county tax records.
Cash-flow waterfall
monthlySold comps — $/sqft
last 12 mo · ≤1 miLoading sold comps…