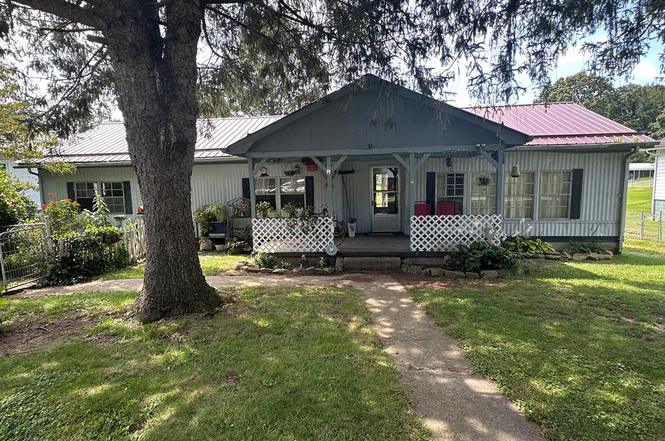
7879 Gatewood Rd · Garten, WV
Flood risk 1/10 · Minimal
- FEMA flood zone
- X (unshaded)
- Chance of flooding over 30 yrs
- 0.0%
- Est. flood insurance / yr
- $507 – $1,088
Fire risk 5/10 · Moderate
- Est. fire insurance / yr
- $787 – $1,461
Heat risk 3/10 · Minor
- Hot days now (above 94°F)
- 7 days/yr
- Hot days in 30 yrs
- 20 days/yr
Wind risk 1/10 · Minimal
- Chance of severe wind over 30 yrs
- —
Air-quality risk 1/10 · Minimal
- Unhealthy air days now
- 0 days/yr
- Unhealthy air days in 30 yrs
- 0 days/yr
Risk factors via First Street. Map © Google.
Why this score? — see what drove the B- grade
The composite is a weighted blend of 9 inputs, each scored 0–100. Each bar is that input's sub-score; the figure is the points it added to the 100-point composite (weight × sub-score).
- Cash flow +30.0/30.0
- DSCR +10.0/10.0
- 1% rule +8.3/10.0
- ARV discount +7.5/15.0
- Rent growth +2.5/5.0
- Livability +2.5/5.0
- Condition / age +2.5/5.0
- Schools +2.0/10.0
- Appreciation +0.0/10.0
$90,000
🖨 Deal sheet (PDF) 📄 Offer letter ✓ Due diligence
Listing remarks MLS
THIS IS A GREAT HOME WITH MANY UPDATES IN THE PAST 6 MONTHS. NEW METAL ROOF AND NEW CENTRAL HEATING AND A/C LARGE LEVEL LOT WITH NEW OUTBUILDING AND WOOD SHED. GREAT LOCATION OFFERING GARDEN SPACE.
Key facts
- Fenced in back yard
- 0.43 acre lot
- Built 1960
Tags
Property features AI
Exterior
- Parking: Open parking; No garage; Gravel parking area
- Utilities: Public water; Septic tank
- Home design: Double wide mobile home; Residential property; Has a view
- Construction: Vinyl siding; Metal roof; Built above grade (finished area 1,320)
- Exterior features: Garden; Level lot
Interior
- Kitchen: Dishwasher; Cooktop; Oven; Refrigerator
- Bedrooms: Total rooms: 5
- Flooring: Carpet; Vinyl
- Bathrooms: 2 full bathrooms
- Heating & cooling: Electric heating; Central air conditioning
- Interior features: Eat-in kitchen; Garden view
- Laundry & utility: Electric water heater
Neighborhood map
What this means for you Summary
Snapshot
- This is a 3-bed/1.0-bath single-family listed at $90k.
Deal economics
- At list price, monthly cash flow is $399 ($5k/yr) — positive.
- The deal already cash-flows at list — no discount required.
- Meets the 1% rule at list price ($1k rent vs $90k).
- Recommended offer: $79k (12.0% below list) — sets the bar for market timing.
Location & tenants
- Location reads: area grade B — affects rentability + tenant quality, not the cash-flow math above.
- Fayette County Schools (suburban): math 17% / reading 31% proficiency, ranked #51 of 55 in WV (top 93%) — low school quality limits family demand, transient renter base, plan for 1-2y turnover.
- Zoned schools: Fayetteville Pk-8 (math 14%, 587 students, 0% FRL); Oak Hill Middle School (math 14% / reading 26%, grade F, #104 of 109 statewide, top 96%, 656 students, 0% FRL) — zoned schools average 0% FRL vs 54% district-wide (54 pts lower); this property's tenant base skews higher-income than the district average.
- Market conditions: 19 active listings in the ZIP; 26 units permitted in Fayette County in 2024 (0 in 5+ unit buildings).
Forward outlook
- Local home prices are declining (-3.0%/yr); year-one equity from $622 of loan paydown is wiped out by about $3k of value loss. Plan a longer hold.
- Fayette County population projected at -23% by 2050 — secular population decline; favor cash flow + early exit over multi-decade hold.
- At projected returns (-3.0% appreciation + 3.0% rent growth), your $25k cash investment doubles in ~7 years — after that, you're playing with house money.
Negotiation context
- It's been on market 212 days — a 12% lower offer ($79k) is reasonable based on typical stale-listing flexibility.
- 4 sale attempts since 7y ago; this cycle's ask has dropped $30k (25%) from the opening price — seller is motivated, your offer sets the floor, not the list.
- Current owner paid $50k; list at $90k implies a 80% gain — meaningful room to come down on a strong offer.
Risks & watch-outs
- Climate carrying-cost: moderate wildfire risk — expect insurance premiums to compound above CPI over the hold.
Questions for the listing agent
- It's been on market 212 days. Have you received any prior offers? Is the seller open to a 12% concession, seller financing, or rate buy-down credit?
- Built in 1960 — when were the roof, HVAC, electrical panel, plumbing, and water heater last replaced?
- Why hasn't it sold? Are there any deal-killer items the seller is aware of (foundation, flood, title, zoning, code violations)?
- Is there a deadline driving the sale (1031 exchange, divorce, estate, relocation)? That informs how much negotiation room exists.
- What's the average days-on-market for RENTAL listings here right now (not sales)? A rising rental-DOM trend means longer vacancies and softer asking-rent achievability than the comps imply.
- What's the recent tenant-quality profile in this submarket — average credit score on applications, eviction rate, late-payment / NSF rate, and stable-employment percentage? A property-management company in the area should have these aggregated.
- How much new for-sale + rental construction is in the pipeline within 1–3 miles? Heavy new supply typically softens prices + rents 12–24 months out; constrained supply supports both.
Investment metrics
- 1% rule
- 1.33% ✓
- Cap rate
- 11.62%
- Cash-on-cash
- 19.02%
- DSCR
- 1.85
- GRM
- 6.3
CMA / ARV
- ARV (on-the-fly)
- $283,800
- Comps found
- 2
Show comp detail 2 sales within ~0.75 mi
| Address | Dist | Beds/Ba | Sqft | Sold | Price | $/sf | Match |
|---|---|---|---|---|---|---|---|
| 194 Lighthouse Ln | 0.38mi | 2/2.0 (-1) | 1,353 (+2%) | 7mo | $291,500 | $215 | 64 |
| 7825 Gatewood Rd | 0.06mi | 3/2.0 | 1,460 (+11%) | 20mo | $235,000 | $161 | 59 |
Match score weights: distance 35% · size 25% · config 20% · recency 20%. Top-matched comps best support the ARV.
Projected returns pro-forma
-3.0% appreciation · 3.0% rent growth · sell at horizon
- IRR
- 10.9%
- Equity multiple
- 1.43×
- Total profit
- $10,820
- Equity at exit
- $13,419
- IRR
- 19.9%
- Equity multiple
- 2.67×
- Total profit
- $42,049
- Equity at exit
- $7,782
Cash invested: $25,200 (down + closing). Projections, not guarantees.
Landlord ↔ Tenant lean methodology
- Overall (STATE)
- 83 Strongly Landlord-Friendly
- State West Virginia
- 83 Strongly Landlord-Friendly · R+22
- County
- — inherits STATE
- City
- — inherits STATE
ZIP-level market 25840
- Home prices YoY
- -20.8%
- Active inventory
- 19
- Price-to-rent
- 6.3×
Monthly cashflow live
- Estimated rent
- $1,193 medium interval (Pro) →
- Mortgage (P&I)
- −$472
- Tax from tax record
- −$34 /mo · $407/yr
- Insurance
- −$38
- HOA
- −$0
- Vacancy / Maint / Mgmt
- −$251
- Net cashflow
- $399
Break-even live
Sensitivity live
| Price | -10% $450 | -5% $425 | +0% $399 | +5% $374 | +10% $348 |
|---|---|---|---|---|---|
| Rent | -10% $305 | -5% $352 | +0% $399 | +5% $446 | +10% $494 |
| Rate | -1.0pp $445 | -0.5pp $422 | base $399 | +0.5pp $376 | +1.0pp $352 |
UW: 25.0% down · 7.5% · 30yr · 1.5% tax · 5.0% vac · 8.0% maint · 8.0% mgmt
Financing live
Cash to close
- Down payment
- $22,500
- Closing costs
- $2,700
- Reserves months
- —
- Total cash needed
- —
Loan-product check · same deal, 3 products live
Conventional
25% down · 7.5% · 30yr
- Down + closing
- —
- Monthly P&I
- —
- Monthly cashflow
- —
- DSCR
- —
- Eligible?
- —
Personal DTI + credit; lowest rate.
DSCR
20% down · 8.5% · 30yr
- Down + closing
- —
- Monthly P&I
- —
- Monthly cashflow
- —
- DSCR
- —
- Eligible?
- —
No personal income docs; deal must DSCR.
Hard money
10% down · 12.0% · 12mo
- Down + closing
- —
- Monthly P&I
- —
- Monthly cashflow
- —
- DSCR
- —
- Eligible?
- —
Short-term bridge; refi at stabilization.
Listing history 30 events
-
2026-06-19days on market $90,000 Active 212 DOM
-
2026-06-18days on market $90,000 Active 211 DOM
-
2026-06-17days on market $90,000 Active 210 DOM
-
2026-06-16days on market $90,000 Active 209 DOM
-
2026-06-15days on market $90,000 Active 208 DOM
-
2026-06-14days on market $90,000 Active 206 DOM
-
2026-06-12days on market $90,000 Active 205 DOM
-
2026-06-09days on market $90,000 Active 202 DOM
-
2026-06-08days on market $90,000 Active 201 DOM
-
2026-06-07days on market $90,000 Active 200 DOM
-
2026-06-05days on market $90,000 Active 197 DOM
-
2026-06-03days on market $90,000 Active 196 DOM
-
2026-06-02days on market $90,000 Active 195 DOM
-
2026-06-01days on market $90,000 Active 194 DOM
-
2026-05-31days on market $90,000 Active 193 DOM
-
2026-05-30days on market $90,000 Active 192 DOM
-
2026-05-20price $90,000
-
2026-04-28price $100,000
-
2026-02-23status Active
-
2026-01-13historical Active Under Contract
-
2026-01-06price $110,000
-
2025-11-19$120,000 Active
-
2025-10-04price
-
2025-09-18price
-
2025-09-10price
-
2025-08-15Active
-
2019-06-14soldstatus $50,000 198-char remark
Show marketing remark (198 chars)
THIS IS A GREAT HOME WITH MANY UPDATES IN THE PAST 6 MONTHS. NEW METAL ROOF AND NEW CENTRAL HEATING AND A/C LARGE LEVEL LOT WITH NEW OUTBUILDING AND WOOD SHED. GREAT LOCATION OFFERING GARDEN SPACE.
-
2019-06-13soldstatus $50,000
-
2019-04-02$51,000 198-char remark
Show marketing remark (198 chars)
THIS IS A GREAT HOME WITH MANY UPDATES IN THE PAST 6 MONTHS. NEW METAL ROOF AND NEW CENTRAL HEATING AND A/C LARGE LEVEL LOT WITH NEW OUTBUILDING AND WOOD SHED. GREAT LOCATION OFFERING GARDEN SPACE.
-
1979-10-18soldstatus $24,000
ⓘ Source: listings_history table (triggers on properties + properties_extension) + one-shot
backfill from property_details.listing_events for pre-trigger history.
Tax reassessment forecast WV · Resets to sale price
- Current annual tax
- $407 · $34/mo
- Projected year-2 tax
- $531 · $44/mo
- Expected delta
- +$124/yr (+$10/mo · 30.5%)
ⓘ Screening estimate from a state-policy table — verify with the county assessor before closing.
Climate risk First Street
- Flood 1/10 Low FEMA zone X (unshaded) · 0% chance over 30 yrs
- Wildfire 5/10 Major
- Heat 3/10 Moderate 7 d/yr ≥94°F today · 20 d/yr by 30 yrs out
- Wind 1/10 Low
- Air quality 1/10 Low 0 unhealthy d/yr today · 0 by 30 yrs out
Nearby sold comps map
Loading sold comps map…
Walkable amenities ~0.75 mi
Loading nearby amenities…
Taxation est. · year 1
- Rental income
- $14,320
- − Mortgage interest
- −$5,041
- − Property taxes
- −$407
- − Insurance
- −$450
- − Repairs & maintenance
- −$1,146
- − Management
- −$1,146
- − Depreciation
- −$2,618
- Taxable income
- $3,512
- Est. tax owed @ 24.0%
- −$843
- After-tax cash flow
- $3,949/yr
For passive investors: Depreciation is non-cash, so a rental often shows a tax loss while cash-flowing — sheltering income. Rental losses are passive: they offset passive income freely, and up to $25,000/yr can offset ordinary (W-2) income if you actively participate and your MAGI is under $100k (phasing out to $0 by $150k); unused losses carry forward. On sale, claimed depreciation is recaptured at up to 25%, and gains may owe capital-gains tax (a 1031 exchange can defer both). Figures are a year-1 estimate at your 24.0% rate — not tax advice; consult a CPA.
Schools (NCES district)
- District
- Fayette County Schools
- NCES district ID
- 5400300
- Math proficiency
- 17% ▼ -12.00%
- Reading proficiency
- 31% ▼ -4.00%
- Median HH income
- $35,293
- Composite
- 19.77/100
- National rank
- #8706
- State rank
- #51 of 55 in WV
Livability — Garten
No livability data for this city. (Only ~50 U.S. cities are tracked.)
Census & demographics
- Census place
- Garten, WV
- Population (ZIP)
- 7,917
Population outlook (Fayette County) Hauer SSP2
- Today (2025)
- 41,745 people
- By 2030
- 39,758 · -4.8%
- By 2040
- 35,751 · -14.4%
- By 2050
- 32,223 · -22.8%
- By 2075
- 24,307 · -41.8%
- By 2100
- 16,671 · -60.1%
Race, ethnicity, and origin ACS 2023
- Neighborhood character
- Predominantly White (94%)
- Race & ethnicity
- White 94% Two or more races 3% Black 2%
- Common ancestry
- Slovak 2% Serbian 1% Romanian 1%
- Foreign-born
- 0%
Political lean MEDSL · Fayette
- 2024 margin
- Solid R (+41.8) · D 28.1% · R 69.8% · Other 2.1%
- 2008→2024 swing
- -39.0pp toward R · 2008: -2.7pp · 2024: -41.8pp
- All cycles
- 2024: R+41.8 2020: R+38.6 2016: R+39.6 2012: R+21.0 2008: R+2.7
Not yet ingested
- Civics
- —
Market trends
- HPI YoY
- ▼ -49.38%
- Current HPI
- 187.8473
- Rent YoY
- —
- Metro
- —
- State GDP YoY
- —
- F500 in state
- 0
Price history
+275.0% since first listed14 events — show timeline
- 2026-05-20 Price Changed $90,000 BBOR
- 2026-04-28 Price Changed $100,000 BBOR
- 2026-02-23 Relisted — BBOR
- 2026-01-13 Contingent — BBOR
- 2026-01-06 Price Changed $110,000 BBOR
- 2025-11-19 Listed $120,000 BBOR
- 2025-10-04 Price Changed — BBOR
- 2025-09-18 Price Changed — BBOR
- 2025-09-10 Price Changed — BBOR
- 2025-08-15 Listed — BBOR
- 2019-06-14 Sold (MLS) $50,000 BBOR
- 2019-06-13 Sold (Public Records) $50,000 Public Records
- 2019-04-02 Listed $51,000 BBOR
- 1979-10-18 Sold (Public Records) $24,000 Public Records
Property tax history
+20.8%/yrLatest (2025): $407 · -2.0% YoY. Source: county tax records.
Cash-flow waterfall
monthlySold comps — $/sqft
last 12 mo · ≤1 miLoading sold comps…