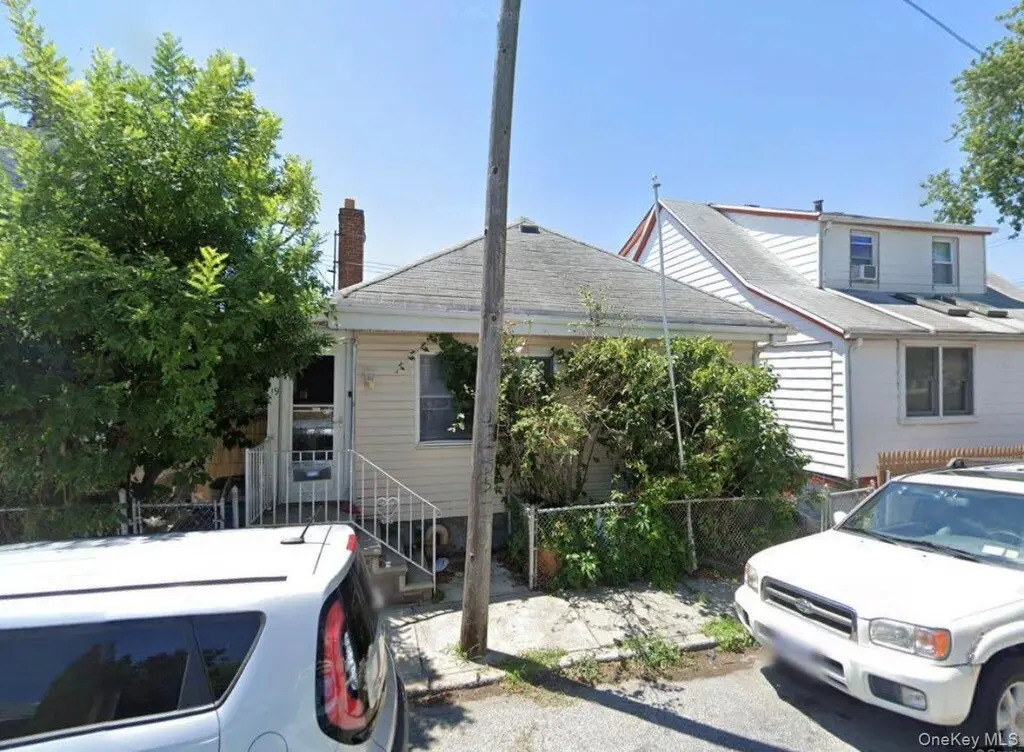
19 Celeste Ct · New York, NY
Flood risk 7/10 · Major
- FEMA flood zone
- X (shaded)
- Chance of flooding over 30 yrs
- 0.95%
- Est. flood insurance / yr
- $507 – $1,088
Fire risk 4/10 · Minor
- Est. fire insurance / yr
- $691 – $1,283
Heat risk 7/10 · Major
- Hot days now (above 97°F)
- 7 days/yr
- Hot days in 30 yrs
- 16 days/yr
Wind risk 6/10 · Moderate
- Chance of severe wind over 30 yrs
- 72.0%
Air-quality risk 5/10 · Moderate
- Unhealthy air days now
- 6 days/yr
- Unhealthy air days in 30 yrs
- 8 days/yr
Risk factors via First Street. Map © Google.
Why this score? — see what drove the B grade
The composite is a weighted blend of 9 inputs, each scored 0–100. Each bar is that input's sub-score; the figure is the points it added to the 100-point composite (weight × sub-score).
- Cash flow +28.8/30.0
- DSCR +10.0/10.0
- 1% rule +7.5/10.0
- ARV discount +7.5/15.0
- Rent growth +5.0/5.0
- Schools +5.0/10.0
- Livability +3.8/5.0
- Condition / age +2.5/5.0
- Appreciation +0.0/10.0
$345,000
🖨 Deal sheet 📄 Offer letter ✓ Due diligence
Listing remarks
Welcome to 19 Celeste Ct, a wonderful opportunity to own a single-family home in Brooklyn. This property offers a great opportunity for buyers looking to customize a home and make it their own. Situated on a quiet residential street, this home offers a functional layout and plenty of potential for the next owner to update and personalize. Whether you are an end user or investor, this property offers strong potential in a desirable Brooklyn location. Don’t miss the opportunity to view this home and explore all it has to offer.
Key facts
- 1,785 sq ft lot
- Built 1930
- Listed 15 days
Property features AI
Exterior
- Parking: On-street parking
- Utilities: Public sewer; Utilities: see remarks
- Home design: Single family residence; Living area reported from public records
- Construction: Vinyl siding construction
- Exterior features: Vinyl siding; Not waterfront
Interior
- Kitchen: Gas cooktop; Gas oven; Microwave; Refrigerator
- Bedrooms: 6 total rooms (includes bedrooms and living spaces)
- Bathrooms: 1 full bathroom
- Heating & cooling: Radiant heating; No central cooling
- Interior features: Marble counters; Open kitchen; Walk-through kitchen
- Laundry & utility: Washer; Dryer
Neighborhood map
What this means for you Summary
Snapshot
- This is a 3-bed/1.0-bath single-family listed at $345k.
Deal economics
- At list price, monthly cash flow is $1k ($13k/yr) — positive.
- The deal already cash-flows at list — no discount required.
- Meets the 1% rule at list price ($4k rent vs $345k).
- Recommended offer: $340k (1.5% below list) — sets the bar for market timing.
- Cap rate 10.3% vs local median 2.6% in New York — top-decile yield for the area; either an underpriced asset or a hidden risk that comps aren't pricing in. Stress-test before assuming the spread holds.
Location & tenants
- Location reads 75/100 on livability (#268 in NY, #4,188 nationally) — a middle-class / working-renter tenant base. Strengths: amenities A+, commute A+, health & safety A; Watch: crime F, cost of living F.
- Market conditions: Rents rising fast (+15.8%/yr); 355 active listings in the ZIP; 3 comparable units currently listed for rent nearby; rentals at typical pace (median 25d on market — plan ~3-4 weeks tenant-placement turnaround); 10,063 units permitted in Kings County in 2024 (9,789 in 5+ unit buildings).
- At $4,295/mo this rent would consume 73% of the median local household income ($71k/yr) (locally 4771% of renters already pay >50% of income on rent) — very limited rent-growth headroom before tenants either downsize or default.
Forward outlook
- Local home prices are declining (-3.0%/yr); year-one equity from $2k of loan paydown is wiped out by about $10k of value loss. Plan a longer hold.
- Kings County population projected at +13% by 2050 — modest demand growth; plan on rents tracking national, not racing it.
- At projected returns (-3.0% appreciation + 8.0% rent growth), your $97k cash investment doubles in ~7 years — after that, you're playing with house money.
Negotiation context
- It's been on market 15 days — a 2% lower offer ($340k) is reasonable based on typical stale-listing flexibility.
- Current owner paid $115k; list at $345k implies a 200% gain — meaningful room to come down on a strong offer.
Risks & watch-outs
- Watch-outs: flood insurance adds $66/mo; built in 1930 — expect roof / HVAC / electrical / plumbing capex.
- Climate carrying-cost: major flood risk; major wind risk, 72% chance of damaging wind over 30y; extreme-heat days projected 7→16/yr by 2055 (HVAC capex compounding) — expect insurance premiums to compound above CPI over the hold.
Questions for the listing agent
- Built in 1930 — when were the roof, HVAC, electrical panel, plumbing, and water heater last replaced?
- What's the actual annual flood-insurance premium (NFIP or private), and is the property in a SFHA with mandatory coverage?
- Is there a deadline driving the sale (1031 exchange, divorce, estate, relocation)? That informs how much negotiation room exists.
- Schools are B-rated — typically a magnet for longer-tenancy family renters. What's the average tenant stay here, and is there a school-zone premium baked into asking?
- Crime grade is F in this area — have there been break-ins, vandalism, or insurance claims at this property in the last 3 years? What carrier currently insures it and at what premium?
- What's the average days-on-market for RENTAL listings here right now (not sales)? A rising rental-DOM trend means longer vacancies and softer asking-rent achievability than the comps imply.
- What's the recent tenant-quality profile in this submarket — average credit score on applications, eviction rate, late-payment / NSF rate, and stable-employment percentage? A property-management company in the area should have these aggregated.
- How much new for-sale + rental construction is in the pipeline within 1–3 miles? Heavy new supply typically softens prices + rents 12–24 months out; constrained supply supports both.
Investment metrics
- 1% rule
- 1.25% ✓
- Cap rate
- 10.33%
- Cash-on-cash
- 14.43%
- DSCR
- 1.64
- GRM
- 6.7
CMA / ARV
- ARV (on-the-fly)
- $729,960
- Comps found
- 12
Show comp detail 12 sales within ~0.75 mi
| Address | Dist | Beds/Ba | Sqft | Sold | Price | $/sf | Match |
|---|---|---|---|---|---|---|---|
| 54 Florence Ave | 0.09mi | 3/1.5 | 1,326 (+0%) | 4mo | $700,000 | $528 | 90 |
| 32 Gotham Ave | 0.17mi | 3/2.0 | 1,360 (+3%) | 5mo | $750,000 | $551 | 79 |
| 62 Abbey Ct | 0.34mi | 3/3.0 | 1,350 (+2%) | 2mo | $900,000 | $667 | 71 |
| 69 Eaton Ct | 0.24mi | 3/2.0 | 1,296 (-2%) | 13mo | $550,000 | $424 | 71 |
| 24 Cyrus Ave | 0.28mi | 3/1.5 | 1,260 (-4%) | 12mo | $585,000 | $464 | 68 |
| 72 & 70 Dictum Ct | 0.19mi | 3/1.0 | 1,211 (-8%) | 12mo | $550,000 | $454 | 67 |
| 2850 Gerritsen Ave | 0.21mi | 3/1.5 | 1,216 (-8%) | 10mo | $680,000 | $559 | 67 |
| 2472 Stuart St | 0.40mi | 3/3.0 | 1,296 (-2%) | 6mo | $717,000 | $553 | 65 |
| 102 Noel Ave | 0.23mi | 2/2.0 (-1) | 1,255 (-5%) | 9mo | $765,000 | $610 | 64 |
| 28 Knight Ct | 0.19mi | 3/2.0 | 1,182 (-10%) | 13mo | $725,000 | $613 | 58 |
| 48 Canton CL | 0.38mi | 4/1.0 (+1) | 1,203 (-9%) | 11mo | $700,000 | $582 | 54 |
| 101 Ebony Ct | 0.31mi | 3/2.5 | 1,484 (+12%) | 13mo | $760,000 | $512 | 48 |
Match score weights: distance 35% · size 25% · config 20% · recency 20%. Top-matched comps best support the ARV.
Projected returns pro-forma
-3.0% appreciation · 8.0% rent growth · sell at horizon
- IRR
- 9.1%
- Equity multiple
- 1.38×
- Total profit
- $36,579
- Equity at exit
- $51,441
- IRR
- 22.1%
- Equity multiple
- 3.33×
- Total profit
- $225,061
- Equity at exit
- $29,829
Cash invested: $96,600 (down + closing). Projections, not guarantees.
Landlord ↔ Tenant lean methodology
- Overall (CITY)
- 0 Strongly Tenant-Friendly
- State New York
- 15 Strongly Tenant-Friendly · D+10
- County
- — inherits STATE
- City New York
- 0 Strongly Tenant-Friendly · D+34
ZIP-level market 11229
- Rents YoY
- 15.8%
- Active inventory
- 355
- Price-to-rent
- 6.7×
Monthly cashflow live
- Estimated rent
- $4,295 medium interval (Pro) →
- Mortgage (P&I)
- −$1,809
- Tax from tax record
- −$278 /mo · $3,341/yr
- Insurance
- −$144
- Flood insurance flood zone
- −$66 /mo · $798/yr
- HOA
- −$0
- Vacancy / Maint / Mgmt
- −$902
- Net cashflow
- $1,095
Break-even live
UW: 25.0% down · 7.5% · 30yr · 1.5% tax · 5.0% vac · 8.0% maint · 8.0% mgmt
Financing live
Cash to close
- Down payment
- $86,250
- Closing costs
- $10,350
- Reserves months
- —
- Total cash needed
- —
Loan-product check · same deal, 3 products live
Conventional
25% down · 7.5% · 30yr
- Down + closing
- —
- Monthly P&I
- —
- Monthly cashflow
- —
- DSCR
- —
- Eligible?
- —
Personal DTI + credit; lowest rate.
DSCR
20% down · 8.5% · 30yr
- Down + closing
- —
- Monthly P&I
- —
- Monthly cashflow
- —
- DSCR
- —
- Eligible?
- —
No personal income docs; deal must DSCR.
Hard money
10% down · 12.0% · 12mo
- Down + closing
- —
- Monthly P&I
- —
- Monthly cashflow
- —
- DSCR
- —
- Eligible?
- —
Short-term bridge; refi at stabilization.
Rent comps 3 comps
| Address | Beds | Baths | Sqft | Rent | $/sqft | DOM | Units | Dist |
|---|---|---|---|---|---|---|---|---|
| 84 Gotham Ave Brooklyn, NY | 3.0 | 2.0 | 1516 | $5,000 | $3.30 | 24d | 1 | 0.12mi |
| 2002 E 29th St Unit 2F Brooklyn, NY | 4.0 | 1.5 | 1500 | $3,600 | $2.40 | 24d | 1 | 1.13mi |
| 2731 E 65th St Unit 1 Brooklyn, NY | 3.0 | 2.0 | 1300 | $3,400 | $2.62 | 24d | 1 | 1.24mi |
Listing history 10 events
-
2026-06-18days on market $345,000 Active 15 DOM
-
2026-06-17days on market $345,000 Active 14 DOM
-
2026-06-16days on market $345,000 Active 13 DOM
-
2026-06-15days on market $345,000 Active 12 DOM
-
2026-06-13days on market $345,000 Active 10 DOM
-
2026-06-09days on market $345,000 Active 6 DOM
-
2026-06-08days on market $345,000 Active 5 DOM
-
2026-06-07days on market $345,000 Active 4 DOM
-
2026-06-04remarks 531-char remark
-
2026-06-04$345,000 Active 1 DOM
ⓘ Source: listings_history table (triggers on properties + properties_extension) + one-shot
backfill from property_details.listing_events for pre-trigger history.
Tax reassessment forecast NY · Partial reset (capped growth)
- Current annual tax
- $3,341 · $278/mo
- Projected year-2 tax
- $4,586 · $382/mo
- Expected delta
- +$1,245/yr (+$104/mo · 37.3%)
ⓘ Screening estimate from a state-policy table — verify with the county assessor before closing.
Climate risk First Street
- Flood 7/10 Severe FEMA zone X (shaded) · 95% chance over 30 yrs
- Wildfire 4/10 Moderate
- Heat 7/10 Severe 7 d/yr ≥97°F today · 16 d/yr by 30 yrs out
- Wind 6/10 Major 72% chance of damaging wind over 30 yrs
- Air quality 5/10 Major 6 unhealthy d/yr today · 8 by 30 yrs out
Nearby sold comps map
Loading sold comps map…
Walkable amenities ~0.75 mi
Loading nearby amenities…
Taxation est. · year 1
- Rental income
- $51,544
- − Mortgage interest
- −$19,325
- − Property taxes
- −$3,341
- − Insurance
- −$2,522
- − Repairs & maintenance
- −$4,124
- − Management
- −$4,124
- − Depreciation
- −$10,036
- Taxable income
- $8,072
- Est. tax owed @ 24.0%
- −$1,937
- After-tax cash flow
- $11,209/yr
For passive investors: Depreciation is non-cash, so a rental often shows a tax loss while cash-flowing — sheltering income. Rental losses are passive: they offset passive income freely, and up to $25,000/yr can offset ordinary (W-2) income if you actively participate and your MAGI is under $100k (phasing out to $0 by $150k); unused losses carry forward. On sale, claimed depreciation is recaptured at up to 25%, and gains may owe capital-gains tax (a 1031 exchange can defer both). Figures are a year-1 estimate at your 24.0% rate — not tax advice; consult a CPA.
Schools (NCES district)
No district data.
Livability — New York
- Score
- 75/100
- State rank
- #268
- US rank
- #4188
Category grades
Schools grade is shown separately in the Schools card above.
Census & demographics
- Census place
- New York, NY
- County
- Kings County · 2,614,986 people
- City population
- 7,731,280
- Metro
- New York-Newark-Jersey City, NY-NJ-PA
- Population (ZIP)
- 78,377
- Household income
- $70,603
- Rent vs Own
- Severe rent burden
- 4771.0
Population outlook (Kings County) Hauer SSP2
- Today (2025)
- 2,847,441 people
- By 2030
- 2,937,006 · +3.1%
- By 2040
- 3,095,491 · +8.7%
- By 2050
- 3,228,968 · +13.4%
- By 2075
- 3,321,723 · +16.7%
- By 2100
- 3,111,387 · +9.3%
Race, ethnicity, and origin ACS 2023
- Neighborhood character
- Diverse neighborhood (Simpson 0.60)
- Race & ethnicity
- White 59% Asian 22% Hispanic / Latino 9% Black 6% Two or more races 6%
- Hispanic origin (detail)
- Mexican 2% Puerto Rican 3%
- Common ancestry
- Scotch-Irish 6% Subsaharan African 6% Romanian 1%
- Foreign-born
- 47% · China, Canada, Vietnam
- Languages at home
- 40% English-only · Russian/Polish/Slavic 22% Chinese 16% Spanish 6%
Political lean MEDSL · Kings
- 2024 margin
- Solid D (+44.0) · D 72.0% · R 28.0%
- 2008→2024 swing
- -15.5pp toward R · 2008: 59.4pp · 2024: 44.0pp
- All cycles
- 2024: D+44.0 2020: D+54.8 2016: D+61.8 2012: D+63.9 2008: D+59.4
Not yet ingested
- Civics
- —
Market trends
- HPI YoY
- ▼ -761.52%
- Current HPI
- 361.7011
- Rent YoY
- ▲ 15.81%
- Metro
- New York-Newark-Jersey City, NY-NJ-PA
- State GDP YoY
- ▲ 2.60%
- F500 in state
- 92
Industry mix (Fortune 500 HQ in NY)
| Industry | F500 HQs | Revenue |
|---|---|---|
| Financial Services | 10 | $950B |
|
||
| Consumer Goods | 9 | $162B |
|
||
| Insurance | 4 | $225B |
|
||
| Telecommunications | 2 | $144B |
|
||
| Pharmaceuticals | 2 | $112B |
|
||
| Media / Entertainment | 2 | $69B |
|
||
Price history
+200.0% since first listed2 events — show timeline
- 2026-06-03 Listed $345,000 OneKey® MLS as Distributed by MLS Grid
- 1993-11-30 Sold (Public Records) $115,000 Public Records
Property tax history
+5.7%/yrLatest (2025): $3,341 · +20.2% YoY. Source: county tax records.
Cash-flow waterfall
monthlySold comps — $/sqft
last 12 mo · ≤1 miLoading sold comps…