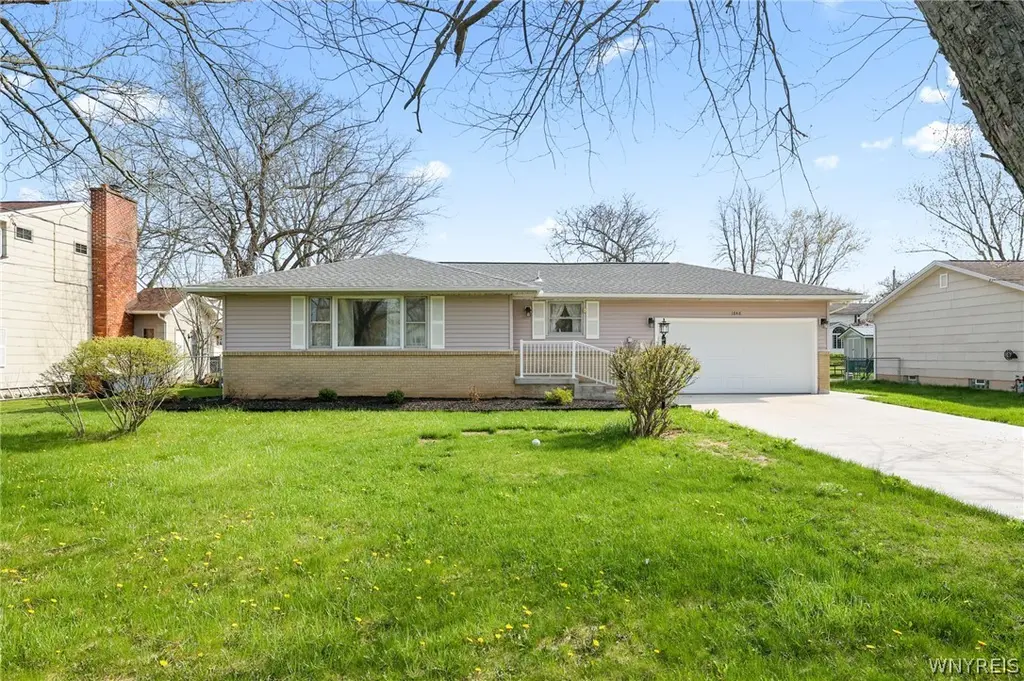
1848 Bedell Rd · Niagara Falls, NY
Flood risk 1/10 · Minimal
- FEMA flood zone
- X (unshaded)
- Chance of flooding over 30 yrs
- 0.0%
- Est. flood insurance / yr
- $473 – $860
Fire risk 2/10 · Minimal
- Est. fire insurance / yr
- $691 – $1,283
Heat risk 2/10 · Minimal
- Hot days now (above 94°F)
- 7 days/yr
- Hot days in 30 yrs
- 15 days/yr
Wind risk 1/10 · Minimal
- Chance of severe wind over 30 yrs
- —
Air-quality risk 3/10 · Minor
- Unhealthy air days now
- 2 days/yr
- Unhealthy air days in 30 yrs
- 3 days/yr
Risk factors via First Street. Map © Google.
Why this score? — see what drove the C- grade
The composite is a weighted blend of 9 inputs, each scored 0–100. Each bar is that input's sub-score; the figure is the points it added to the 100-point composite (weight × sub-score).
- Cash flow +15.3/30.0
- ARV discount +15.0/15.0
- Schools +5.0/10.0
- 1% rule +4.8/10.0
- DSCR +4.7/10.0
- Livability +3.0/5.0
- Rent growth +2.5/5.0
- Condition / age +2.5/5.0
- Appreciation +0.0/10.0
$259,900
🖨 Deal sheet (PDF) 📄 Offer letter ✓ Due diligence
Listing remarks
Welcome to 1848 Bedell Rd - a spacious 3-bedroom ranch in Grand Island offering a rare combination of layout, convenience, and extensive major updates already completed. Step inside to a bright living room that flows into the eat-in kitchen, leading to a generous family room with dining area - creating an open, functional layout ideal for everyday living and entertaining. The family room features a sliding glass door that leads to the deck and fully fenced backyard. Hardwood flooring runs through the living room and all three bedrooms. The full bathroom was completely remodeled in 2022, including updated plumbing, and also features first-floor laundry for added convenience. All appliances a
Key facts
- Hardwood flooring
- Bright living room
- Eat-in kitchen
Tags
Property features AI
Finance
- HOA & community: Walking trails/paths nearby
Exterior
- Parking: Attached 2-car garage; Driveway; Garage door opener
- Utilities: Electricity connected; Public water connected; Sewer connected
- Home design: Single-story house; Resale property; Rectangular lot with approximately 75 x 175 dimensions; Main thoroughfare frontage
- Construction: Brick and frame construction with vinyl siding; Copper plumbing; Poured foundation; Existing (previously built) property
- Exterior features: Concrete driveway; Deck; Fully fenced yard; Shed(s)/storage
Interior
- Kitchen: Gas oven; Gas range; Refrigerator; Eat-in layout
- Bedrooms: Three bedrooms on the main level; Bedroom dimensions approximately 13 x 11, 11 x 9, and 10 x 11
- Flooring: Carpet; Hardwood; Resilient flooring; Tile; Varied flooring types
- Bathrooms: One full bathroom on the main level
- Heating & cooling: Ductless cooling; Ductless heating; Gas heating; Baseboard heating
- Interior features: Eat-in kitchen; Separate/formal living room; Combined living and dining area; Sliding glass door(s); Accessible bedroom; No stairs (single-level access); Main level primary bedroom; Sliding interior doors
- Laundry & utility: Washer and dryer included; Laundry on main level with accessible utilities; Gas water heater; Sump pump in full basement
Neighborhood map
What this means for you Summary
Snapshot
- This is a 3-bed/1.0-bath single-family listed at $260k.
Deal economics
- At list price, monthly cash flow is $94 ($1k/yr) — positive.
- The deal already cash-flows at list — no discount required.
- To meet the 1% rule (rent ≥ 1% of price), the offer needs to be $254k (2.1% below list).
- Recommended offer: $254k (2.1% below list) — sets the bar for 1% rule.
Location & tenants
- Location reads 60/100 on livability (#956 in NY) — a middle-class / working-renter tenant base. Strengths: cost of living A+, housing A+; Watch: schools F, crime F, amenities F.
- Grand Island Central School District (suburban): math 54% / reading 57% proficiency, ranked #263 of 590 in NY (top 45%) — acceptable for families but not a draw, mixed tenant base, ~2y average lease; only 15% free/reduced lunch — higher-income household profile.
- Market conditions: 129 active listings in the ZIP; 2 comparable units currently listed for rent nearby; high-income renter base; 1,244 units permitted in Erie County in 2024 (563 in 5+ unit buildings).
Forward outlook
- Local home prices are declining (-3.0%/yr); year-one equity from $2k of loan paydown is wiped out by about $8k of value loss. Plan a longer hold.
Negotiation context
- Only 9 days on market — expect competitive offers; lowballing is unlikely to land.
Questions for the listing agent
- Built in 1967 — when were the roof, HVAC, electrical panel, plumbing, and water heater last replaced?
- Is there a deadline driving the sale (1031 exchange, divorce, estate, relocation)? That informs how much negotiation room exists.
- Schools are F-rated, which usually means shorter tenancies and higher turnover. Who's the typical renter profile here, and what's been the actual vacancy rate?
- Crime grade is F in this area — have there been break-ins, vandalism, or insurance claims at this property in the last 3 years? What carrier currently insures it and at what premium?
- What's the average days-on-market for RENTAL listings here right now (not sales)? A rising rental-DOM trend means longer vacancies and softer asking-rent achievability than the comps imply.
- What's the recent tenant-quality profile in this submarket — average credit score on applications, eviction rate, late-payment / NSF rate, and stable-employment percentage? A property-management company in the area should have these aggregated.
- How much new for-sale + rental construction is in the pipeline within 1–3 miles? Heavy new supply typically softens prices + rents 12–24 months out; constrained supply supports both.
Investment metrics
- 1% rule
- 0.98% ✗
- Cap rate
- 6.73%
- Cash-on-cash
- 1.55%
- DSCR
- 1.07
- GRM
- 8.5
CMA / ARV
- ARV (median comp)
- $370,219
- List price
- $259,900
- Delta
- -29.80%
- Verdict
- UNDERPRICED
- Comps
- 20 within 1.0 mi
Projected returns pro-forma
-3.0% appreciation · 3.0% rent growth · sell at horizon
- IRR
- -13.8%
- Equity multiple
- 0.51×
- Total profit
- $-36,022
- Equity at exit
- $38,752
- IRR
- -4.9%
- Equity multiple
- 0.68×
- Total profit
- $-23,212
- Equity at exit
- $22,471
Cash invested: $72,772 (down + closing). Projections, not guarantees.
Landlord ↔ Tenant lean methodology
- Overall (STATE)
- 15 Strongly Tenant-Friendly
- State New York
- 15 Strongly Tenant-Friendly · D+10
- County
- — inherits STATE
- City
- — inherits STATE
ZIP-level market 14072
- Active inventory
- 129
- Price-to-rent
- 8.5×
Monthly cashflow live
- Estimated rent
- $2,544 medium interval (Pro) →
- Mortgage (P&I)
- −$1,363
- Tax from tax record
- −$444 /mo · $5,331/yr
- Insurance
- −$108
- HOA
- −$0
- Vacancy / Maint / Mgmt
- −$534
- Net cashflow
- $94
Break-even live
Sensitivity live
| Price | -10% $241 | -5% $167 | +0% $94 | +5% $20 | +10% $-53 |
|---|---|---|---|---|---|
| Rent | -10% $-107 | -5% $-7 | +0% $94 | +5% $194 | +10% $295 |
| Rate | -1.0pp $225 | -0.5pp $160 | base $94 | +0.5pp $27 | +1.0pp $-42 |
UW: 25.0% down · 7.5% · 30yr · 1.5% tax · 5.0% vac · 8.0% maint · 8.0% mgmt
Financing live
Cash to close
- Down payment
- $64,975
- Closing costs
- $7,797
- Reserves months
- —
- Total cash needed
- —
Loan-product check · same deal, 3 products live
Conventional
25% down · 7.5% · 30yr
- Down + closing
- —
- Monthly P&I
- —
- Monthly cashflow
- —
- DSCR
- —
- Eligible?
- —
Personal DTI + credit; lowest rate.
DSCR
20% down · 8.5% · 30yr
- Down + closing
- —
- Monthly P&I
- —
- Monthly cashflow
- —
- DSCR
- —
- Eligible?
- —
No personal income docs; deal must DSCR.
Hard money
10% down · 12.0% · 12mo
- Down + closing
- —
- Monthly P&I
- —
- Monthly cashflow
- —
- DSCR
- —
- Eligible?
- —
Short-term bridge; refi at stabilization.
Rent comps 2 comps
| Address | Beds | Baths | Sqft | Rent | $/sqft | DOM | Units | Dist |
|---|---|---|---|---|---|---|---|---|
| 2255 Center Ter Grand Island, NY | 2.0–3.0 | 1.0–2.5 | 1057 | $2,300 | $2.18 | 2d | 24 | 0.99mi |
| 1993 Grand Island Blvd Grand Island, NY | 1.0–3.0 | 1.0–2.0 | 1097 | $22,260 | $20.28 | 2d | 33 | 1.20mi |
Listing history 2 events
-
2026-05-06status Pending 1837-char remark
-
2026-04-27$259,900 Active 1837-char remark
ⓘ Source: listings_history table (triggers on properties + properties_extension) + one-shot
backfill from property_details.listing_events for pre-trigger history.
Tax reassessment forecast NY · Partial reset (capped growth)
- Current annual tax
- $5,331 · $444/mo
- Projected year-2 tax
- $5,331 · $444/mo
- Expected delta
- $0/yr ($0/mo · 0.0%)
ⓘ Screening estimate from a state-policy table — verify with the county assessor before closing.
Climate risk First Street
- Flood 1/10 Low FEMA zone X (unshaded) · 0% chance over 30 yrs
- Wildfire 2/10 Low
- Heat 2/10 Low 7 d/yr ≥94°F today · 15 d/yr by 30 yrs out
- Wind 1/10 Low
- Air quality 3/10 Moderate 2 unhealthy d/yr today · 3 by 30 yrs out
Nearby sold comps map
Loading sold comps map…
Walkable amenities ~0.75 mi
Loading nearby amenities…
Taxation est. · year 1
- Rental income
- $30,523
- − Mortgage interest
- −$14,558
- − Property taxes
- −$5,331
- − Insurance
- −$1,300
- − Repairs & maintenance
- −$2,442
- − Management
- −$2,442
- − Depreciation
- −$7,561
- Taxable loss
- −$3,111
- Est. tax savings @ 24.0%
- +$747
- After-tax cash flow
- $1,873/yr
For passive investors: Depreciation is non-cash, so a rental often shows a tax loss while cash-flowing — sheltering income. Rental losses are passive: they offset passive income freely, and up to $25,000/yr can offset ordinary (W-2) income if you actively participate and your MAGI is under $100k (phasing out to $0 by $150k); unused losses carry forward. On sale, claimed depreciation is recaptured at up to 25%, and gains may owe capital-gains tax (a 1031 exchange can defer both). Figures are a year-1 estimate at your 24.0% rate — not tax advice; consult a CPA.
Schools (NCES district)
- District
- Grand Island Central School District
- NCES district ID
- 3607020
- Math proficiency
- 54% ▼ -15.00%
- Reading proficiency
- 57% ▼ -1.00%
- Median HH income
- $77,014
- Composite
- 49.92/100
- National rank
- #1938
- State rank
- #263 of 590 in NY
Livability — Niagara Falls
- Score
- 60/100
- State rank
- #956
- US rank
- #18749
Category grades
Schools grade is shown separately in the Schools card above.
Census & demographics
- County
- Erie County · 714,559 people
- City population
- 62,983
- Metro
- Buffalo-Cheektowaga, NY
- Population (ZIP)
- 21,488
- Household income
- $115,991
- Rent vs Own
- Severe rent burden
- 283.0
Population outlook (Erie County) Hauer SSP2
- Today (2025)
- 933,037 people
- By 2030
- 935,181 · +0.2%
- By 2040
- 928,531 · -0.5%
- By 2050
- 905,725 · -2.9%
- By 2075
- 834,037 · -10.6%
- By 2100
- 708,033 · -24.1%
Race, ethnicity, and origin ACS 2023
- Neighborhood character
- Predominantly White (90%)
- Race & ethnicity
- White 90% Two or more races 4% Hispanic / Latino 3% Black 2% Asian 2%
- Common ancestry
- Romanian 16% Lithuanian 3% Slovak 3%
- Foreign-born
- 5% · Canada
- Languages at home
- 92% English-only · Spanish 3% Other Indo-European 2% Arabic 1%
Political lean MEDSL · Erie
- 2024 margin
- Lean D (+9.7) · D 54.8% · R 45.2%
- 2008→2024 swing
- -7.9pp toward R · 2008: 17.5pp · 2024: 9.7pp
- All cycles
- 2024: D+9.7 2020: D+14.7 2016: D+4.8 2012: D+15.6 2008: D+17.5
Not yet ingested
- Civics
- —
Market trends
- HPI YoY
- ▼ -218.87%
- Current HPI
- 332.5322
- Rent YoY
- —
- Metro
- Buffalo-Cheektowaga, NY
- State GDP YoY
- ▲ 2.60%
- F500 in state
- 92
Industry mix (Fortune 500 HQ in NY)
| Industry | F500 HQs | Revenue |
|---|---|---|
| Financial Services | 10 | $950B |
|
||
| Consumer Goods | 9 | $162B |
|
||
| Insurance | 4 | $225B |
|
||
| Telecommunications | 2 | $144B |
|
||
| Pharmaceuticals | 2 | $112B |
|
||
| Media / Entertainment | 2 | $69B |
|
||
Price history
2 events — show timeline
- 2026-05-06 Pending — WNYREIS
- 2026-04-27 Listed $259,900 WNYREIS
Property tax history
+6.9%/yrLatest (2025): $5,331 · +27.1% YoY. Source: county tax records.
Cash-flow waterfall
monthlySold comps — $/sqft
last 12 mo · ≤1 miLoading sold comps…