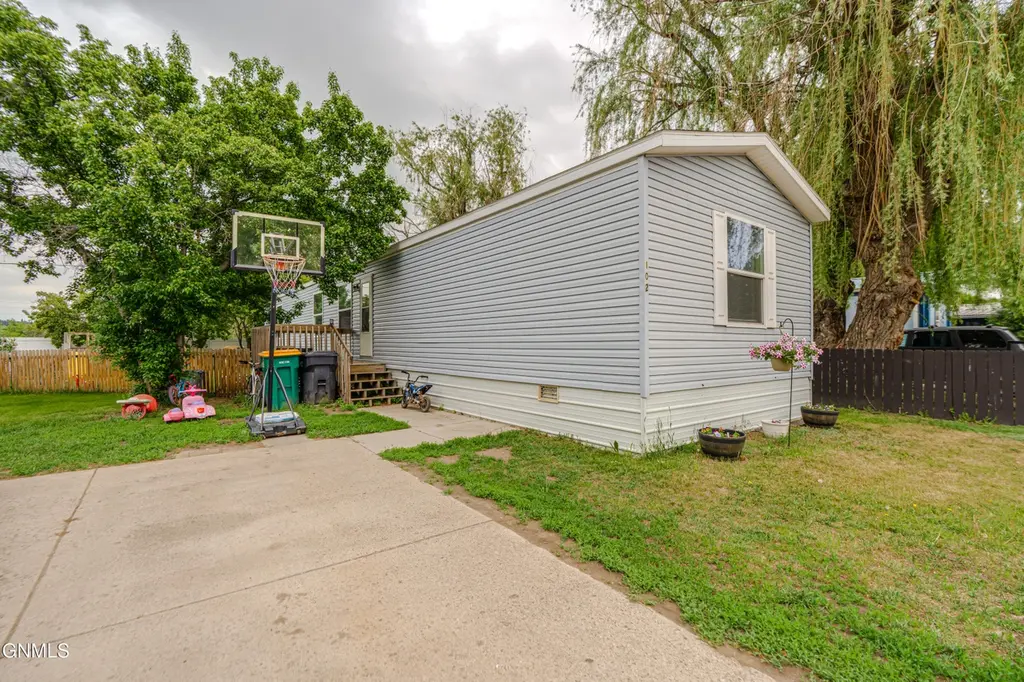
102 W Antelope St · Mandan, ND
Flood risk 1/10 · Minimal
- FEMA flood zone
- X (shaded)
- Chance of flooding over 30 yrs
- 0.0%
- Est. flood insurance / yr
- $507 – $1,088
Fire risk 4/10 · Minor
- Est. fire insurance / yr
- $1,289 – $2,393
Heat risk 2/10 · Minimal
- Hot days now (above 97°F)
- 7 days/yr
- Hot days in 30 yrs
- 12 days/yr
Wind risk 2/10 · Minimal
- Chance of severe wind over 30 yrs
- —
Air-quality risk 4/10 · Minor
- Unhealthy air days now
- 4 days/yr
- Unhealthy air days in 30 yrs
- 4 days/yr
Risk factors via First Street. Map © Google.
Why this score? — see what drove the B grade
The composite is a weighted blend of 9 inputs, each scored 0–100. Each bar is that input's sub-score; the figure is the points it added to the 100-point composite (weight × sub-score).
- Cash flow +30.0/30.0
- ARV discount +10.3/15.0
- 1% rule +10.0/10.0
- DSCR +10.0/10.0
- Rent growth +5.0/5.0
- Livability +3.5/5.0
- Schools +3.3/10.0
- Condition / age +2.2/5.0
- Appreciation +0.0/10.0
$65,000
🖨 Deal sheet 📄 Offer letter ✓ Due diligence
Listing remarks MLS
MOTIVATED SELLER BRING AN OFFER! Well maintained mobile home with 3 bedrooms and a full bathroom. The open floor plan allows for lots of light to fill the kitchen and living room. The home has 3 bedrooms which includes a large master bedroom. The laundry is right off the master with the washer and dryer included. The exterior is in great shape with a yard shed included. Call an agent today to look at this clean home.
Key facts
- Driveway
- Private bathroom
- Nice yard
Tags
Property features AI
Exterior
- Utilities: Public water; Public sewer
- Home design: Manufactured home (single wide); Residential property
- Construction: Vinyl siding; Built as a manufactured home
- Exterior features: No additional exterior features listed; Shingle roof
Interior
- Kitchen: Dishwasher; Gas range; Refrigerator
- Bedrooms: Bedrooms located on main level
- Bathrooms: 2 full bathrooms
- Heating & cooling: Central air conditioning; Ceiling fan(s) for cooling; Forced air heating; Natural gas heating
- Interior features: Ceiling fans; Window treatments
Neighborhood map
What this means for you Summary
Snapshot
- This is a 3-bed/2.0-bath manufactured listed at $65k. Condition is rated fair.
Deal economics
- At list price, monthly cash flow is $527 ($6k/yr) — positive.
- The deal already cash-flows at list — no discount required.
- Meets the 1% rule at list price ($1k rent vs $65k).
- Recommended offer: $64k (1.5% below list) — sets the bar for market timing.
- Cap rate 16.0% vs local median 2.7% in Mandan — top-decile yield for the area; either an underpriced asset or a hidden risk that comps aren't pricing in. Stress-test before assuming the spread holds.
Location & tenants
- Location reads 70/100 on livability (#76 in ND) — a middle-class / working-renter tenant base. Strengths: cost of living A+, housing A+, employment A; Watch: crime C-, amenities F, commute F.
- Mandan 1 (suburban): math 35% / reading 38% proficiency, ranked #32 of 53 in ND (top 60%) — families likely to look elsewhere, expect single-tenant / working-renter base with shorter leases.
- Zoned schools: Mandan Middle School (math 36% / reading 40%, grade F, #21 of 35 statewide, top 59%, 928 students, 30% FRL); Mandan High School (math 18% / reading 42%, grade F, #90 of 144 statewide, top 66%, 1,138 students, 25% FRL) — zoned schools at 28% FRL track the district average.
- Market conditions: Rents rising fast (+14.0%/yr); 304 active listings in the ZIP; 4 comparable units currently listed for rent nearby; rentals at typical pace (median 21d on market — plan ~3-4 weeks tenant-placement turnaround); solid renter incomes; 94 units permitted in Morton County in 2024 (5 in 5+ unit buildings).
Forward outlook
- Local home prices are declining (-3.0%/yr); year-one equity from $449 of loan paydown is wiped out by about $2k of value loss. Plan a longer hold.
- Morton County population projected at +48% by 2050 — long-run rental-demand tailwind backs the buy-and-hold thesis.
- At projected returns (-3.0% appreciation + 8.0% rent growth), your $18k cash investment doubles in ~4 years — after that, you're playing with house money.
Negotiation context
- It's been on market 17 days — a 2% lower offer ($64k) is reasonable based on typical stale-listing flexibility.
- 2 sale attempts since 9y ago with the ask held roughly flat each time — persistent listings suggest the price (not the market) is what's stuck; bring a comps-based counter.
Questions for the listing agent
- Have any recent inspections been done? Can we get a copy of the seller's disclosures and any deferred-maintenance estimates?
- Is there a deadline driving the sale (1031 exchange, divorce, estate, relocation)? That informs how much negotiation room exists.
- What's the average days-on-market for RENTAL listings here right now (not sales)? A rising rental-DOM trend means longer vacancies and softer asking-rent achievability than the comps imply.
- What's the recent tenant-quality profile in this submarket — average credit score on applications, eviction rate, late-payment / NSF rate, and stable-employment percentage? A property-management company in the area should have these aggregated.
- How much new for-sale + rental construction is in the pipeline within 1–3 miles? Heavy new supply typically softens prices + rents 12–24 months out; constrained supply supports both.
Investment metrics
- 1% rule
- 1.90% ✓
- Cap rate
- 16.02%
- Cash-on-cash
- 34.73%
- DSCR
- 2.55
- GRM
- 4.4
CMA / ARV
- ARV (on-the-fly)
- $69,312
- Comps found
- 12
Show comp detail 12 sales within ~0.75 mi
| Address | Dist | Beds/Ba | Sqft | Sold | Price | $/sf | Match |
|---|---|---|---|---|---|---|---|
| 403 E Prairie Ln | 0.20mi | 3/2.0 | 1,216 (0%) | 3mo | $65,000 | $53 | 88 |
| 203 E Deer St | 0.26mi | 3/2.0 | 1,250 (+3%) | 1mo | $35,000 | $28 | 82 |
| 213 S Prairie Ln | 0.29mi | 3/2.0 | 1,216 (0%) | 7mo | $69,000 | $57 | 80 |
| 229 Prairie Ln | 0.33mi | 3/2.0 | 1,216 (0%) | 10mo | $29,900 | $25 | 77 |
| 102 Deer St | 0.15mi | 3/2.0 | 1,140 (-6%) | 8mo | $79,000 | $69 | 76 |
| 104 Deer St | 0.15mi | 3/2.0 | 1,140 (-6%) | 9mo | $79,000 | $69 | 76 |
| 185 South Prairie Ln | 0.27mi | 3/2.0 | 1,280 (+5%) | 9mo | $70,000 | $55 | 71 |
| 703 6th Ave SE Unit C16 | 0.42mi | 3/1.0 | 1,140 (-6%) | 7mo | $79,999 | $70 | 60 |
| 405 Prairie Ln | 0.20mi | 2/2.0 (-1) | 1,076 (-12%) | 8mo | $26,000 | $24 | 60 |
| 1217 9th Ave SE | 0.74mi | 3/2.0 | 1,280 (+5%) | 2mo | $217,500 | $170 | 56 |
| 105 Gateway Trl | 0.72mi | 3/2.0 | 1,280 (+5%) | 3mo | $30,000 | $23 | 56 |
| 1208 7th Ave SE | 0.67mi | 3/1.0 | 1,320 (+9%) | 7mo | $145,000 | $110 | 44 |
Match score weights: distance 35% · size 25% · config 20% · recency 20%. Top-matched comps best support the ARV.
Projected returns pro-forma
-3.0% appreciation · 8.0% rent growth · sell at horizon
- IRR
- 35.8%
- Equity multiple
- 2.62×
- Total profit
- $29,560
- Equity at exit
- $9,692
- IRR
- 45.0%
- Equity multiple
- 6.42×
- Total profit
- $98,725
- Equity at exit
- $5,620
Cash invested: $18,200 (down + closing). Projections, not guarantees.
Landlord ↔ Tenant lean methodology
- Overall (STATE)
- 82 Strongly Landlord-Friendly
- State North Dakota
- 82 Strongly Landlord-Friendly · R+20
- County
- — inherits STATE
- City
- — inherits STATE
ZIP-level market 58554
- Rents YoY
- 14.0%
- Active inventory
- 304
- Price-to-rent
- 4.4×
Monthly cashflow live
- Estimated rent
- $1,235 medium interval (Pro) →
- Mortgage (P&I)
- −$341
- Tax est. 1.5%
- −$81 /mo · $975/yr
- Insurance
- −$27
- HOA
- −$0
- Vacancy / Maint / Mgmt
- −$259
- Net cashflow
- $527
Break-even live
UW: 25.0% down · 7.5% · 30yr · 1.5% tax · 5.0% vac · 8.0% maint · 8.0% mgmt
Financing live
Cash to close
- Down payment
- $16,250
- Closing costs
- $1,950
- Reserves months
- —
- Total cash needed
- —
Loan-product check · same deal, 3 products live
Conventional
25% down · 7.5% · 30yr
- Down + closing
- —
- Monthly P&I
- —
- Monthly cashflow
- —
- DSCR
- —
- Eligible?
- —
Personal DTI + credit; lowest rate.
DSCR
20% down · 8.5% · 30yr
- Down + closing
- —
- Monthly P&I
- —
- Monthly cashflow
- —
- DSCR
- —
- Eligible?
- —
No personal income docs; deal must DSCR.
Hard money
10% down · 12.0% · 12mo
- Down + closing
- —
- Monthly P&I
- —
- Monthly cashflow
- —
- DSCR
- —
- Eligible?
- —
Short-term bridge; refi at stabilization.
Rent comps 4 comps
| Address | Beds | Baths | Sqft | Rent | $/sqft | DOM | Units | Dist |
|---|---|---|---|---|---|---|---|---|
| 100 1st St NW Mandan, ND | 1.0–2.0 | 1.0 | 887 | $1,150 | $1.30 | 21d | 11 | 0.47mi |
| 611 9th Ave SW Mandan, ND | 2.0 | 1.0 | 942 | $1,125 | $1.19 | 21d | 1 | 0.67mi |
| 406 4th St NW Mandan, ND | 3.0 | 1.5 | 1208 | $1,200 | $0.99 | 21d | 1 | 0.69mi |
| 1504 Shannon Dr NE Mandan, ND | 2.0 | 1.0 | 1000 | $1,000 | $1.00 | 21d | 1 | 1.22mi |
Listing history 13 events
-
2026-06-19days on market $65,000 Active 17 DOM
-
2026-06-18days on market $65,000 Active 16 DOM
-
2026-06-17days on market $65,000 Active 15 DOM
-
2026-06-16days on market $65,000 Active 14 DOM
-
2026-06-15days on market $65,000 Active 13 DOM
-
2026-06-14days on market $65,000 Active 11 DOM
-
2026-06-13days on market $65,000 Active 10 DOM
-
2026-06-10days on market $65,000 Active 8 DOM
-
2026-06-09days on market $65,000 Active 7 DOM
-
2026-06-08days on market $65,000 Active 6 DOM
-
2026-06-07days on market $65,000 Active 5 DOM
-
2026-06-05days on market $65,000 Active 2 DOM
-
2026-06-03$65,000 Active 1 DOM
ⓘ Source: listings_history table (triggers on properties + properties_extension) + one-shot
backfill from property_details.listing_events for pre-trigger history.
Climate risk First Street
- Flood 1/10 Low FEMA zone X (shaded) · 0% chance over 30 yrs
- Wildfire 4/10 Moderate
- Heat 2/10 Low 7 d/yr ≥97°F today · 12 d/yr by 30 yrs out
- Wind 2/10 Low
- Air quality 4/10 Moderate 4 unhealthy d/yr today · 4 by 30 yrs out
Nearby sold comps map
Loading sold comps map…
Walkable amenities ~0.75 mi
Loading nearby amenities…
Taxation est. · year 1
- Rental income
- $14,824
- − Mortgage interest
- −$3,641
- − Property taxes
- −$975
- − Insurance
- −$325
- − Repairs & maintenance
- −$1,186
- − Management
- −$1,186
- − Depreciation
- −$1,891
- Taxable income
- $5,620
- Est. tax owed @ 24.0%
- −$1,349
- After-tax cash flow
- $4,972/yr
For passive investors: Depreciation is non-cash, so a rental often shows a tax loss while cash-flowing — sheltering income. Rental losses are passive: they offset passive income freely, and up to $25,000/yr can offset ordinary (W-2) income if you actively participate and your MAGI is under $100k (phasing out to $0 by $150k); unused losses carry forward. On sale, claimed depreciation is recaptured at up to 25%, and gains may owe capital-gains tax (a 1031 exchange can defer both). Figures are a year-1 estimate at your 24.0% rate — not tax advice; consult a CPA.
Condition & rehab AI · 12 photos
This mobile home requires moderate repairs and maintenance, with potential for significant value increase through cosmetic updates.
Repairs flagged
- Moderate Kitchen cabinets — Worn appearance
- Minor Bathroom fixtures — Slight discoloration
Value-add opportunities
- Both Paint exterior and interior walls — Fresh paint enhances curb appeal and interior aesthetics
- Resale Replace worn kitchen cabinets — New cabinets improve functionality and appearance
- Resale Upgrade bathroom fixtures — Modern fixtures attract more buyers
Renovation cost estimate screening
| Repair item | Severity | Est. cost |
|---|---|---|
| Kitchen cabinets · Worn appearance | Moderate | $3,000–15,000 |
| Bathroom fixtures · Slight discoloration | Minor | $500–3,000 |
| Total estimated repair cost · 2 items | $3,500–18,000 |
Value-add ROI direction
- Both Paint exterior and interior walls — Fresh paint enhances curb appeal and interior aesthetics ↑
- Resale Replace worn kitchen cabinets — New cabinets improve functionality and appearance ↑
- Resale Upgrade bathroom fixtures — Modern fixtures attract more buyers ↑
ⓘ Cost ranges are severity-bucket heuristics (US national rule-of-thumb). Get contractor quotes + a written scope before underwriting a rehab budget.
Schools (NCES district)
- District
- Mandan 1
- NCES district ID
- 3811820
- Math proficiency
- 35% ▼ -11.00%
- Reading proficiency
- 38% ▼ -5.00%
- Median HH income
- $60,131
- Composite
- 32.55/100
- National rank
- #5692
- State rank
- #32 of 53 in ND
Livability — Mandan
- Score
- 70/100
- State rank
- #76
- US rank
- #7567
Category grades
Schools grade is shown separately in the Schools card above.
Census & demographics
- Census place
- Mandan, ND
- County
- Morton County · 29,479 people
- City population
- 29,479
- Metro
- Bismarck, ND
- Population (ZIP)
- 29,479
- Household income
- $80,120
- Rent vs Own
- Severe rent burden
- 915.0
Population outlook (Morton County) Hauer SSP2
- Today (2025)
- 36,682 people
- By 2030
- 39,967 · +9.0%
- By 2040
- 46,921 · +27.9%
- By 2050
- 54,157 · +47.6%
- By 2075
- 73,661 · +100.8%
- By 2100
- 89,885 · +145.0%
Race, ethnicity, and origin ACS 2023
- Neighborhood character
- Predominantly White (87%)
- Race & ethnicity
- White 87% Hispanic / Latino 5% Native American 4% Two or more races 4% Black 2%
- Common ancestry
- Portuguese 14% Scotch-Irish 4% Iranian 2%
- Foreign-born
- 1% · Canada
- Languages at home
- 95% English-only · Spanish 3% German/W. Germanic 1%
Political lean MEDSL · Morton
- 2024 margin
- Solid R (+53.8) · D 22.2% · R 75.9% · Other 1.9%
- 2008→2024 swing
- -32.7pp toward R · 2008: -21.0pp · 2024: -53.8pp
- All cycles
- 2024: R+53.8 2020: R+50.4 2016: R+53.0 2012: R+31.1 2008: R+21.0
Not yet ingested
- Civics
- —
Market trends
- HPI YoY
- ▼ -161.81%
- Current HPI
- 137.8984
- Rent YoY
- ▲ 14.00%
- Metro
- Bismarck, ND
- State GDP YoY
- ▲ 2.09%
- F500 in state
- 2
Industry mix (Fortune 500 HQ in ND)
| Industry | F500 HQs | Revenue |
|---|---|---|
| Utilities / Construction | 1 | $6B |
|
||
Price history
+161.0% since first listed3 events — show timeline
- 2026-06-02 Listed $65,000 GNMLS
- 2017-11-22 Sold (MLS) — GNMLS
- 2017-09-18 Listed $24,900 GNMLS
Cash-flow waterfall
monthlySold comps — $/sqft
last 12 mo · ≤1 miLoading sold comps…