 Multi-family
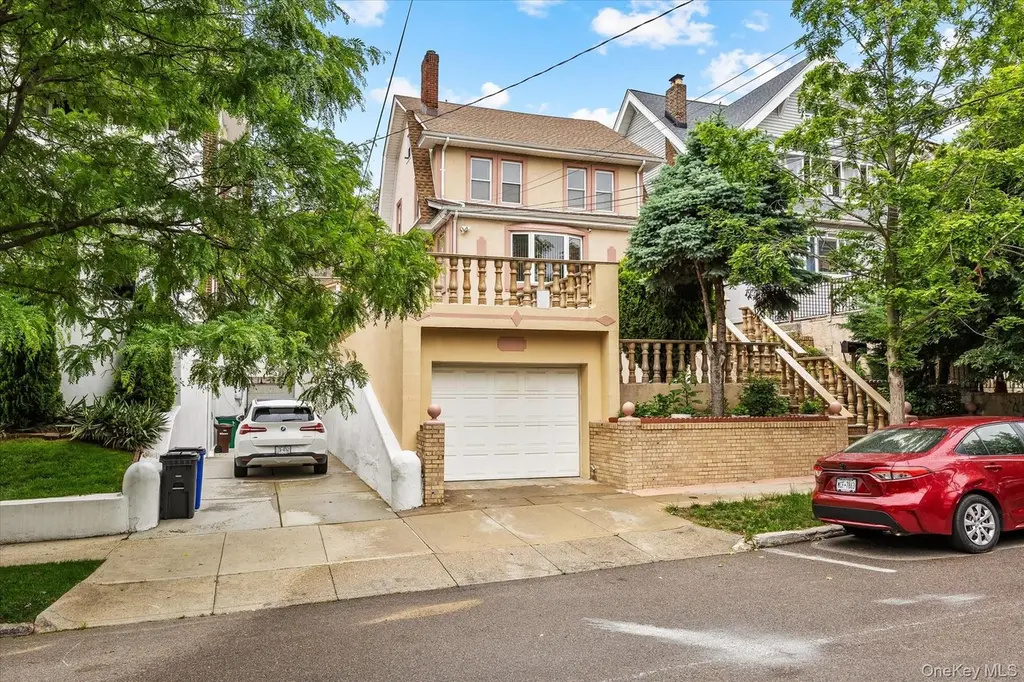
14837 86th Ave · New York, NY
Flood risk 1/10 · Minimal
- FEMA flood zone
- X (unshaded)
- Chance of flooding over 30 yrs
- 0.0%
- Est. flood insurance / yr
- $507 – $1,088
Fire risk 1/10 · Minimal
- Est. fire insurance / yr
- $691 – $1,283
Heat risk 6/10 · Moderate
- Hot days now (above 99°F)
- 7 days/yr
- Hot days in 30 yrs
- 15 days/yr
Wind risk 6/10 · Moderate
- Chance of severe wind over 30 yrs
- 50.0%
Air-quality risk 4/10 · Minor
- Unhealthy air days now
- 6 days/yr
- Unhealthy air days in 30 yrs
- 6 days/yr
Risk factors via First Street. Map © Google.
Why this score? — see what drove the D- grade
The composite is a weighted blend of 9 inputs, each scored 0–100. Each bar is that input's sub-score; the figure is the points it added to the 100-point composite (weight × sub-score).
- Cash flow +14.0/30.0
- Schools +5.0/10.0
- DSCR +4.2/10.0
- Livability +3.8/5.0
- 1% rule +3.1/10.0
- Rent growth +3.0/5.0
- Condition / age +2.5/5.0
- ARV discount +2.2/15.0
- Appreciation +0.0/10.0
$1,399,999
🖨 Deal sheet (PDF) 📄 Offer letter ✓ Due diligence
Multi-family units
County records classify this as Multi-Family (2-4 Unit). Listing-text estimate: 1 unit. estimate disagrees with records
Listing remarks
Exceptional opportunity to own a well-maintained, turnkey multi-family income-producing property offering four levels of versatile living space, including a spacious walk-up attic with impressive ceiling height. Boasting approximately 3,169 sq. ft. of interior space situated on a generous 40 ft. x 123 ft. lot (approximately 5,112 sq. ft. ), this property offers comfort, functionality, and investment potential. Enjoy the convenience of an attached garage with direct interior access, allowing you to get to your vehicle comfortably during inclement weather. The thoughtfully designed layout creates a sense of privacy and security, while the expansive yard provides excellent space for entertaini
Key facts
- Attached garage
- Expansive yard
- 5,112 sq ft lot
Tags
Property features AI
Exterior
- Parking: Two parking spaces; 2-car garage with garage door opener
- Utilities: Public sewer; Cable connected; Electricity connected; Natural gas connected; Trash collection (public); Water connected
- Home design: Triplex
- Construction: Brick and frame construction
- Exterior features: Brick and frame construction; Not waterfront
Interior
- Kitchen: Eat-in kitchen; Kitchen island
- Bedrooms: One 1-bedroom unit; Two 2-bedroom units
- Bathrooms: Five full bathrooms
- Heating & cooling: Hot water heating; No central cooling
- Interior features: First-floor bedroom; First-floor full bathroom; Built-in features; Chandelier; Eat-in kitchen; Kitchen island
Neighborhood map
What this means for you Summary
Snapshot
- This is a 5-bed/5.0-bath multifamily listed at $1.40M.
Deal economics
- At list price, monthly cash flow is $173 ($2k/yr) — positive.
- The deal already cash-flows at list — no discount required.
- To meet the 1% rule (rent ≥ 1% of price), the offer needs to be $1.14M (18.8% below list).
- Recommended offer: $1.14M (18.8% below list) — sets the bar for 1% rule.
- Cap rate 6.4% vs local median 2.6% in New York — top-decile yield for the area; either an underpriced asset or a hidden risk that comps aren't pricing in. Stress-test before assuming the spread holds.
Location & tenants
- Location reads 75/100 on livability (#268 in NY, #4,188 nationally) — a middle-class / working-renter tenant base. Strengths: amenities A+, commute A+, health & safety A; Watch: crime F, cost of living F.
- Market conditions: Rents rising (+2.0%/yr); 171 active listings in the ZIP; solid renter incomes; 5,302 units permitted in Queens County in 2024 (4,918 in 5+ unit buildings).
- At $11,370/mo this rent would consume 171% of the median local household income ($80k/yr) (locally 3361% of renters already pay >50% of income on rent) — very limited rent-growth headroom before tenants either downsize or default.
Forward outlook
- Local home prices are declining (-3.0%/yr); year-one equity from $10k of loan paydown is wiped out by about $42k of value loss. Plan a longer hold.
- Queens County population projected at +16% by 2050 — long-run rental-demand tailwind backs the buy-and-hold thesis.
Negotiation context
- It's been on market 19 days — a 2% lower offer ($1.38M) is reasonable based on typical stale-listing flexibility.
- Current owner paid $249k; list at $1.40M implies a 462% gain — meaningful room to come down on a strong offer.
Risks & watch-outs
- Watch-outs: built in 1915 — expect roof / HVAC / electrical / plumbing capex.
- Climate carrying-cost: major wind risk, 50% chance of damaging wind over 30y; extreme-heat days projected 7→15/yr by 2055 (HVAC capex compounding) — expect insurance premiums to compound above CPI over the hold.
Questions for the listing agent
- Built in 1915 — when were the roof, HVAC, electrical panel, plumbing, and water heater last replaced?
- Is there a deadline driving the sale (1031 exchange, divorce, estate, relocation)? That informs how much negotiation room exists.
- Schools are B-rated — typically a magnet for longer-tenancy family renters. What's the average tenant stay here, and is there a school-zone premium baked into asking?
- Crime grade is F in this area — have there been break-ins, vandalism, or insurance claims at this property in the last 3 years? What carrier currently insures it and at what premium?
- The area grade is low — what's the realistic commute time and amenity access for the typical tenant pool here? Any planned neighborhood developments (good or bad) we should know about?
- What's the average days-on-market for RENTAL listings here right now (not sales)? A rising rental-DOM trend means longer vacancies and softer asking-rent achievability than the comps imply.
- What's the recent tenant-quality profile in this submarket — average credit score on applications, eviction rate, late-payment / NSF rate, and stable-employment percentage? A property-management company in the area should have these aggregated.
- How much new apartment / multifamily construction is in the pipeline within 1–3 miles? Heavy new supply (>2% of stock underway) typically softens rents 12–24 months out; light construction supports rent growth.
Investment metrics
- 1% rule
- 0.81% ✗
- Cap rate
- 6.44%
- Cash-on-cash
- 0.53%
- DSCR
- 1.02
- GRM
- 10.3
CMA / ARV
- ARV (on-the-fly)
- $1,251,264
- Comps found
- 2
Show comp detail 2 sales within ~0.75 mi
| Address | Dist | Beds/Ba | Sqft | Sold | Price | $/sf | Match |
|---|---|---|---|---|---|---|---|
| 150-67 87 Ave | 0.20mi | 6/2.0 (+1) | 3,000 (-6%) | 2mo | $1,175,000 | $392 | 62 |
| 13409 89th Ave | 0.70mi | 5/3.0 | 2,717 (-15%) | 15mo | $865,300 | $318 | 22 |
Match score weights: distance 35% · size 25% · config 20% · recency 20%. Top-matched comps best support the ARV.
Projected returns pro-forma
-3.0% appreciation · 1.97% rent growth · sell at horizon
- IRR
- -16.5%
- Equity multiple
- 0.42×
- Total profit
- $-227,838
- Equity at exit
- $208,744
- IRR
- -10.2%
- Equity multiple
- 0.41×
- Total profit
- $-232,519
- Equity at exit
- $121,046
Cash invested: $392,000 (down + closing). Projections, not guarantees.
Landlord ↔ Tenant lean methodology
- Overall (CITY)
- 0 Strongly Tenant-Friendly
- State New York
- 15 Strongly Tenant-Friendly · D+10
- County
- — inherits STATE
- City New York
- 0 Strongly Tenant-Friendly · D+34
ZIP-level market 11435
- Rents YoY
- 2.0%
- Active inventory
- 171
- Price-to-rent
- 30.8×
Monthly cashflow live
- Estimated rent
- $11,370 medium interval (Pro) →
- Mortgage (P&I)
- −$7,342
- Tax from tax record
- −$884 /mo · $10,605/yr
- Insurance
- −$583
- HOA
- −$0
- Vacancy / Maint / Mgmt
- −$2,388
- Net cashflow
- $173
Break-even live
Sensitivity live
| Price | -10% $966 | -5% $570 | +0% $173 | +5% $-223 | +10% $-619 |
|---|---|---|---|---|---|
| Rent | -10% $-725 | -5% $-276 | +0% $173 | +5% $623 | +10% $1,072 |
| Rate | -1.0pp $878 | -0.5pp $530 | base $173 | +0.5pp $-189 | +1.0pp $-558 |
3-unit breakdown (identical units grouped — click to expand)
| Units | Beds | Baths | Est. rent |
|---|---|---|---|
| 3× units | 5 | 5 | $11,370 |
| #1 | 5 | 5 | $3,790 |
| #2 | 5 | 5 | $3,790 |
| #3 | 5 | 5 | $3,790 |
| Total (3 units) | $11,370 | ||
UW: 25.0% down · 7.5% · 30yr · 1.5% tax · 5.0% vac · 8.0% maint · 8.0% mgmt
Financing live
Cash to close
- Down payment
- $350,000
- Closing costs
- $42,000
- Reserves months
- —
- Total cash needed
- —
Loan-product check · same deal, 3 products live
Conventional
25% down · 7.5% · 30yr
- Down + closing
- —
- Monthly P&I
- —
- Monthly cashflow
- —
- DSCR
- —
- Eligible?
- —
Personal DTI + credit; lowest rate.
DSCR
20% down · 8.5% · 30yr
- Down + closing
- —
- Monthly P&I
- —
- Monthly cashflow
- —
- DSCR
- —
- Eligible?
- —
No personal income docs; deal must DSCR.
Hard money
10% down · 12.0% · 12mo
- Down + closing
- —
- Monthly P&I
- —
- Monthly cashflow
- —
- DSCR
- —
- Eligible?
- —
Short-term bridge; refi at stabilization.
Listing history 12 events
-
2026-06-21days on market $1,399,999 Active 19 DOM
-
2026-06-18days on market $1,399,999 Active 16 DOM
-
2026-06-17days on market $1,399,999 Active 15 DOM
-
2026-06-16days on market $1,399,999 Active 14 DOM
-
2026-06-15days on market $1,399,999 Active 13 DOM
-
2026-06-13days on market $1,399,999 Active 11 DOM
-
2026-06-09days on market $1,399,999 Active 7 DOM
-
2026-06-08days on market $1,399,999 Active 6 DOM
-
2026-06-08days on market $1,399,999 Active 5 DOM
-
2026-06-04days on market $1,399,999 Active 2 DOM
-
2026-06-03remarks 699-char remark
-
2026-06-03$1,399,999 Active 1 DOM
ⓘ Source: listings_history table (triggers on properties + properties_extension) + one-shot
backfill from property_details.listing_events for pre-trigger history.
Tax reassessment forecast NY · Partial reset (capped growth)
- Current annual tax
- $10,605 · $884/mo
- Projected year-2 tax
- $17,133 · $1,428/mo
- Expected delta
- +$6,527/yr (+$544/mo · 61.5%)
ⓘ Screening estimate from a state-policy table — verify with the county assessor before closing.
Climate risk First Street
- Flood 1/10 Low FEMA zone X (unshaded) · 0% chance over 30 yrs
- Wildfire 1/10 Low
- Heat 6/10 Major 7 d/yr ≥99°F today · 15 d/yr by 30 yrs out
- Wind 6/10 Major 50% chance of damaging wind over 30 yrs
- Air quality 4/10 Moderate 6 unhealthy d/yr today · 6 by 30 yrs out
Nearby sold comps map
Loading sold comps map…
Walkable amenities ~0.75 mi
Loading nearby amenities…
Taxation est. · year 1
- Rental income
- $136,440
- − Mortgage interest
- −$78,422
- − Property taxes
- −$10,605
- − Insurance
- −$7,000
- − Repairs & maintenance
- −$10,915
- − Management
- −$10,915
- − Depreciation
- −$40,727
- Taxable loss
- −$22,145
- Est. tax savings @ 24.0%
- +$5,315
- After-tax cash flow
- $7,396/yr
For passive investors: Depreciation is non-cash, so a rental often shows a tax loss while cash-flowing — sheltering income. Rental losses are passive: they offset passive income freely, and up to $25,000/yr can offset ordinary (W-2) income if you actively participate and your MAGI is under $100k (phasing out to $0 by $150k); unused losses carry forward. On sale, claimed depreciation is recaptured at up to 25%, and gains may owe capital-gains tax (a 1031 exchange can defer both). Figures are a year-1 estimate at your 24.0% rate — not tax advice; consult a CPA.
Schools (NCES district)
No district data.
Livability — New York
- Score
- 75/100
- State rank
- #268
- US rank
- #4188
Category grades
Schools grade is shown separately in the Schools card above.
Census & demographics
- Census place
- New York, NY
- County
- Queens County · 1,914,869 people
- City population
- 7,731,280
- Metro
- New York-Newark-Jersey City, NY-NJ-PA
- Population (ZIP)
- 56,826
- Household income
- $79,710
- Rent vs Own
- Severe rent burden
- 3361.0
Population outlook (Queens County) Hauer SSP2
- Today (2025)
- 2,546,320 people
- By 2030
- 2,643,059 · +3.8%
- By 2040
- 2,815,563 · +10.6%
- By 2050
- 2,944,423 · +15.6%
- By 2075
- 3,123,338 · +22.7%
- By 2100
- 3,098,688 · +21.7%
Race, ethnicity, and origin ACS 2023
- Neighborhood character
- Highly diverse neighborhood (Simpson 0.78)
- Race & ethnicity
- Hispanic / Latino 30% Black 25% Asian 23% White 13% Two or more races 7%
- Hispanic origin (detail)
- Mexican 3% Puerto Rican 4% Dominican 5%
- Common ancestry
- Scotch-Irish 2% Hispanic 1% Russian 1%
- Foreign-born
- 53% · Canada, China, Jamaica
- Languages at home
- 42% English-only · Spanish 29% Other Indo-European 14% Russian/Polish/Slavic 4%
Political lean MEDSL · Queens
- 2024 margin
- Strong D (+24.6) · D 62.3% · R 37.7%
- 2008→2024 swing
- -26.2pp toward R · 2008: 50.8pp · 2024: 24.6pp
- All cycles
- 2024: D+24.6 2020: D+45.2 2016: D+53.4 2012: D+58.5 2008: D+50.8
Not yet ingested
- Civics
- —
Market trends
- HPI YoY
- ▼ -399.00%
- Current HPI
- 206.3955
- Rent YoY
- ▲ 1.97%
- Metro
- New York-Newark-Jersey City, NY-NJ-PA
- State GDP YoY
- ▲ 2.60%
- F500 in state
- 92
Industry mix (Fortune 500 HQ in NY)
| Industry | F500 HQs | Revenue |
|---|---|---|
| Financial Services | 10 | $950B |
|
||
| Consumer Goods | 9 | $162B |
|
||
| Insurance | 4 | $225B |
|
||
| Telecommunications | 2 | $144B |
|
||
| Pharmaceuticals | 2 | $112B |
|
||
| Media / Entertainment | 2 | $69B |
|
||
Price history
+636.8% since first listed3 events — show timeline
- 2026-06-02 Listed $1,399,999 OneKey® MLS as Distributed by MLS Grid
- 1996-09-06 Sold (Public Records) $249,000 Public Records
- 1985-10-09 Sold (Public Records) $190,000 Public Records
Property tax history
+5.6%/yrLatest (2025): $10,605 · -0.9% YoY. Source: county tax records.
Cash-flow waterfall
monthlySold comps — $/sqft
last 12 mo · ≤1 miLoading sold comps…