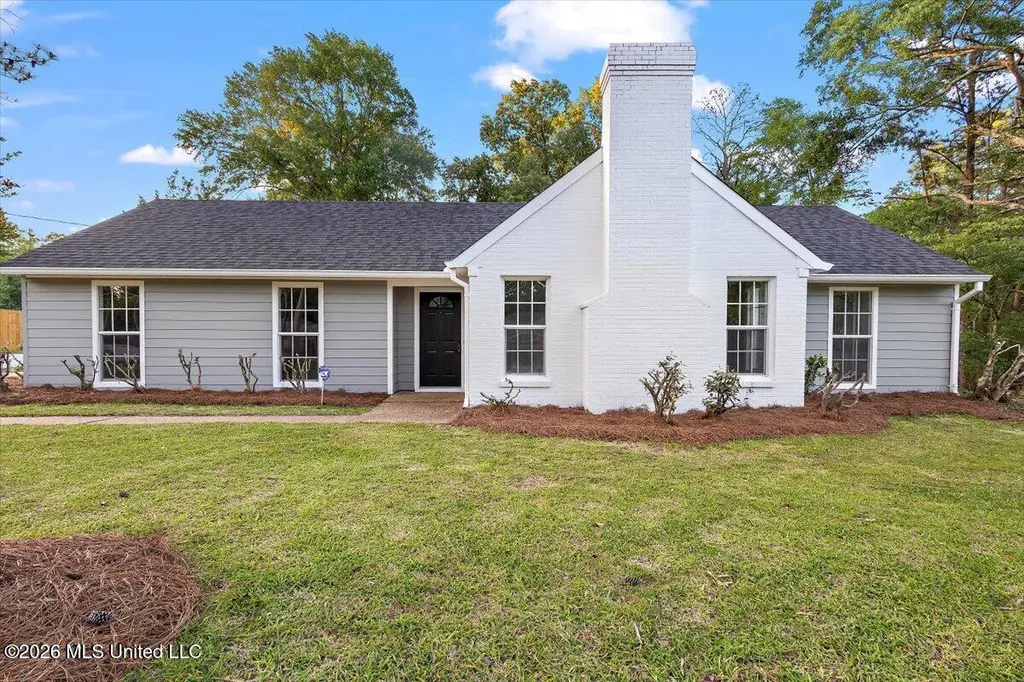
24 Village Dr · Madison, MS
Flood risk 1/10 · Minimal
- FEMA flood zone
- X (unshaded)
- Chance of flooding over 30 yrs
- 0.0%
- Est. flood insurance / yr
- $507 – $1,088
Fire risk 1/10 · Minimal
- Est. fire insurance / yr
- $1,241 – $2,305
Heat risk 7/10 · Major
- Hot days now (above 108°F)
- 7 days/yr
- Hot days in 30 yrs
- 20 days/yr
Wind risk 8/10 · Major
- Chance of severe wind over 30 yrs
- 80.0%
Air-quality risk 2/10 · Minimal
- Unhealthy air days now
- 0 days/yr
- Unhealthy air days in 30 yrs
- 1 days/yr
Risk factors via First Street. Map © Google.
Why this score? — see what drove the D+ grade
The composite is a weighted blend of 9 inputs, each scored 0–100. Each bar is that input's sub-score; the figure is the points it added to the 100-point composite (weight × sub-score).
- ARV discount +13.9/15.0
- Cash flow +13.0/30.0
- Schools +4.8/10.0
- Livability +4.0/5.0
- DSCR +3.9/10.0
- Rent growth +3.2/5.0
- 1% rule +2.7/10.0
- Condition / age +2.5/5.0
- Appreciation +0.0/10.0
$375,000
🖨 Deal sheet 📄 Offer letter ✓ Due diligence
Listing remarks
This beautifully updated home is perfect for the person who loves the outside as it comes with a big pool that has a slide and diving board. So much backyard and outdoor sitting area. This home has 4 beds and 2 baths. When you enter into the house you enter in the foyer that has 3 bedrooms and a bath to the left and to the right is the family room that's beside the living room. On the other side of the family room is the primary bedroom with two walk in closets and lots of natural sunlight. The primary bathroom has dual vanities. The kitchen is behind the family room with a kitchenette area behind it and a dining room beside it. The laundry room is on the other side of the kitchen close to
Key facts
- New floors
- Dual vanities
- Outdoor sitting area
Tags
Property features AI
Exterior
- Parking: 2-car garage (garage faces side)
- Utilities: Public sewer; Public water; Cable available; Electricity connected; Natural gas connected
- Home design: Single-family house; One level; Updated / Remodeled
- Construction: Brick and siding exterior; Architectural shingle roof; Slab foundation; Built (year from public records)
- Exterior features: Private yard; Deck; Rain gutters; Back yard fencing; Shed(s) / additional storage; In-ground saltwater private pool
Interior
- Kitchen: Disposal; Double oven; ENERGY STAR qualified dishwasher; Gas cooktop; Granite countertops
- Bedrooms: His and hers closets; Walk-in closet(s)
- Flooring: Luxury vinyl
- Bathrooms: 2 full bathrooms
- Heating & cooling: Natural gas heating; Electric cooling
- Interior features: Ceiling fans; Crown molding; Double vanity(s); Granite countertops; His and hers closets; Walk-in closet(s); ENERGY STAR qualified windows; Has fireplace (dining room)
- Laundry & utility: Dedicated laundry room
Neighborhood map
What this means for you Summary
Snapshot
- This is a 4-bed/4.0-bath single-family listed at $375k.
Deal economics
- At list price, monthly cash flow is $-20 ($-234/yr) — negative.
- To cash-flow at today's rent, offer at most $372k (0.9% below list).
- To meet the 1% rule (rent ≥ 1% of price), the offer needs to be $288k (23.2% below list).
- Recommended offer: $288k (23.2% below list) — sets the bar for 1% rule.
- Cap rate 6.2% vs local median 3.7% in Madison — top-decile yield for the area; either an underpriced asset or a hidden risk that comps aren't pricing in. Stress-test before assuming the spread holds.
Location & tenants
- Location reads 81/100 on livability (#4 in MS, #1,556 nationally) — a professional / high-income tenant draw. Strengths: crime A+, employment A+, housing A+; Watch: amenities D-, commute F.
- Madison County School District (rural): math 54% / reading 54% proficiency, ranked #3 of 130 in MS (top 2%) — acceptable for families but not a draw, mixed tenant base, ~2y average lease.
- Zoned schools: Madison Avenue Lower Elementary (437 students, 99% FRL); Madison Middle School (math 66% / reading 57%, grade B+, #6 of 179 statewide, top 3%, 1,154 students, 100% FRL); Madison Central High School (math 5% / reading 63%, grade F, #78 of 197 statewide, top 39%, 1,246 students, 100% FRL) — zoned schools average 100% FRL vs 29% district-wide (70 pts higher); higher-poverty schools than district average — tighter screening recommended.
- Market conditions: Rents rising (+2.6%/yr); 628 active listings in the ZIP; 1 comparable units currently listed for rent nearby; high-income renter base; 553 units permitted in Madison County in 2024 (0 in 5+ unit buildings).
Forward outlook
- Local home prices are declining (-3.0%/yr); year-one equity from $3k of loan paydown is wiped out by about $11k of value loss. Plan a longer hold.
- Madison County population projected at +34% by 2050 — long-run rental-demand tailwind backs the buy-and-hold thesis.
Negotiation context
- It's been on market 21 days — a 2% lower offer ($369k) is reasonable based on typical stale-listing flexibility.
- 8 sale attempts since 27y ago with the ask held roughly flat each time — persistent listings suggest the price (not the market) is what's stuck; bring a comps-based counter.
Risks & watch-outs
- Climate carrying-cost: severe wind risk, 80% chance of damaging wind over 30y; extreme-heat days projected 7→20/yr by 2055 (HVAC capex compounding) — expect insurance premiums to compound above CPI over the hold.
Questions for the listing agent
- What do current leases actually rent for vs. the listed asking? Can we see a recent rent roll and the last 12 months of T-12 income?
- Is there a deadline driving the sale (1031 exchange, divorce, estate, relocation)? That informs how much negotiation room exists.
- Schools are A-rated — typically a magnet for longer-tenancy family renters. What's the average tenant stay here, and is there a school-zone premium baked into asking?
- The area grade is low — what's the realistic commute time and amenity access for the typical tenant pool here? Any planned neighborhood developments (good or bad) we should know about?
- What's the average days-on-market for RENTAL listings here right now (not sales)? A rising rental-DOM trend means longer vacancies and softer asking-rent achievability than the comps imply.
- What's the recent tenant-quality profile in this submarket — average credit score on applications, eviction rate, late-payment / NSF rate, and stable-employment percentage? A property-management company in the area should have these aggregated.
- How much new for-sale + rental construction is in the pipeline within 1–3 miles? Heavy new supply typically softens prices + rents 12–24 months out; constrained supply supports both.
Investment metrics
- 1% rule
- 0.77% ✗
- Cap rate
- 6.23%
- Cash-on-cash
- -0.22%
- DSCR
- 0.99
- GRM
- 10.8
CMA / ARV
- ARV (median comp)
- $436,864
- List price
- $375,000
- Delta
- -14.16%
- Verdict
- UNDERPRICED
- Comps
- 20 within 1.0 mi
Show comp detail 9 sales within ~0.75 mi
| Address | Dist | Beds/Ba | Sqft | Sold | Price | $/sf | Match |
|---|---|---|---|---|---|---|---|
| 489 Cheyenne Ln | 0.40mi | 4/2.0 | 2,023 (-0%) | 3mo | $299,900 | $148 | 70 |
| 120 Cedar Pine Ln | 0.46mi | 3/2.0 (-1) | 1,853 (-9%) | 3mo | $330,000 | $178 | 48 |
| 332 Kiowa Dr | 0.44mi | 4/2.0 | 2,314 (+14%) | 7mo | $279,900 | $121 | 42 |
| 485 Cheyenne Ln | 0.43mi | 3/2.0 (-1) | 2,186 (+8%) | 23mo | $325,000 | $149 | 35 |
| 146 Sumac Dr | 0.57mi | 3/2.0 (-1) | 1,808 (-11%) | 13mo | $325,000 | $180 | 31 |
| 26 Redbud Ln | 0.56mi | 4/2.0 | 2,288 (+13%) | 21mo | $349,900 | $153 | 27 |
| 127 Sumac Dr | 0.49mi | 3/2.0 (-1) | 1,802 (-11%) | 22mo | $288,000 | $160 | 26 |
| 45 Redbud Ln | 0.57mi | 3/2.5 (-1) | 2,331 (+15%) | 19mo | $310,000 | $133 | 22 |
| 107 Elm St | 0.71mi | 3/2.0 (-1) | 1,758 (-13%) | 17mo | $295,000 | $168 | 17 |
Match score weights: distance 35% · size 25% · config 20% · recency 20%. Top-matched comps best support the ARV.
Projected returns pro-forma
-3.0% appreciation · 2.61% rent growth · sell at horizon
- IRR
- -17.1%
- Equity multiple
- 0.40×
- Total profit
- $-63,274
- Equity at exit
- $55,914
- IRR
- -9.8%
- Equity multiple
- 0.41×
- Total profit
- $-61,845
- Equity at exit
- $32,423
Cash invested: $105,000 (down + closing). Projections, not guarantees.
Landlord ↔ Tenant lean methodology
- Overall (STATE)
- 90 Strongly Landlord-Friendly
- State Mississippi
- 90 Strongly Landlord-Friendly · R+11
- County
- — inherits STATE
- City
- — inherits STATE
ZIP-level market 39110
- Home prices YoY
- -28.3%
- Rents YoY
- 2.6%
- Active inventory
- 628
- Price-to-rent
- 10.8×
Monthly cashflow live
- Estimated rent
- $2,881 medium interval (Pro) →
- Mortgage (P&I)
- −$1,967
- Tax from tax record
- −$172 /mo · $2,068/yr
- Insurance
- −$156
- HOA
- −$0
- Vacancy / Maint / Mgmt
- −$605
- Net cashflow
- $-20
Break-even live
UW: 25.0% down · 7.5% · 30yr · 1.5% tax · 5.0% vac · 8.0% maint · 8.0% mgmt
Financing live
Cash to close
- Down payment
- $93,750
- Closing costs
- $11,250
- Reserves months
- —
- Total cash needed
- —
Loan-product check · same deal, 3 products live
Conventional
25% down · 7.5% · 30yr
- Down + closing
- —
- Monthly P&I
- —
- Monthly cashflow
- —
- DSCR
- —
- Eligible?
- —
Personal DTI + credit; lowest rate.
DSCR
20% down · 8.5% · 30yr
- Down + closing
- —
- Monthly P&I
- —
- Monthly cashflow
- —
- DSCR
- —
- Eligible?
- —
No personal income docs; deal must DSCR.
Hard money
10% down · 12.0% · 12mo
- Down + closing
- —
- Monthly P&I
- —
- Monthly cashflow
- —
- DSCR
- —
- Eligible?
- —
Short-term bridge; refi at stabilization.
Rent comps 1 comps
| Address | Beds | Baths | Sqft | Rent | $/sqft | DOM | Units | Dist |
|---|---|---|---|---|---|---|---|---|
| 143 Sonnett Cir Madison, MS | 4.0 | 3.0 | 2564 | $3,250 | $1.27 | 23d | 1 | 1.16mi |
Listing history 21 events
-
2026-05-15status Pending 954-char remark
-
2026-04-24$375,000 Active 954-char remark
-
2021-10-08historical
-
2021-10-04historical
-
2017-11-15soldstatus
-
2017-11-15soldstatus
-
2017-05-27$240,000
-
2014-10-02soldstatus
-
2014-09-30soldstatus
-
2014-03-17$208,000
-
2012-11-09soldstatus
-
2012-11-02soldstatus
-
2012-02-05$185,000
-
2011-07-24$205,000
-
2011-07-22historical
-
2011-05-04$229,000
-
2003-10-31soldstatus
-
2003-09-04soldstatus
-
2003-09-03soldstatus
-
2003-07-30$178,000
-
1999-06-11$179,500
ⓘ Source: listings_history table (triggers on properties + properties_extension) + one-shot
backfill from property_details.listing_events for pre-trigger history.
Tax reassessment forecast MS · Resets to sale price
- Current annual tax
- $2,068 · $172/mo
- Projected year-2 tax
- $2,963 · $247/mo
- Expected delta
- +$894/yr (+$75/mo · 43.2%)
ⓘ Screening estimate from a state-policy table — verify with the county assessor before closing.
Climate risk First Street
- Flood 1/10 Low FEMA zone X (unshaded) · 0% chance over 30 yrs
- Wildfire 1/10 Low
- Heat 7/10 Severe 7 d/yr ≥108°F today · 20 d/yr by 30 yrs out
- Wind 8/10 Severe 80% chance of damaging wind over 30 yrs
- Air quality 2/10 Low 0 unhealthy d/yr today · 1 by 30 yrs out
Nearby sold comps map
Loading sold comps map…
Walkable amenities ~0.75 mi
Loading nearby amenities…
Taxation est. · year 1
- Rental income
- $34,567
- − Mortgage interest
- −$21,006
- − Property taxes
- −$2,068
- − Insurance
- −$1,875
- − Repairs & maintenance
- −$2,765
- − Management
- −$2,765
- − Depreciation
- −$10,909
- Taxable loss
- −$6,822
- Est. tax savings @ 24.0%
- +$1,637
- After-tax cash flow
- $1,403/yr
For passive investors: Depreciation is non-cash, so a rental often shows a tax loss while cash-flowing — sheltering income. Rental losses are passive: they offset passive income freely, and up to $25,000/yr can offset ordinary (W-2) income if you actively participate and your MAGI is under $100k (phasing out to $0 by $150k); unused losses carry forward. On sale, claimed depreciation is recaptured at up to 25%, and gains may owe capital-gains tax (a 1031 exchange can defer both). Figures are a year-1 estimate at your 24.0% rate — not tax advice; consult a CPA.
Schools (NCES district)
- District
- Madison County School District
- NCES district ID
- 2802790
- Math proficiency
- 54% ▼ -7.00%
- Reading proficiency
- 54% ▼ -7.00%
- Median HH income
- $70,579
- Composite
- 48.08/100
- National rank
- #2188
- State rank
- #3 of 130 in MS
Livability — Madison
- Score
- 81/100
- State rank
- #4
- US rank
- #1556
Category grades
Schools grade is shown separately in the Schools card above.
Census & demographics
- Census place
- Madison, MS
- County
- Madison County · 75,005 people
- City population
- 50,443
- Metro
- Jackson, MS
- Population (ZIP)
- 50,443
- Household income
- $125,506
- Rent vs Own
- Severe rent burden
- 227.0
Population outlook (Madison County) Hauer SSP2
- Today (2025)
- 122,509 people
- By 2030
- 131,737 · +7.5%
- By 2040
- 148,930 · +21.6%
- By 2050
- 164,300 · +34.1%
- By 2075
- 197,495 · +61.2%
- By 2100
- 211,429 · +72.6%
Race, ethnicity, and origin ACS 2023
- Neighborhood character
- Predominantly White (76%)
- Race & ethnicity
- White 76% Black 15% Asian 4% Two or more races 3% Hispanic / Latino 2%
- Common ancestry
- Italian 6% Slovak 3% Lithuanian 3%
- Foreign-born
- 5% · China, Canada
- Languages at home
- 92% English-only · Spanish 2% Other Indo-European 2% Chinese 1%
Political lean MEDSL · Madison
- 2024 margin
- R (+17.3) · D 40.8% · R 58.0% · Other 1.2%
- 2008→2024 swing
- -1.7pp toward R · 2008: -15.6pp · 2024: -17.3pp
- All cycles
- 2024: R+17.3 2020: R+11.8 2016: R+16.1 2012: R+15.7 2008: R+15.6
Not yet ingested
- Civics
- —
Market trends
- HPI YoY
- ▼ -60.99%
- Current HPI
- 154.6909
- Rent YoY
- ▲ 2.61%
- Metro
- Jackson, MS
- State GDP YoY
- —
- F500 in state
- 0
Price history
+108.9% since first listed22 events — show timeline
- 2026-06-17 Sold (MLS) — MLSU
- 2026-05-15 Pending — MLSU
- 2026-04-24 Listed $375,000 MLSU
- 2021-10-08 Listing Removed — MLSU
- 2021-10-04 Listing Removed — MLSU
- 2017-11-15 Sold (Public Records) — Public Records
- 2017-11-15 Sold (MLS) — MLSU
- 2017-05-27 Listed $240,000 MLSU
- 2014-10-02 Sold (Public Records) — Public Records
- 2014-09-30 Sold (MLS) — MLSU
- 2014-03-17 Listed $208,000 MLSU
- 2012-11-09 Sold (Public Records) — Public Records
- 2012-11-02 Sold (MLS) — MLSU
- 2012-02-05 Listed $185,000 MLSU
- 2011-07-24 Listed $205,000 MLSU
- 2011-07-22 Listing Removed — MLSU
- 2011-05-04 Listed $229,000 MLSU
- 2003-10-31 Sold (Public Records) — Public Records
- 2003-09-04 Sold (Public Records) — Public Records
- 2003-09-03 Sold (MLS) — MLSU
- 2003-07-30 Listed $178,000 MLSU
- 1999-06-11 Listed $179,500 MLSU
Property tax history
-0.1%/yrLatest (2025): $2,068 · +0.5% YoY. Source: county tax records.
Cash-flow waterfall
monthlySold comps — $/sqft
last 12 mo · ≤1 miLoading sold comps…