3702 S State Ave · Indianapolis city (balance), IN
Flood risk 1/10 · Minimal
- FEMA flood zone
- X (unshaded)
- Chance of flooding over 30 yrs
- 0.0%
- Est. flood insurance / yr
- $507 – $1,088
Fire risk 1/10 · Minimal
- Est. fire insurance / yr
- $717 – $1,331
Heat risk 3/10 · Minor
- Hot days now (above 101°F)
- 7 days/yr
- Hot days in 30 yrs
- 18 days/yr
Wind risk 2/10 · Minimal
- Chance of severe wind over 30 yrs
- 1.0%
Air-quality risk 3/10 · Minor
- Unhealthy air days now
- 2 days/yr
- Unhealthy air days in 30 yrs
- 3 days/yr
Risk factors via First Street. Map © Google.
Why this score? — see what drove the D+ grade
The composite is a weighted blend of 9 inputs, each scored 0–100. Each bar is that input's sub-score; the figure is the points it added to the 100-point composite (weight × sub-score).
- Cash flow +15.8/30.0
- ARV discount +15.0/15.0
- DSCR +4.9/10.0
- 1% rule +4.0/10.0
- Rent growth +3.1/5.0
- Livability +2.5/5.0
- Condition / age +2.5/5.0
- Schools +1.4/10.0
- Appreciation +0.0/10.0
$155,900
🖨 Deal sheet 📄 Offer letter ✓ Due diligence
Listing remarks MLS
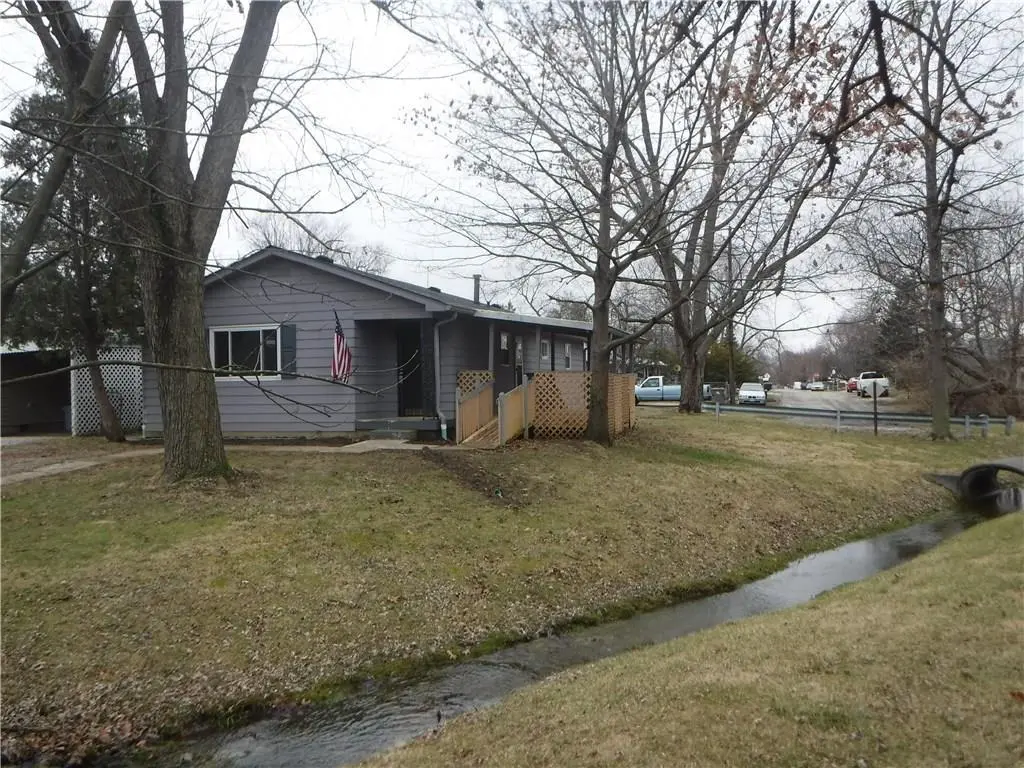
New remodel. New kitchen counters, new sink and plumbing, remodeled enlarged full bathroom, refinished hardwoods, new carpet, fresh interior paint, newer upgrade shingles, thermopane windows, additional insulation blown in attic, detached garage, large covered deck overlooking creek, 2 gravel driveways and additional parking off garrage, and shrubbery mulch to be installed once weather breaks.
Key facts
- Covered deck
- Glistening hardwoods
- Freshly painted
Tags
Property features AI
Exterior
- Parking: Detached garage (1 car) with service door; Guest street parking
- Utilities: Public water; Municipal sewer connected; Natural gas connected; Solid waste service available; Renewable fuel source
- Home design: Single-family residence; One level
- Construction: Aluminum siding; Block foundation
- Exterior features: Covered deck
Interior
- Kitchen: Gas oven; Range hood; Refrigerator
- Bedrooms: Three bedrooms on the main level (sizes include 9x12, 8x12, 12x13)
- Bathrooms: One full bathroom (main level)
- Heating & cooling: Forced air heating (natural gas); Central air conditioning
- Interior features: Attic access; Utility room
- Laundry & utility: Washer and dryer included; Main-level laundry; Gas water heater
Neighborhood map
What this means for you Summary
Snapshot
- This is a 3-bed/1.0-bath single-family listed at $156k.
Deal economics
- At list price, monthly cash flow is $72 ($865/yr) — positive.
- The deal already cash-flows at list — no discount required.
- To meet the 1% rule (rent ≥ 1% of price), the offer needs to be $140k (10.4% below list).
- Recommended offer: $140k (10.4% below list) — sets the bar for 1% rule.
- Cap rate 6.8% vs local median 4.4% in Indianapolis city (balance) — top-decile yield for the area; either an underpriced asset or a hidden risk that comps aren't pricing in. Stress-test before assuming the spread holds.
Location & tenants
- Location reads: area grade D — affects rentability + tenant quality, not the cash-flow math above.
- Indianapolis Public Schools (urban): math 14% / reading 20% proficiency, ranked #286 of 301 in IN (top 95%) — low school quality limits family demand, transient renter base, plan for 1-2y turnover; 77% free/reduced lunch — lower-income household profile, screen leases tightly.
- Market conditions: Rents rising (+2.5%/yr); 245 active listings in the ZIP; 32 comparable units currently listed for rent nearby; rentals at typical pace (median 18d on market — plan ~3-4 weeks tenant-placement turnaround); 1,906 units permitted in Marion County in 2024 (621 in 5+ unit buildings).
- This rent runs 31% of the median local income ($54k/yr) — at the standard rent-burdened threshold; future hikes will face affordability resistance.
Forward outlook
- Local home prices are declining (-3.0%/yr); year-one equity from $1k of loan paydown is wiped out by about $5k of value loss. Plan a longer hold.
- Marion County population projected at +18% by 2050 — long-run rental-demand tailwind backs the buy-and-hold thesis.
Negotiation context
- It's been on market 15 days — a 2% lower offer ($154k) is reasonable based on typical stale-listing flexibility.
- 7 sale attempts since 24y ago with the ask held roughly flat each time — persistent listings suggest the price (not the market) is what's stuck; bring a comps-based counter.
- Current owner paid $85k; list at $156k implies a 83% gain — meaningful room to come down on a strong offer.
Questions for the listing agent
- Built in 1971 — when were the roof, HVAC, electrical panel, plumbing, and water heater last replaced?
- Is there a deadline driving the sale (1031 exchange, divorce, estate, relocation)? That informs how much negotiation room exists.
- The area grade is low — what's the realistic commute time and amenity access for the typical tenant pool here? Any planned neighborhood developments (good or bad) we should know about?
- What's the average days-on-market for RENTAL listings here right now (not sales)? A rising rental-DOM trend means longer vacancies and softer asking-rent achievability than the comps imply.
- What's the recent tenant-quality profile in this submarket — average credit score on applications, eviction rate, late-payment / NSF rate, and stable-employment percentage? A property-management company in the area should have these aggregated.
- How much new for-sale + rental construction is in the pipeline within 1–3 miles? Heavy new supply typically softens prices + rents 12–24 months out; constrained supply supports both.
Investment metrics
- 1% rule
- 0.90% ✗
- Cap rate
- 6.85%
- Cash-on-cash
- 1.98%
- DSCR
- 1.09
- GRM
- 9.3
CMA / ARV
- ARV (on-the-fly)
- $190,800
- Comps found
- 12
Show comp detail 12 sales within ~0.75 mi
| Address | Dist | Beds/Ba | Sqft | Sold | Price | $/sf | Match |
|---|---|---|---|---|---|---|---|
| 3226 Keystone Lakes Way | 0.45mi | 3/2.0 | 1,250 (-2%) | 5mo | $240,000 | $192 | 68 |
| 3720 Aurora St | 0.32mi | 3/1.0 | 1,120 (-12%) | 0mo | $210,000 | $188 | 65 |
| 3863 S Asbury St S | 0.31mi | 3/1.0 | 1,104 (-13%) | 1mo | $179,000 | $162 | 63 |
| 1802 Martin St | 0.40mi | 3/1.0 | 1,407 (+11%) | 2mo | $136,000 | $97 | 62 |
| 1226 Bacon St | 0.55mi | 3/1.5 | 1,325 (+4%) | 6mo | $170,000 | $128 | 60 |
| 3029 Villa Ave | 0.51mi | 3/2.0 | 1,198 (-6%) | 4mo | $195,000 | $163 | 60 |
| 1902 Knox St | 0.55mi | 3/1.5 | 1,176 (-8%) | 2mo | $148,500 | $126 | 58 |
| 2916 Dietz St | 0.67mi | 3/1.0 | 1,200 (-6%) | 4mo | $160,000 | $133 | 57 |
| 1152 Knox St | 0.65mi | 2/1.0 (-1) | 1,200 (-6%) | 2mo | $197,000 | $164 | 54 |
| 2845 Tindall St | 0.75mi | 3/1.0 | 1,200 (-6%) | 3mo | $180,000 | $150 | 53 |
| 3321 S Tacoma Ave | 0.63mi | 2/1.0 (-1) | 1,188 (-7%) | 5mo | $85,000 | $72 | 51 |
| 2905 Dietz St | 0.70mi | 3/1.0 | 1,144 (-10%) | 4mo | $150,000 | $131 | 47 |
Match score weights: distance 35% · size 25% · config 20% · recency 20%. Top-matched comps best support the ARV.
Projected returns pro-forma
-3.0% appreciation · 2.46% rent growth · sell at horizon
- IRR
- -13.7%
- Equity multiple
- 0.51×
- Total profit
- $-21,431
- Equity at exit
- $23,245
- IRR
- -5.7%
- Equity multiple
- 0.64×
- Total profit
- $-15,840
- Equity at exit
- $13,479
Cash invested: $43,652 (down + closing). Projections, not guarantees.
Landlord ↔ Tenant lean methodology
- Overall (STATE)
- 90 Strongly Landlord-Friendly
- State Indiana
- 90 Strongly Landlord-Friendly · R+11
- County
- — inherits STATE
- City
- — inherits STATE
ZIP-level market 46227
- Rents YoY
- 2.5%
- Active inventory
- 245
- Price-to-rent
- 9.3×
Monthly cashflow live
- Estimated rent
- $1,397 high interval (Pro) →
- Mortgage (P&I)
- −$818
- Tax from tax record
- −$149 /mo · $1,791/yr
- Insurance
- −$65
- HOA
- −$0
- Vacancy / Maint / Mgmt
- −$293
- Net cashflow
- $72
Break-even live
UW: 25.0% down · 7.5% · 30yr · 1.5% tax · 5.0% vac · 8.0% maint · 8.0% mgmt
Financing live
Cash to close
- Down payment
- $38,975
- Closing costs
- $4,677
- Reserves months
- —
- Total cash needed
- —
Loan-product check · same deal, 3 products live
Conventional
25% down · 7.5% · 30yr
- Down + closing
- —
- Monthly P&I
- —
- Monthly cashflow
- —
- DSCR
- —
- Eligible?
- —
Personal DTI + credit; lowest rate.
DSCR
20% down · 8.5% · 30yr
- Down + closing
- —
- Monthly P&I
- —
- Monthly cashflow
- —
- DSCR
- —
- Eligible?
- —
No personal income docs; deal must DSCR.
Hard money
10% down · 12.0% · 12mo
- Down + closing
- —
- Monthly P&I
- —
- Monthly cashflow
- —
- DSCR
- —
- Eligible?
- —
Short-term bridge; refi at stabilization.
Rent comps 32 comps
| Address | Beds | Baths | Sqft | Rent | $/sqft | DOM | Units | Dist |
|---|---|---|---|---|---|---|---|---|
| 1620 Norton Ave Indianapolis, IN | 3.0 | 1.0 | 928 | $1,395 | $1.50 | 17d | 1 | 0.07mi |
| 3334 Laurel St Indianapolis, IN | 3.0 | 1.0 | 1068 | $1,200 | $1.12 | 20d | 1 | 0.33mi |
| 3311 Linden St Indianapolis, IN | 3.0 | 1.0 | 1056 | $1,150 | $1.09 | 43d | 1 | 0.39mi |
| 3319 Olive St Indianapolis, IN | 3.0 | 2.0 | 1588 | $1,450 | $0.91 | 23d | 1 | 0.41mi |
| 3312 Olive St Indianapolis, IN | 3.0 | 2.0 | 1000 | $1,395 | $1.40 | 23d | 1 | 0.44mi |
| 1621 Knox St Indianapolis, IN | 4.0 | 2.0 | 1411 | $930 | $0.66 | 4d | 1 | 0.48mi |
| 4109 Weaver Ave Indianapolis, IN | 4.0 | 2.0 | 1100 | $1,749 | $1.59 | 43d | 1 | 0.73mi |
| 2806 Dietz St Indianapolis, IN | 4.0 | 1.5 | 1200 | $1,345 | $1.12 | 23d | 1 | 0.80mi |
| 1051 E Edwards Ave Indianapolis, IN | 2.0 | 1.0 | 896 | $1,150 | $1.28 | 43d | 1 | 0.81mi |
| 3633 S Rural St Indianapolis, IN | 3.0 | 2.5 | 1440 | $1,700 | $1.18 | 23d | 1 | 0.83mi |
| 1144 McDougal St Indianapolis, IN | 3.0 | 1.0 | 876 | $1,500 | $1.71 | 21d | 1 | 0.87mi |
| 1549 Nelson Ave Indianapolis, IN | 3.0 | 1.0 | 950 | $1,380 | $1.45 | 43d | 1 | 0.92mi |
| 920 E Markwood Ave Indianapolis, IN | 1.0–2.0 | 1.0 | 838 | $949 | $1.13 | 7d | 2 | 0.93mi |
| 4032 S Rural St Indianapolis, IN | 4.0 | 2.0 | 1728 | $1,980 | $1.15 | 1d | 1 | 0.98mi |
| 2633 S Randolph St Unit b Indianapolis, IN | 2.0 | 1.0 | 900 | $995 | $1.11 | 23d | 1 | 1.03mi |
| 2633 S Randolph St Indianapolis, IN | 2.0 | 1.0 | 900 | $995 | $1.11 | 10d | 1 | 1.03mi |
| 4233 Carson Ln Indianapolis, IN | 4.0 | 3.0 | 1590 | $1,750 | $1.10 | 23d | 1 | 1.14mi |
| 2946 Carson Dr Indianapolis, IN | 3.0 | 3.0 | 1590 | $1,600 | $1.01 | 2d | 1 | 1.14mi |
| 4401 S Keystone Ave Indianapolis, IN | 2.0 | 1.5–2.0 | 1000 | $1,142 | $1.14 | 1d | 17 | 1.15mi |
| 2315 Bischoff Dr Beech Grove, IN | 2.0 | 1.0 | 1065 | $848 | $0.80 | 23d | 2 | 1.21mi |
| 4020 Hanna Village Dr Indianapolis, IN | 1.0–3.0 | 1.0–2.0 | 886 | $1,499 | $1.69 | 2d | 2 | 1.25mi |
| 2770 South East St Unit 302 Indianapolis, IN | 3.0 | 2.0 | 1158 | $1,015 | $0.88 | 2d | 1 | 1.25mi |
| 2770 S East St Apt 103 Indianapolis, IN | 3.0 | 2.0 | 1190 | $1,045 | $0.88 | 14d | 1 | 1.25mi |
| 2760 S East St Indianapolis, IN | 2.0–3.0 | 2.0 | 1072 | $1,045 | $0.97 | 3d | 3 | 1.27mi |
| 3216 Brill Rd Indianapolis, IN | 3.0 | 2.0 | 1628 | $1,646 | $1.01 | 23d | 1 | 1.28mi |
| 376 Ticen St Beech Grove, IN | 3.0 | 1.5 | 1524 | $1,746 | $1.15 | 4d | 1 | 1.28mi |
| 4100 Continental Ct Indianapolis, IN | 1.0–2.0 | 1.0–1.5 | 917 | $1,249 | $1.36 | 1d | 7 | 1.35mi |
| 1973 Newcomer Ln Beech Grove, IN | 4.0 | 1.0 | 1368 | $1,500 | $1.10 | 21d | 1 | 1.42mi |
| 4259 Burkhart Dr Unit 4264BE Indianapolis, IN | 2.0 | 1.0 | 887 | $1,149 | $1.30 | 4d | 1 | 1.43mi |
| 4259 Burkhart Dr Unit 4257C Indianapolis, IN | 2.0 | 1.0 | 949 | $999 | $1.05 | 7d | 1 | 1.43mi |
| 4259 Burkhart Dr Unit 4257B Indianapolis, IN | 2.0 | 1.0 | 887 | $999 | $1.13 | 17d | 1 | 1.43mi |
| 4259 Burkhart Dr Indianapolis, IN | 1.0–2.0 | 1.0 | 747 | $1,575 | $2.11 | 16d | 4 | 1.45mi |
Listing history 29 events
-
2026-06-18status $155,900 Pending 15 DOM
-
2026-06-18days on market $155,900 Active 15 DOM
-
2026-06-17days on market $155,900 Active 14 DOM
-
2026-06-16days on market $155,900 Active 13 DOM
-
2026-06-15days on market $155,900 Active 12 DOM
-
2026-06-13days on market $155,900 Active 10 DOM
-
2026-06-13pricedays on market $155,900 Active 9 DOM
-
2026-06-10price $164,900 Active 6 DOM
-
2026-06-09days on market $165,000 Active 6 DOM
-
2026-06-08days on market $165,000 Active 5 DOM
-
2026-06-07remarks 628-char remark
-
2026-06-07pricestatusdays on market $165,000 Active 4 DOM
-
2026-05-10status Pending
-
2026-05-08$155,900 Active
-
2018-04-12soldstatus $85,000 Sold 397-char remark
Show marketing remark (397 chars)
New remodel. New kitchen counters, new sink and plumbing, remodeled enlarged full bathroom, refinished hardwoods, new carpet, fresh interior paint, newer upgrade shingles, thermopane windows, additional insulation blown in attic, detached garage, large covered deck overlooking creek, 2 gravel driveways and additional parking off garrage, and shrubbery mulch to be installed once weather breaks.
-
2018-04-08status Pending 397-char remark
Show marketing remark (397 chars)
New remodel. New kitchen counters, new sink and plumbing, remodeled enlarged full bathroom, refinished hardwoods, new carpet, fresh interior paint, newer upgrade shingles, thermopane windows, additional insulation blown in attic, detached garage, large covered deck overlooking creek, 2 gravel driveways and additional parking off garrage, and shrubbery mulch to be installed once weather breaks.
-
2018-03-06historical Active with Contingency 397-char remark
Show marketing remark (397 chars)
New remodel. New kitchen counters, new sink and plumbing, remodeled enlarged full bathroom, refinished hardwoods, new carpet, fresh interior paint, newer upgrade shingles, thermopane windows, additional insulation blown in attic, detached garage, large covered deck overlooking creek, 2 gravel driveways and additional parking off garrage, and shrubbery mulch to be installed once weather breaks.
-
2018-02-24$85,000 Active 397-char remark
Show marketing remark (397 chars)
New remodel. New kitchen counters, new sink and plumbing, remodeled enlarged full bathroom, refinished hardwoods, new carpet, fresh interior paint, newer upgrade shingles, thermopane windows, additional insulation blown in attic, detached garage, large covered deck overlooking creek, 2 gravel driveways and additional parking off garrage, and shrubbery mulch to be installed once weather breaks.
-
2012-11-10historical
-
2012-05-09$69,900
-
2005-11-02historical
-
2005-06-02$73,900
-
2004-04-06soldstatus $70,000
-
2004-03-06$74,900
-
2003-05-23soldstatus $74,900
-
2003-03-21soldstatus $42,750
-
2003-03-21$74,900
-
2002-11-01$48,000
-
2000-08-04soldstatus $68,118
ⓘ Source: listings_history table (triggers on properties + properties_extension) + one-shot
backfill from property_details.listing_events for pre-trigger history.
Tax reassessment forecast IN · Partial reset (capped growth)
- Current annual tax
- $1,791 · $149/mo
- Projected year-2 tax
- $1,791 · $149/mo
- Expected delta
- $0/yr ($0/mo · 0.0%)
ⓘ Screening estimate from a state-policy table — verify with the county assessor before closing.
Climate risk First Street
- Flood 1/10 Low FEMA zone X (unshaded) · 0% chance over 30 yrs
- Wildfire 1/10 Low
- Heat 3/10 Moderate 7 d/yr ≥101°F today · 18 d/yr by 30 yrs out
- Wind 2/10 Low 100% chance of damaging wind over 30 yrs
- Air quality 3/10 Moderate 2 unhealthy d/yr today · 3 by 30 yrs out
Nearby sold comps map
Loading sold comps map…
Walkable amenities ~0.75 mi
Loading nearby amenities…
Taxation est. · year 1
- Rental income
- $16,767
- − Mortgage interest
- −$8,733
- − Property taxes
- −$1,791
- − Insurance
- −$780
- − Repairs & maintenance
- −$1,341
- − Management
- −$1,341
- − Depreciation
- −$4,535
- Taxable loss
- −$1,754
- Est. tax savings @ 24.0%
- +$421
- After-tax cash flow
- $1,286/yr
For passive investors: Depreciation is non-cash, so a rental often shows a tax loss while cash-flowing — sheltering income. Rental losses are passive: they offset passive income freely, and up to $25,000/yr can offset ordinary (W-2) income if you actively participate and your MAGI is under $100k (phasing out to $0 by $150k); unused losses carry forward. On sale, claimed depreciation is recaptured at up to 25%, and gains may owe capital-gains tax (a 1031 exchange can defer both). Figures are a year-1 estimate at your 24.0% rate — not tax advice; consult a CPA.
Schools (NCES district)
- District
- Indianapolis Public Schools
- NCES district ID
- 1804770
- Math proficiency
- 14% ▼ -7.00%
- Reading proficiency
- 20% ▼ -3.00%
- Median HH income
- $32,034
- Composite
- 13.69/100
- National rank
- #9499
- State rank
- #286 of 301 in IN
Livability — Indianapolis city (balance)
No livability data for this city. (Only ~50 U.S. cities are tracked.)
Census & demographics
- Census place
- Indianapolis city (balance), IN
- County
- Marion County · 998,460 people
- City population
- 881,119
- Metro
- Indianapolis-Carmel-Anderson, IN
- Population (ZIP)
- 57,587
- Household income
- $53,629
- Rent vs Own
- Severe rent burden
- 3583.0
Population outlook (Marion County) Hauer SSP2
- Today (2025)
- 1,025,572 people
- By 2030
- 1,065,727 · +3.9%
- By 2040
- 1,141,577 · +11.3%
- By 2050
- 1,208,920 · +17.9%
- By 2075
- 1,367,288 · +33.3%
- By 2100
- 1,438,201 · +40.2%
Race, ethnicity, and origin ACS 2023
- Neighborhood character
- Diverse neighborhood (Simpson 0.59)
- Race & ethnicity
- White 61% Asian 12% Black 11% Hispanic / Latino 10% Two or more races 8%
- Hispanic origin (detail)
- Mexican 8%
- Common ancestry
- Italian 2% Slovak 2% Lithuanian 1%
- Foreign-born
- 17% · Philippines, Canada, Vietnam
- Languages at home
- 79% English-only · Other Asian/Pacific 9% Spanish 7% Other Indo-European 1%
Political lean MEDSL · Marion
- 2024 margin
- Strong D (+27.7) · D 63.0% · R 35.3% · Other 1.7%
- 2008→2024 swing
- -0.7pp no change · 2008: 28.4pp · 2024: 27.7pp
- All cycles
- 2024: D+27.7 2020: D+29.1 2016: D+22.8 2012: D+22.2 2008: D+28.4
Not yet ingested
- Civics
- —
Market trends
- HPI YoY
- ▼ -260.49%
- Current HPI
- 276.8271
- Rent YoY
- ▲ 2.46%
- Metro
- Indianapolis-Carmel-Anderson, IN
- State GDP YoY
- ▲ 2.90%
- F500 in state
- 18
Industry mix (Fortune 500 HQ in IN)
| Industry | F500 HQs | Revenue |
|---|---|---|
| Industrial Machinery | 2 | $37B |
|
||
| Healthcare | 1 | $177B |
|
||
| Pharmaceuticals | 1 | $45B |
|
||
| Metals / Steel | 1 | $18B |
|
||
| Agriculture | 1 | $17B |
|
||
| Packaging | 1 | $12B |
|
||
Price history
+128.9% since first listed17 events — show timeline
- 2026-05-10 Pending — MIBOR as Distributed by MLS Grid
- 2026-05-08 Listed $155,900 MIBOR as Distributed by MLS Grid
- 2018-04-12 Sold (MLS) $85,000 MIBOR as Distributed by MLS Grid
- 2018-04-08 Pending — MIBOR as Distributed by MLS Grid
- 2018-03-06 Contingent — MIBOR as Distributed by MLS Grid
- 2018-02-24 Listed $85,000 MIBOR as Distributed by MLS Grid
- 2012-11-10 Listing Removed — MIBOR as Distributed by MLS Grid
- 2012-05-09 Listed $69,900 MIBOR as Distributed by MLS Grid
- 2005-11-02 Listing Removed — MIBOR as Distributed by MLS Grid
- 2005-06-02 Listed $73,900 MIBOR as Distributed by MLS Grid
- 2004-04-06 Sold (MLS) $70,000 MIBOR as Distributed by MLS Grid
- 2004-03-06 Listed $74,900 MIBOR as Distributed by MLS Grid
- 2003-05-23 Sold (MLS) $74,900 MIBOR as Distributed by MLS Grid
- 2003-03-21 Listed $74,900 MIBOR as Distributed by MLS Grid
- 2003-03-21 Sold (MLS) $42,750 MIBOR as Distributed by MLS Grid
- 2002-11-01 Listed $48,000 MIBOR as Distributed by MLS Grid
- 2000-08-04 Sold (Public Records) $68,118 Public Records
Property tax history
+5.2%/yrLatest (2025): $1,791 · +9.6% YoY. Source: county tax records.
Cash-flow waterfall
monthlySold comps — $/sqft
last 12 mo · ≤1 miLoading sold comps…