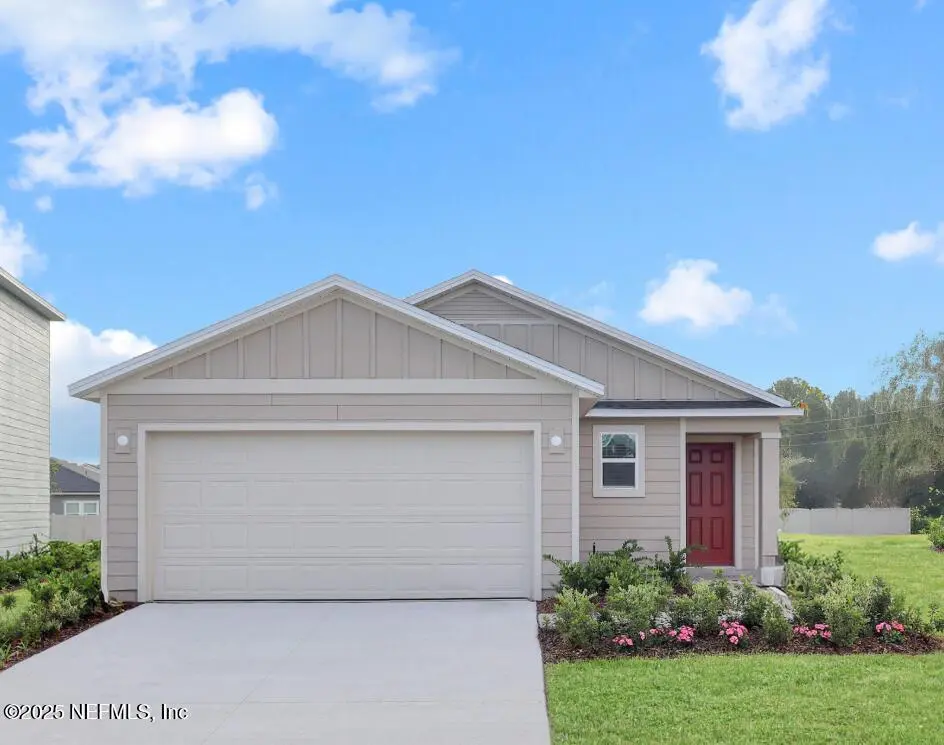
32 Bud Shire Ln · Palm Coast, FL
Flood risk 1/10 · Minimal
- FEMA flood zone
- X (unshaded)
- Chance of flooding over 30 yrs
- 0.0%
- Est. flood insurance / yr
- $507 – $1,088
Fire risk 4/10 · Minor
- Est. fire insurance / yr
- $947 – $1,759
Heat risk 9/10 · Severe
- Hot days now (above 106°F)
- 7 days/yr
- Hot days in 30 yrs
- 21 days/yr
Wind risk 10/10 · Severe
- Chance of severe wind over 30 yrs
- 99.0%
Air-quality risk 2/10 · Minimal
- Unhealthy air days now
- 2 days/yr
- Unhealthy air days in 30 yrs
- 2 days/yr
Risk factors via First Street. Map © Google.
Why this score? — see what drove the F grade
The composite is a weighted blend of 9 inputs, each scored 0–100. Each bar is that input's sub-score; the figure is the points it added to the 100-point composite (weight × sub-score).
- Cash flow +9.7/30.0
- ARV discount +7.5/15.0
- Schools +4.6/10.0
- Livability +3.5/5.0
- DSCR +2.7/10.0
- Rent growth +2.7/5.0
- Condition / age +2.5/5.0
- 1% rule +1.7/10.0
- Appreciation +0.0/10.0
$308,494
🖨 Deal sheet 📄 Offer letter ✓ Due diligence
Listing remarks
MOVE IN READY! The Belmont by Lennar Homes combines modern design with comfortable living in 3 bedrooms, 2 bathrooms and 1,428 sqft. The open layout creates a welcoming flow while the heart of the home boasts quartz countertops, stainless steel appliances, 36'' recess panel cabinets and a large island, perfect for entertaining. Luxury Vinyl plank flooring adds warmth and style throughout the main areas of the home. Outside, enjoy instant curb appeal with lush St Aug sod and full irrigation. Perfectly sized and thoughtfully finished, this home delivers the ideal blend of function, beauty and Palm Coast Lifestyle, offering a peaceful, resort-like way of life with miles of quiet beaches, go
Key facts
- Quartz countertops
- Full irrigation
- Large island
Tags
Property features AI
Exterior
- Parking: Attached garage with garage door opener; 2-car garage
- Security: Smoke detector(s)
- Utilities: Public sewer; Electricity connected; Water connected; Sewer connected; Windows listed for energy efficiency
- Home design: Single-family residence; One story
- Construction: Fiber cement and frame construction; Shingle roof
- Exterior features: Covered front porch; Porch; Sprinklers in front and rear; Asphalt road access; Smoke detector(s)
Interior
- Kitchen: Dishwasher; Disposal; Electric cooktop; Electric oven; Electric range; Microwave; Refrigerator; Ice maker
- Bedrooms: 3 bedrooms; Includes a second bedroom
- Flooring: Carpet; Tile
- Bathrooms: 2 full bathrooms
- Heating & cooling: Central heating; Electric heating; Heat pump; Central air (electric)
- Interior features: Breakfast nook; Entrance foyer; Kitchen island; Pantry; Primary bathroom with shower (no tub)
- Laundry & utility: Washer hookup; Electric dryer hookup; Electric water heater
Neighborhood map
What this means for you Summary
Snapshot
- This is a 3-bed/2.0-bath land listed at $308k.
Deal economics
- At list price, monthly cash flow is $-205 ($-2k/yr) — negative.
- To cash-flow at today's rent, offer at most $272k (11.7% below list).
- To meet the 1% rule (rent ≥ 1% of price), the offer needs to be $206k (33.3% below list).
- Recommended offer: $206k (33.3% below list) — sets the bar for 1% rule.
- Cap rate 5.5% vs local median 3.8% in Palm Coast — top-decile yield for the area; either an underpriced asset or a hidden risk that comps aren't pricing in. Stress-test before assuming the spread holds.
Location & tenants
- Location reads 69/100 on livability (#478 in FL) — a middle-class / working-renter tenant base. Strengths: housing A+, health & safety A+, cost of living B+; Watch: amenities F, commute F.
- Flagler (rural): math 53% / reading 56% proficiency, ranked #20 of 73 in FL (top 27%) — acceptable for families but not a draw, mixed tenant base, ~2y average lease.
- Market conditions: Rents flat; 1600 active listings in the ZIP; 26 comparable units currently listed for rent nearby; rentals at typical pace (median 15d on market — plan ~3-4 weeks tenant-placement turnaround); solid renter incomes; 2,588 units permitted in Flagler County in 2024 (0 in 5+ unit buildings).
Forward outlook
- Local home prices are declining (-3.0%/yr); year-one equity from $2k of loan paydown is wiped out by about $9k of value loss. Plan a longer hold.
- Flagler County population projected at +28% by 2050 — long-run rental-demand tailwind backs the buy-and-hold thesis.
Negotiation context
- It's been on market 65 days — a 6% lower offer ($290k) is reasonable based on typical stale-listing flexibility.
- Current owner paid $212k; 45% above their basis — modest negotiation headroom, anchor on the comps not their cost.
Risks & watch-outs
- Climate carrying-cost: severe wind risk, 99% chance of damaging wind over 30y; extreme-heat days projected 7→21/yr by 2055 (HVAC capex compounding) — expect insurance premiums to compound above CPI over the hold.
Questions for the listing agent
- What do current leases actually rent for vs. the listed asking? Can we see a recent rent roll and the last 12 months of T-12 income?
- It's been on market 65 days. Have you received any prior offers? Is the seller open to a 33% concession, seller financing, or rate buy-down credit?
- Why hasn't it sold? Are there any deal-killer items the seller is aware of (foundation, flood, title, zoning, code violations)?
- Is there a deadline driving the sale (1031 exchange, divorce, estate, relocation)? That informs how much negotiation room exists.
- The area grade is low — what's the realistic commute time and amenity access for the typical tenant pool here? Any planned neighborhood developments (good or bad) we should know about?
- What's the average days-on-market for RENTAL listings here right now (not sales)? A rising rental-DOM trend means longer vacancies and softer asking-rent achievability than the comps imply.
- What's the recent tenant-quality profile in this submarket — average credit score on applications, eviction rate, late-payment / NSF rate, and stable-employment percentage? A property-management company in the area should have these aggregated.
- How much new for-sale + rental construction is in the pipeline within 1–3 miles? Heavy new supply typically softens prices + rents 12–24 months out; constrained supply supports both.
Investment metrics
- 1% rule
- 0.67% ✗
- Cap rate
- 5.49%
- Cash-on-cash
- -2.85%
- DSCR
- 0.87
- GRM
- 12.5
CMA / ARV
No comps found within radius.
Projected returns pro-forma
-3.0% appreciation · 0.85% rent growth · sell at horizon
- IRR
- -23.2%
- Equity multiple
- 0.22×
- Total profit
- $-67,565
- Equity at exit
- $45,997
- IRR
- -23.6%
- Equity multiple
- -0.08×
- Total profit
- $-93,404
- Equity at exit
- $26,673
Cash invested: $86,378 (down + closing). Projections, not guarantees.
Landlord ↔ Tenant lean methodology
- Overall (STATE)
- 87 Strongly Landlord-Friendly
- State Florida
- 87 Strongly Landlord-Friendly · R+3
- County
- — inherits STATE
- City
- — inherits STATE
ZIP-level market 32137
- Home prices YoY
- -34.5%
- Rents YoY
- 0.8%
- Active inventory
- 1600
- Price-to-rent
- 12.5×
Monthly cashflow live
- Estimated rent
- $2,056 high interval (Pro) →
- Mortgage (P&I)
- −$1,618
- Tax from tax record
- −$83 /mo · $1,000/yr
- Insurance
- −$129
- HOA
- −$0
- Vacancy / Maint / Mgmt
- −$432
- Net cashflow
- $-205
Break-even live
UW: 25.0% down · 7.5% · 30yr · 1.5% tax · 5.0% vac · 8.0% maint · 8.0% mgmt
Financing live
Cash to close
- Down payment
- $77,124
- Closing costs
- $9,255
- Reserves months
- —
- Total cash needed
- —
Loan-product check · same deal, 3 products live
Conventional
25% down · 7.5% · 30yr
- Down + closing
- —
- Monthly P&I
- —
- Monthly cashflow
- —
- DSCR
- —
- Eligible?
- —
Personal DTI + credit; lowest rate.
DSCR
20% down · 8.5% · 30yr
- Down + closing
- —
- Monthly P&I
- —
- Monthly cashflow
- —
- DSCR
- —
- Eligible?
- —
No personal income docs; deal must DSCR.
Hard money
10% down · 12.0% · 12mo
- Down + closing
- —
- Monthly P&I
- —
- Monthly cashflow
- —
- DSCR
- —
- Eligible?
- —
Short-term bridge; refi at stabilization.
Rent comps 26 comps
| Address | Beds | Baths | Sqft | Rent | $/sqft | DOM | Units | Dist |
|---|---|---|---|---|---|---|---|---|
| 38 Bud Field Dr Palm Coast, FL | 3.0 | 2.0 | 1619 | $1,900 | $1.17 | 14d | 1 | 0.07mi |
| 12 Lytton Ln Palm Coast, FL | 3.0 | 2.0 | 1661 | $2,895 | $1.74 | 3d | 1 | 0.32mi |
| 73 Buttonworth Dr Unit B Palm Coast, FL | 3.0 | 2.0 | 1343 | $1,650 | $1.23 | 21d | 1 | 0.47mi |
| 9 Lyons Pl Palm Coast, FL | 3.0 | 2.0 | 1421 | $1,800 | $1.27 | 23d | 1 | 0.48mi |
| 25 Louisville Dr Unit A Palm Coast, FL | 3.0 | 2.0 | 1677 | $1,700 | $1.01 | 23d | 1 | 0.51mi |
| 84 Buttonworth Dr Palm Coast, FL | 3.0 | 2.0 | 1212 | $1,800 | $1.49 | 23d | 1 | 0.53mi |
| 55 Louisiana Dr Unit A Palm Coast, FL | 3.0 | 2.0 | 1311 | $1,950 | $1.49 | 11d | 1 | 0.53mi |
| 106 La Mancha Dr Palm Coast, FL | 4.0 | 2.0 | 1640 | $1,900 | $1.16 | 23d | 1 | 0.54mi |
| 11 Louvet Ln Unit A Palm Coast, FL | 3.0 | 2.0 | 1198 | $1,725 | $1.44 | 11d | 1 | 0.57mi |
| 92 Buttonworth Dr Palm Coast, FL | 2.0 | 2.0 | 977 | $1,425 | $1.46 | 3d | 1 | 0.59mi |
| 59 Laramie Dr Palm Coast, FL | 3.0 | 2.0 | 1270 | $1,700 | $1.34 | 14d | 1 | 0.62mi |
| 13 Buttonwood Ln Unit B Palm Coast, FL | 3.0 | 2.0 | 1294 | $1,650 | $1.28 | 23d | 1 | 0.62mi |
| 7 Lancaster Ln Palm Coast, FL | 4.0 | 2.0 | 1859 | $3,500 | $1.88 | 23d | 1 | 0.63mi |
| 14 Buttonwell Ln Palm Coast, FL | 3.0 | 2.0 | 1287 | $1,675 | $1.30 | 3d | 1 | 0.66mi |
| 19 Buttonwell Ln Palm Coast, FL | 3.0 | 2.0 | 1526 | $1,700 | $1.11 | 3d | 1 | 0.68mi |
| 165 Redbud Rd Palm Coast, FL | 3.0 | 2.5 | 1795 | $1,800 | $1.00 | 3d | 1 | 0.70mi |
| 307 Redbud Rd Palm Coast, FL | 3.0 | 2.5 | 1722 | $1,825 | $1.06 | 23d | 1 | 0.74mi |
| 199 Redbud Rd Palm Coast, FL | 3.0 | 2.5 | 1722 | $1,800 | $1.05 | 23d | 1 | 0.76mi |
| 10 Buttonworth Dr Palm Coast, FL | 3.0 | 2.0 | 1268 | $1,495 | $1.18 | 21d | 1 | 0.77mi |
| 85 Laramie Dr Palm Coast, FL | 3.0 | 2.0 | 1716 | $2,100 | $1.22 | 23d | 1 | 0.79mi |
| 38A Lindsay Dr Palm Coast, FL | 2.0 | 2.0 | 1167 | $1,675 | $1.44 | 3d | 1 | 0.96mi |
| 121 Lindsay Dr Palm Coast, FL | 3.0 | 2.0 | 1677 | $1,700 | $1.01 | 3d | 1 | 1.18mi |
| 34 Bunker Ln Palm Coast, FL | 4.0 | 2.0 | 1733 | $2,200 | $1.27 | 23d | 1 | 1.23mi |
| 14 Bunker View Dr Unit 2 Palm Coast, FL | 3.0 | 2.0 | 1190 | $1,645 | $1.38 | 3d | 1 | 1.27mi |
| 32 Bunker View Dr Unit A Palm Coast, FL | 2.0 | 2.0 | 1434 | $1,500 | $1.05 | 3d | 1 | 1.41mi |
| 12 Bunker View Pl Palm Coast, FL | 3.0 | 2.5 | 1600 | $1,725 | $1.08 | 3d | 1 | 1.46mi |
Listing history 18 events
-
2026-06-18days on market $308,494 Active 65 DOM
-
2026-06-17days on market $308,494 Active 64 DOM
-
2026-06-16pricedays on market $308,494 Active 63 DOM
-
2026-06-15days on market $304,494 Active 62 DOM
-
2026-06-14days on market $304,494 Active 60 DOM
-
2026-06-13days on market $304,494 Active 59 DOM
-
2026-06-10days on market $304,494 Active 57 DOM
-
2026-06-09days on market $304,494 Active 56 DOM
-
2026-06-08days on market $304,494 Active 55 DOM
-
2026-06-07days on market $304,494 Active 54 DOM
-
2026-06-03days on market $304,494 Active 50 DOM
-
2026-06-02days on market $304,494 Active 49 DOM
-
2026-06-01days on market $304,494 Active 48 DOM
-
2026-05-31days on market $304,494 Active 47 DOM
-
2026-04-22soldstatus $212,300
-
2026-04-21price $304,494
-
2026-04-14$338,494 Active
-
2025-01-03soldstatus $564,200
ⓘ Source: listings_history table (triggers on properties + properties_extension) + one-shot
backfill from property_details.listing_events for pre-trigger history.
Tax reassessment forecast FL · Resets to sale price
- Current annual tax
- $1,000 · $83/mo
- Projected year-2 tax
- $2,561 · $213/mo
- Expected delta
- +$1,561/yr (+$130/mo · 156.1%)
ⓘ Screening estimate from a state-policy table — verify with the county assessor before closing.
Climate risk First Street
- Flood 1/10 Low FEMA zone X (unshaded) · 0% chance over 30 yrs
- Wildfire 4/10 Moderate
- Heat 9/10 Extreme 7 d/yr ≥106°F today · 21 d/yr by 30 yrs out
- Wind 10/10 Extreme 99% chance of damaging wind over 30 yrs
- Air quality 2/10 Low 2 unhealthy d/yr today · 2 by 30 yrs out
Nearby sold comps map
Loading sold comps map…
Walkable amenities ~0.75 mi
Loading nearby amenities…
Taxation est. · year 1
- Rental income
- $24,675
- − Mortgage interest
- −$17,280
- − Property taxes
- −$1,000
- − Insurance
- −$1,542
- − Repairs & maintenance
- −$1,974
- − Management
- −$1,974
- − Depreciation
- −$8,974
- Taxable loss
- −$8,070
- Est. tax savings @ 24.0%
- +$1,937
- After-tax cash flow
- $-525/yr
For passive investors: Depreciation is non-cash, so a rental often shows a tax loss while cash-flowing — sheltering income. Rental losses are passive: they offset passive income freely, and up to $25,000/yr can offset ordinary (W-2) income if you actively participate and your MAGI is under $100k (phasing out to $0 by $150k); unused losses carry forward. On sale, claimed depreciation is recaptured at up to 25%, and gains may owe capital-gains tax (a 1031 exchange can defer both). Figures are a year-1 estimate at your 24.0% rate — not tax advice; consult a CPA.
Schools (NCES district)
- District
- Flagler
- NCES district ID
- 1200540
- Math proficiency
- 53% ▼ -9.00%
- Reading proficiency
- 56% ▼ -4.00%
- Median HH income
- $48,354
- Composite
- 46.35/100
- National rank
- #2464
- State rank
- #20 of 73 in FL
Livability — Palm Coast
- Score
- 69/100
- State rank
- #478
- US rank
- #8721
Category grades
Schools grade is shown separately in the Schools card above.
Census & demographics
- Census place
- Palm Coast, FL
- County
- Flagler County · 113,412 people
- City population
- 105,049
- Metro
- Deltona-Daytona Beach-Ormond Beach, FL
- Population (ZIP)
- 48,391
- Household income
- $83,923
- Rent vs Own
- Severe rent burden
- 816.0
Population outlook (Flagler County) Hauer SSP2
- Today (2025)
- 123,474 people
- By 2030
- 131,864 · +6.8%
- By 2040
- 146,176 · +18.4%
- By 2050
- 157,398 · +27.5%
- By 2075
- 177,990 · +44.2%
- By 2100
- 183,381 · +48.5%
Race, ethnicity, and origin ACS 2023
- Neighborhood character
- Predominantly White (77%)
- Race & ethnicity
- White 77% Hispanic / Latino 10% Two or more races 8% Black 6% Asian 3%
- Hispanic origin (detail)
- Puerto Rican 4% Cuban 1%
- Common ancestry
- Romanian 4% Russian 2% Lithuanian 2%
- Foreign-born
- 13% · Canada, Jamaica
- Languages at home
- 85% English-only · Spanish 7% Other Indo-European 3% Russian/Polish/Slavic 2%
Political lean MEDSL · Flagler
- 2024 margin
- Strong R (+28.2) · D 35.6% · R 63.8%
- 2008→2024 swing
- -29.8pp toward R · 2008: 1.6pp · 2024: -28.2pp
- All cycles
- 2024: R+28.2 2020: R+20.8 2016: R+20.6 2012: R+7.4 2008: D+1.6
Not yet ingested
- Civics
- —
Market trends
- HPI YoY
- ▼ -153.27%
- Current HPI
- 290.4607
- Rent YoY
- ▲ 0.85%
- Metro
- Deltona-Daytona Beach-Ormond Beach, FL
- State GDP YoY
- ▲ 3.28%
- F500 in state
- 36
Industry mix (Fortune 500 HQ in FL)
| Industry | F500 HQs | Revenue |
|---|---|---|
| Industrial Technology | 2 | $29B |
|
||
| Insurance | 2 | $17B |
|
||
| Retail | 1 | $60B |
|
||
| Technology Distribution | 1 | $58B |
|
||
| Homebuilding | 1 | $35B |
|
||
| Technology Manufacturing | 1 | $35B |
|
||
Price history
-62.4% since first listed4 events — show timeline
- 2026-04-22 Sold (Public Records) $212,300 Public Records
- 2026-04-21 Price Changed $304,494 realMLS
- 2026-04-14 Listed $338,494 realMLS
- 2025-01-03 Sold (Public Records) $564,200 Public Records
Property tax history
+18.0%/yrLatest (2025): $1,000 · +96.7% YoY. Source: county tax records.
Cash-flow waterfall
monthlySold comps — $/sqft
last 12 mo · ≤1 miLoading sold comps…