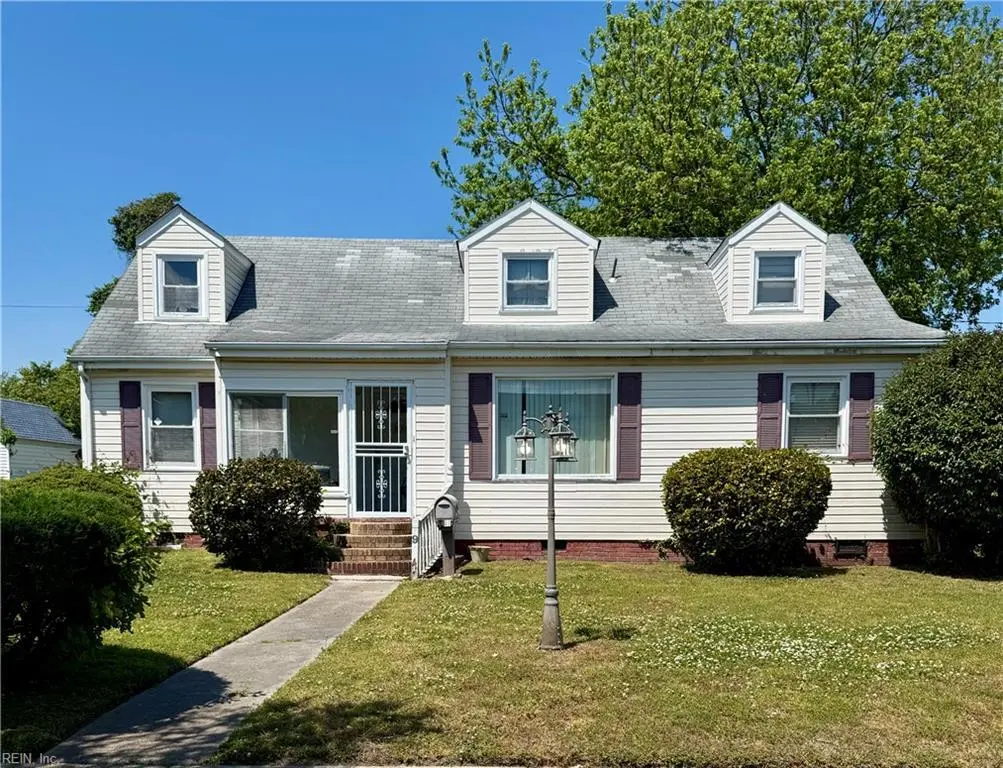
964 Marietta Ave · Norfolk, VA
Flood risk 1/10 · Minimal
- FEMA flood zone
- X (unshaded)
- Chance of flooding over 30 yrs
- 0.0%
- Est. flood insurance / yr
- $507 – $1,088
Fire risk 1/10 · Minimal
- Est. fire insurance / yr
- $666 – $1,236
Heat risk 9/10 · Severe
- Hot days now (above 105°F)
- 7 days/yr
- Hot days in 30 yrs
- 16 days/yr
Wind risk 8/10 · Major
- Chance of severe wind over 30 yrs
- 80.0%
Air-quality risk 3/10 · Minor
- Unhealthy air days now
- 2 days/yr
- Unhealthy air days in 30 yrs
- 3 days/yr
Risk factors via First Street. Map © Google.
Why this score? — see what drove the B grade
The composite is a weighted blend of 9 inputs, each scored 0–100. Each bar is that input's sub-score; the figure is the points it added to the 100-point composite (weight × sub-score).
- Cash flow +27.5/30.0
- ARV discount +15.0/15.0
- DSCR +9.7/10.0
- 1% rule +7.9/10.0
- Livability +4.2/5.0
- Schools +3.5/10.0
- Rent growth +3.4/5.0
- Condition / age +2.5/5.0
- Appreciation +0.0/10.0
$199,000
🖨 Deal sheet 📄 Offer letter ✓ Due diligence
Listing remarks
Investor special! Builders you want to take a look as new homes are going for $459k, this is a cash only or rehab loan property. Come see it today and submit your best offer. Buyer does their own due diligence. Sq ft pulled from tax records. This home if renovated can easily be converted to a five bedroom. Home on just under 1/4 acre, detached garage and driveway in the back.
Key facts
- 0.23 acre lot
- Garage
- Built 1948
Property features AI
Finance
- HOA & community: No HOA or POA fees reported
Exterior
- Parking: Detached 1-car garage; Additional driveway space; Off-street parking; Street parking
- Utilities: City/County water; City/County sewer; Electric water heater
- Home design: Detached home; Transitional style; Two stories; Crawl foundation; Simple ownership
- Construction: Crawl foundation; Aluminum and vinyl exterior
- Exterior features: Aluminum and vinyl siding; Chain-link fence; Asphalt shingle roof; Approximately 0.23-acre lot
Interior
- Bedrooms: Master bedroom (first floor) with ensuite
- Flooring: Carpet
- Bathrooms: Two full bathrooms
- Heating & cooling: Electric heating; Central air conditioning
- Interior features: One fireplace; Carpet flooring; First-floor bedroom with full bathroom; Office/Study; Breakfast area
Neighborhood map
What this means for you Summary
Snapshot
- This is a 5-bed/2.0-bath single-family listed at $199k.
Deal economics
- At list price, monthly cash flow is $590 ($7k/yr) — positive.
- The deal already cash-flows at list — no discount required.
- Meets the 1% rule at list price ($3k rent vs $199k).
- Recommended offer: $196k (1.5% below list) — sets the bar for market timing.
- Cap rate 9.8% vs local median 4.0% in Norfolk — top-decile yield for the area; either an underpriced asset or a hidden risk that comps aren't pricing in. Stress-test before assuming the spread holds.
Location & tenants
- Location reads 83/100 on livability (#43 in VA, #1,026 nationally) — a professional / high-income tenant draw. Strengths: amenities A+, commute A+, health & safety A+; Watch: employment C-, crime F.
- Norfolk City Public School District (urban): math 27% / reading 56% proficiency, ranked #118 of 131 in VA (top 90%) — families likely to look elsewhere, expect single-tenant / working-renter base with shorter leases.
- Zoned schools: Willard Elementary (math 27% / reading 52%, grade F, #900 of 1,108 statewide, top 83%, 506 students, 98% FRL); Norview High (math 33% / reading 85%, grade C+, #256 of 319 statewide, top 81%, 1,915 students, 97% FRL) — zoned schools average 97% FRL vs 59% district-wide (39 pts higher); higher-poverty schools than district average — tighter screening recommended.
- Market conditions: Rents rising (+3.4%/yr); 132 active listings in the ZIP; 13 comparable units currently listed for rent nearby; rentals at typical pace (median 24d on market — plan ~3-4 weeks tenant-placement turnaround); 46% of comp listings sitting > 30 days — soft ceiling on asking rent; 438 units permitted in Norfolk city in 2024 (273 in 5+ unit buildings).
- At $2,570/mo this rent would consume 45% of the median local household income ($68k/yr) (locally 1342% of renters already pay >50% of income on rent) — very limited rent-growth headroom before tenants either downsize or default.
Forward outlook
- Local home prices are declining (-3.0%/yr); year-one equity from $1k of loan paydown is wiped out by about $6k of value loss. Plan a longer hold.
- At projected returns (-3.0% appreciation + 3.4% rent growth), your $56k cash investment doubles in ~9 years — after that, you're playing with house money.
Negotiation context
- It's been on market 16 days — a 2% lower offer ($196k) is reasonable based on typical stale-listing flexibility.
Risks & watch-outs
- Watch-outs: built in 1948 — expect roof / HVAC / electrical / plumbing capex.
- Climate carrying-cost: severe wind risk, 80% chance of damaging wind over 30y; extreme-heat days projected 7→16/yr by 2055 (HVAC capex compounding) — expect insurance premiums to compound above CPI over the hold.
Questions for the listing agent
- Built in 1948 — when were the roof, HVAC, electrical panel, plumbing, and water heater last replaced?
- Is there a deadline driving the sale (1031 exchange, divorce, estate, relocation)? That informs how much negotiation room exists.
- Schools are A-rated — typically a magnet for longer-tenancy family renters. What's the average tenant stay here, and is there a school-zone premium baked into asking?
- Crime grade is F in this area — have there been break-ins, vandalism, or insurance claims at this property in the last 3 years? What carrier currently insures it and at what premium?
- What's the average days-on-market for RENTAL listings here right now (not sales)? A rising rental-DOM trend means longer vacancies and softer asking-rent achievability than the comps imply.
- What's the recent tenant-quality profile in this submarket — average credit score on applications, eviction rate, late-payment / NSF rate, and stable-employment percentage? A property-management company in the area should have these aggregated.
- How much new for-sale + rental construction is in the pipeline within 1–3 miles? Heavy new supply typically softens prices + rents 12–24 months out; constrained supply supports both.
Investment metrics
- 1% rule
- 1.29% ✓
- Cap rate
- 9.85%
- Cash-on-cash
- 12.70%
- DSCR
- 1.57
- GRM
- 6.5
CMA / ARV
- ARV (median comp)
- $397,440
- List price
- $199,000
- Delta
- -49.93%
- Verdict
- UNDERPRICED
- Comps
- 20 within 1.0 mi
Show comp detail 12 sales within ~0.75 mi
| Address | Dist | Beds/Ba | Sqft | Sold | Price | $/sf | Match |
|---|---|---|---|---|---|---|---|
| 964 Marietta Ave | 0.00mi | 4/2.0 (-1) | 2,184 (0%) | 1mo | $199,000 | $91 | 94 |
| 977 Wolcott Ave | 0.11mi | 5/2.0 | 2,316 (+6%) | 3mo | $380,000 | $164 | 83 |
| 6446 Clare Rd | 0.24mi | 4/2.5 (-1) | 2,214 (+1%) | 6mo | $459,900 | $208 | 74 |
| 1072 Joyner St | 0.46mi | 4/2.5 (-1) | 2,146 (-2%) | 3mo | $410,000 | $191 | 66 |
| 1055 Kittrell St | 0.42mi | 4/2.5 (-1) | 2,250 (+3%) | 3mo | $449,900 | $200 | 66 |
| 6348 Whittier Dr | 0.48mi | 4/2.5 (-1) | 2,243 (+3%) | 1mo | $460,000 | $205 | 65 |
| 7012 Gregory Dr | 0.40mi | 4/2.5 (-1) | 2,312 (+6%) | 3mo | $405,000 | $175 | 62 |
| 1072 Kane St | 0.56mi | 4/2.5 (-1) | 2,170 (-1%) | 7mo | $440,000 | $203 | 60 |
| 6384 Dove St | 0.37mi | 4/3.0 (-1) | 1,998 (-8%) | 3mo | $403,800 | $202 | 57 |
| 809 Craten Rd | 0.53mi | 4/2.5 (-1) | 2,380 (+9%) | 4mo | $390,000 | $164 | 50 |
| 1029 Avenue E | 0.66mi | 4/2.5 (-1) | 2,034 (-7%) | 4mo | $409,000 | $201 | 47 |
| 1077 Green St | 0.67mi | 4/2.5 (-1) | 1,949 (-11%) | 0mo | $400,000 | $205 | 44 |
Match score weights: distance 35% · size 25% · config 20% · recency 20%. Top-matched comps best support the ARV.
Projected returns pro-forma
-3.0% appreciation · 3.42% rent growth · sell at horizon
- IRR
- 3.0%
- Equity multiple
- 1.12×
- Total profit
- $6,477
- Equity at exit
- $29,672
- IRR
- 13.0%
- Equity multiple
- 2.06×
- Total profit
- $58,832
- Equity at exit
- $17,206
Cash invested: $55,720 (down + closing). Projections, not guarantees.
Landlord ↔ Tenant lean methodology
- Overall (STATE)
- 55 Moderately Landlord-Leaning
- State Virginia
- 55 Moderately Landlord-Leaning · D+2
- County
- — inherits STATE
- City
- — inherits STATE
ZIP-level market 23513
- Home prices YoY
- -9.3%
- Rents YoY
- 3.4%
- Active inventory
- 132
- Price-to-rent
- 6.5×
Monthly cashflow live
- Estimated rent
- $2,570 high interval (Pro) →
- Mortgage (P&I)
- −$1,044
- Tax from tax record
- −$314 /mo · $3,774/yr
- Insurance
- −$83
- HOA
- −$0
- Vacancy / Maint / Mgmt
- −$540
- Net cashflow
- $590
Break-even live
UW: 25.0% down · 7.5% · 30yr · 1.5% tax · 5.0% vac · 8.0% maint · 8.0% mgmt
Financing live
Cash to close
- Down payment
- $49,750
- Closing costs
- $5,970
- Reserves months
- —
- Total cash needed
- —
Loan-product check · same deal, 3 products live
Conventional
25% down · 7.5% · 30yr
- Down + closing
- —
- Monthly P&I
- —
- Monthly cashflow
- —
- DSCR
- —
- Eligible?
- —
Personal DTI + credit; lowest rate.
DSCR
20% down · 8.5% · 30yr
- Down + closing
- —
- Monthly P&I
- —
- Monthly cashflow
- —
- DSCR
- —
- Eligible?
- —
No personal income docs; deal must DSCR.
Hard money
10% down · 12.0% · 12mo
- Down + closing
- —
- Monthly P&I
- —
- Monthly cashflow
- —
- DSCR
- —
- Eligible?
- —
Short-term bridge; refi at stabilization.
Rent comps 13 comps
| Address | Beds | Baths | Sqft | Rent | $/sqft | DOM | Units | Dist |
|---|---|---|---|---|---|---|---|---|
| 7120 Clarion Ln Norfolk, VA | 4.0 | 2.0 | 1506 | $2,300 | $1.53 | 17d | 1 | 0.62mi |
| 941 Avenue G Unit G Norfolk, VA | 4.0 | 2.5 | 2029 | $2,600 | $1.28 | 3d | 1 | 0.67mi |
| 6261 Alexander St Norfolk, VA | 5.0 | 2.0 | 2166 | $2,495 | $1.15 | 43d | 1 | 0.76mi |
| 946 Avenue H Norfolk, VA | 4.0 | 2.0 | 1980 | $750 | $0.38 | 43d | 1 | 0.82mi |
| 3776 Wayne Cir Norfolk, VA | 4.0 | 3.0 | 2301 | $2,795 | $1.21 | 43d | 1 | 0.88mi |
| 409 Draper Dr Norfolk, VA | 4.0 | 2.5 | 2262 | $2,850 | $1.26 | 43d | 1 | 1.17mi |
| 3541 Chesapeake Blvd Norfolk, VA | 5.0 | 1.0 | 1476 | $1,275 | $0.86 | 7d | 1 | 1.19mi |
| 8028 Glade Rd Norfolk, VA | 4.0 | 2.5 | 2061 | $2,900 | $1.41 | 43d | 1 | 1.24mi |
| 405 San Antonio Blvd Norfolk, VA | 4.0 | 2.5 | 2200 | $2,600 | $1.18 | 12d | 1 | 1.29mi |
| 8107 Old Ocean View Rd Norfolk, VA | 4.0 | 1.0 | 1562 | $2,095 | $1.34 | 17d | 1 | 1.36mi |
| 845 Burksdale Rd Norfolk, VA | 5.0 | 2.0 | 1680 | $1,895 | $1.13 | 23d | 1 | 1.38mi |
| 3414 Tidewater Dr Norfolk, VA | 4.0 | 2.5 | 2200 | $3,000 | $1.36 | 43d | 1 | 1.42mi |
| 3640 Robin Hood Rd Norfolk, VA | 4.0 | 2.5 | 1400 | $2,999 | $2.14 | 17d | 1 | 1.49mi |
Listing history 3 events
-
2026-05-13status Under Contract 378-char remark
-
2026-05-02historical Active Under Contract 378-char remark
-
2026-04-27$199,000 Active 378-char remark
ⓘ Source: listings_history table (triggers on properties + properties_extension) + one-shot
backfill from property_details.listing_events for pre-trigger history.
Tax reassessment forecast VA · Resets to sale price
- Current annual tax
- $3,774 · $314/mo
- Projected year-2 tax
- $3,774 · $314/mo
- Expected delta
- $0/yr ($0/mo · 0.0%)
ⓘ Screening estimate from a state-policy table — verify with the county assessor before closing.
Climate risk First Street
- Flood 1/10 Low FEMA zone X (unshaded) · 0% chance over 30 yrs
- Wildfire 1/10 Low
- Heat 9/10 Extreme 7 d/yr ≥105°F today · 16 d/yr by 30 yrs out
- Wind 8/10 Severe 80% chance of damaging wind over 30 yrs
- Air quality 3/10 Moderate 2 unhealthy d/yr today · 3 by 30 yrs out
Nearby sold comps map
Loading sold comps map…
Walkable amenities ~0.75 mi
Loading nearby amenities…
Taxation est. · year 1
- Rental income
- $30,844
- − Mortgage interest
- −$11,147
- − Property taxes
- −$3,774
- − Insurance
- −$995
- − Repairs & maintenance
- −$2,468
- − Management
- −$2,468
- − Depreciation
- −$5,789
- Taxable income
- $4,205
- Est. tax owed @ 24.0%
- −$1,009
- After-tax cash flow
- $6,066/yr
For passive investors: Depreciation is non-cash, so a rental often shows a tax loss while cash-flowing — sheltering income. Rental losses are passive: they offset passive income freely, and up to $25,000/yr can offset ordinary (W-2) income if you actively participate and your MAGI is under $100k (phasing out to $0 by $150k); unused losses carry forward. On sale, claimed depreciation is recaptured at up to 25%, and gains may owe capital-gains tax (a 1031 exchange can defer both). Figures are a year-1 estimate at your 24.0% rate — not tax advice; consult a CPA.
Schools (NCES district)
- District
- Norfolk City Public School District
- NCES district ID
- 5102670
- Math proficiency
- 27% ▼ -44.00%
- Reading proficiency
- 56% ▼ -10.00%
- Median HH income
- $44,358
- Composite
- 35.08/100
- National rank
- #5026
- State rank
- #118 of 131 in VA
Livability — Norfolk
- Score
- 83/100
- State rank
- #43
- US rank
- #1026
Category grades
Schools grade is shown separately in the Schools card above.
Census & demographics
- Census place
- Norfolk, VA
- County
- Norfolk City · 214,042 people
- City population
- 214,042
- Metro
- Virginia Beach-Norfolk-Newport News, VA-NC
- Population (ZIP)
- 28,628
- Household income
- $68,380
- Rent vs Own
- Severe rent burden
- 1342.0
Population outlook (Norfolk County) Hauer SSP2
- Today (2025)
- 249,032 people
- By 2030
- 252,347 · +1.3%
- By 2040
- 253,644 · +1.9%
- By 2050
- 251,913 · +1.2%
- By 2075
- 245,281 · -1.5%
- By 2100
- 219,548 · -11.8%
Race, ethnicity, and origin ACS 2023
- Neighborhood character
- Diverse neighborhood (Simpson 0.63)
- Race & ethnicity
- Black 55% White 23% Hispanic / Latino 11% Two or more races 7% Asian 5%
- Hispanic origin (detail)
- Mexican 4% Puerto Rican 3%
- Common ancestry
- Romanian 1% Slovak 1% Lithuanian 0%
- Foreign-born
- 10% · Canada
- Languages at home
- 87% English-only · Spanish 6% Tagalog/Filipino 4% French/Haitian/Cajun 1%
Political lean MEDSL · Norfolk
- 2024 margin
- Solid D (+41.5) · D 70.0% · R 28.5% · Other 1.6%
- 2008→2024 swing
- -1.4pp toward R · 2008: 43.0pp · 2024: 41.5pp
- All cycles
- 2024: D+41.5 2020: D+45.6 2016: D+42.0 2012: D+44.0 2008: D+43.0
Not yet ingested
- Civics
- —
Market trends
- HPI YoY
- ▼ -33.67%
- Current HPI
- 329.2241
- Rent YoY
- ▲ 3.42%
- Metro
- Virginia Beach-Norfolk-Newport News, VA-NC
- State GDP YoY
- ▲ 2.40%
- F500 in state
- 50
Industry mix (Fortune 500 HQ in VA)
| Industry | F500 HQs | Revenue |
|---|---|---|
| Aerospace / Defense | 4 | $236B |
|
||
| Technology / Defense | 3 | $32B |
|
||
| Financial Services | 2 | $176B |
|
||
| Utilities | 2 | $27B |
|
||
| Insurance | 2 | $25B |
|
||
| Technology | 2 | $15B |
|
||
Price history
+0.0% since first listed4 events — show timeline
- 2026-05-29 Sold (MLS) $199,000 REINMLS
- 2026-05-13 Pending — REINMLS
- 2026-05-02 Contingent — REINMLS
- 2026-04-27 Listed $199,000 REINMLS
Property tax history
+3.5%/yrLatest (2025): $3,774 · +6.4% YoY. Source: county tax records.
Cash-flow waterfall
monthlySold comps — $/sqft
last 12 mo · ≤1 miLoading sold comps…