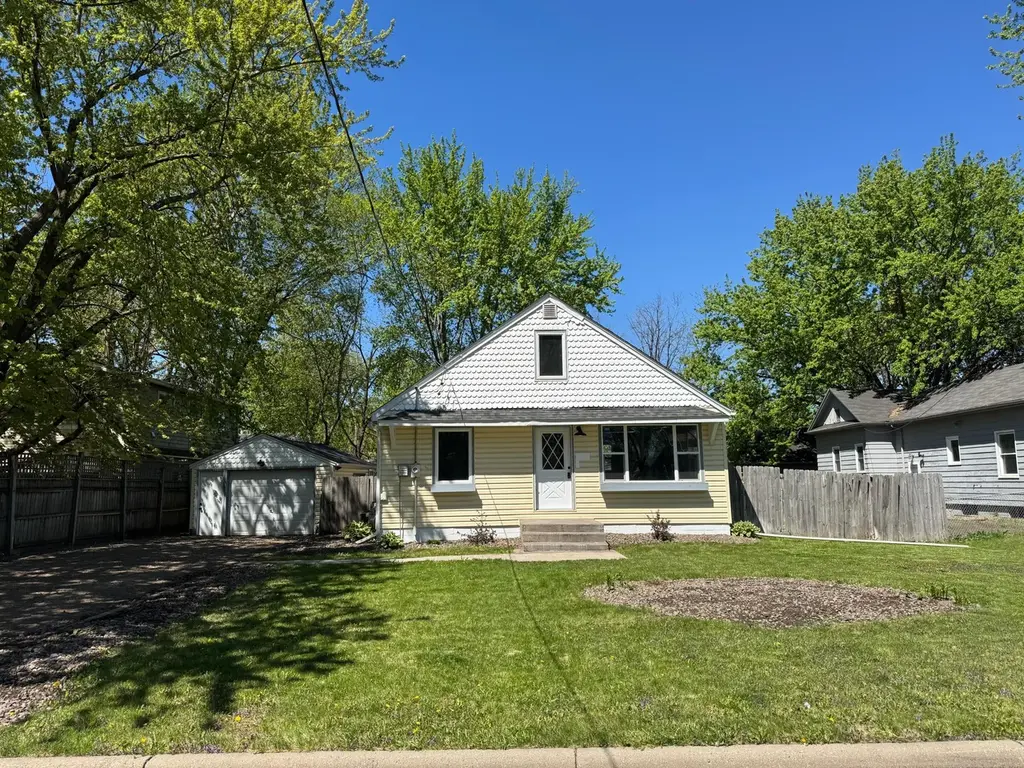
1647 Marsh Ave · Maple Plain, MN
Flood risk 1/10 · Minimal
- FEMA flood zone
- X (unshaded)
- Chance of flooding over 30 yrs
- 0.0%
- Est. flood insurance / yr
- $507 – $1,088
Fire risk 2/10 · Minimal
- Est. fire insurance / yr
- $888 – $1,650
Heat risk 2/10 · Minimal
- Hot days now (above 98°F)
- 7 days/yr
- Hot days in 30 yrs
- 14 days/yr
Wind risk 2/10 · Minimal
- Chance of severe wind over 30 yrs
- —
Air-quality risk 2/10 · Minimal
- Unhealthy air days now
- 1 days/yr
- Unhealthy air days in 30 yrs
- 1 days/yr
Risk factors via First Street. Map © Google.
Why this score? — see what drove the F grade
The composite is a weighted blend of 9 inputs, each scored 0–100. Each bar is that input's sub-score; the figure is the points it added to the 100-point composite (weight × sub-score).
- ARV discount +15.0/15.0
- Schools +6.3/10.0
- Cash flow +3.8/30.0
- Livability +3.2/5.0
- Rent growth +2.5/5.0
- Condition / age +2.5/5.0
- 1% rule +0.0/10.0
- DSCR +0.0/10.0
- Appreciation +0.0/10.0
$362,500
🖨 Deal sheet 📄 Offer letter ✓ Due diligence
Listing remarks MLS
sold
Key facts
- Scenic trails
- Cul-de-sac
- 0.26 acre lot
Tags
Property features AI
Finance
- Other: Lot approximately 0.26 acres (approx. 75 x 133); Publicly maintained road access
- Financial info: Acceptable financing: cash or free and clear
Exterior
- Parking: Gravel driveway; 1-car detached garage
- Utilities: City water (connected); City sewer (connected); Electric service with circuit breakers; Natural gas
- Home design: Residential property; One and one-half levels; Other structures include kennel/dog run, hen house and storage shed; Property on a city street cul-de-sac
- Construction: Block foundation; Asphalt roof (8 years old or newer)
- Exterior features: Patio; Vinyl siding; Partial wood privacy fencing
Interior
- Kitchen: Dishwasher; Microwave; Range; Refrigerator; Stainless steel appliances
- Bedrooms: 3 bedrooms (one bedroom on the lower level, two on the main/upper levels as listed)
- Bathrooms: One full bathroom on the main floor; One three-quarter bathroom in the basement
- Heating & cooling: Forced air heating; Central air conditioning
- Interior features: Finished basement with daylight/lookout windows, storage space and sump pump; Tile drainage system in basement; Eat-in kitchen; Water softener (owned)
- Laundry & utility: Laundry in basement with washer hookup, gas dryer hookup and utility sink; Gas water heater
Neighborhood map
What this means for you Summary
Snapshot
- This is a 3-bed/2.0-bath single-family listed at $362k.
Deal economics
- At list price, monthly cash flow is $-1k ($-13k/yr) — negative.
- To cash-flow at today's rent, offer at most $176k (51.4% below list).
- To meet the 1% rule (rent ≥ 1% of price), the offer needs to be $164k (54.8% below list).
- Recommended offer: $164k (54.8% below list) — sets the bar for 1% rule.
Location & tenants
- Location reads 63/100 on livability (#655 in MN) — a middle-class / working-renter tenant base. Strengths: crime A+, housing A+, employment B+; Watch: schools D+, amenities F, commute F.
- Orono Public School District (rural): math 65% / reading 73% proficiency, ranked #9 of 301 in MN (top 3%) — acceptable for families but not a draw, mixed tenant base, ~2y average lease; only 5% free/reduced lunch — higher-income household profile.
- Market conditions: 60 active listings in the ZIP; 4 comparable units currently listed for rent nearby; rentals leasing fast (median 2d on market — plan ~1-2 weeks tenant-placement turnaround); 4,651 units permitted in Hennepin County in 2024 (2,443 in 5+ unit buildings).
Forward outlook
- Local home prices are declining (-3.0%/yr); year-one equity from $3k of loan paydown is wiped out by about $11k of value loss. Plan a longer hold.
- Hennepin County population projected at +30% by 2050 — long-run rental-demand tailwind backs the buy-and-hold thesis.
Negotiation context
- Only 13 days on market — expect competitive offers; lowballing is unlikely to land.
- 6 sale attempts since 11y ago with the ask held roughly flat each time — persistent listings suggest the price (not the market) is what's stuck; bring a comps-based counter.
- Current owner paid $214k; list at $362k implies a 70% gain — meaningful room to come down on a strong offer.
Risks & watch-outs
- Watch-outs: built in 1952 — expect roof / HVAC / electrical / plumbing capex.
Questions for the listing agent
- What do current leases actually rent for vs. the listed asking? Can we see a recent rent roll and the last 12 months of T-12 income?
- Built in 1952 — when were the roof, HVAC, electrical panel, plumbing, and water heater last replaced?
- Is there a deadline driving the sale (1031 exchange, divorce, estate, relocation)? That informs how much negotiation room exists.
- Schools are D-rated, which usually means shorter tenancies and higher turnover. Who's the typical renter profile here, and what's been the actual vacancy rate?
- The area grade is low — what's the realistic commute time and amenity access for the typical tenant pool here? Any planned neighborhood developments (good or bad) we should know about?
- What's the average days-on-market for RENTAL listings here right now (not sales)? A rising rental-DOM trend means longer vacancies and softer asking-rent achievability than the comps imply.
- What's the recent tenant-quality profile in this submarket — average credit score on applications, eviction rate, late-payment / NSF rate, and stable-employment percentage? A property-management company in the area should have these aggregated.
- How much new for-sale + rental construction is in the pipeline within 1–3 miles? Heavy new supply typically softens prices + rents 12–24 months out; constrained supply supports both.
Investment metrics
- 1% rule
- 0.45% ✗
- Cap rate
- 2.80%
- Cash-on-cash
- -12.46%
- DSCR
- 0.45
- GRM
- 18.4
CMA / ARV
- ARV (median comp)
- $579,671
- List price
- $362,500
- Delta
- -36.88%
- Verdict
- UNDERPRICED
- Comps
- 2 within 2.0 mi
Show comp detail 1 sale within ~0.75 mi
| Address | Dist | Beds/Ba | Sqft | Sold | Price | $/sf | Match |
|---|---|---|---|---|---|---|---|
| 5010 Main St E | 0.48mi | 3/2.0 | 1,638 (+11%) | 23mo | $300,000 | $183 | 40 |
Match score weights: distance 35% · size 25% · config 20% · recency 20%. Top-matched comps best support the ARV.
Projected returns pro-forma
-3.0% appreciation · 3.0% rent growth · sell at horizon
- IRR
- -39.5%
- Equity multiple
- -0.24×
- Total profit
- $-125,942
- Equity at exit
- $54,050
- IRR
- -62.1%
- Equity multiple
- -0.93×
- Total profit
- $-196,397
- Equity at exit
- $31,342
Cash invested: $101,500 (down + closing). Projections, not guarantees.
Landlord ↔ Tenant lean methodology
- Overall (STATE)
- 46 Balanced
- State Minnesota
- 46 Balanced · D+2
- County
- — inherits STATE
- City
- — inherits STATE
ZIP-level market 55359
- Active inventory
- 60
- Price-to-rent
- 18.4×
Monthly cashflow live
- Estimated rent
- $1,640 medium interval (Pro) →
- Mortgage (P&I)
- −$1,901
- Tax from tax record
- −$298 /mo · $3,571/yr
- Insurance
- −$151
- HOA
- −$0
- Vacancy / Maint / Mgmt
- −$344
- Net cashflow
- $-1,054
Break-even live
UW: 25.0% down · 7.5% · 30yr · 1.5% tax · 5.0% vac · 8.0% maint · 8.0% mgmt
Financing live
Cash to close
- Down payment
- $90,625
- Closing costs
- $10,875
- Reserves months
- —
- Total cash needed
- —
Loan-product check · same deal, 3 products live
Conventional
25% down · 7.5% · 30yr
- Down + closing
- —
- Monthly P&I
- —
- Monthly cashflow
- —
- DSCR
- —
- Eligible?
- —
Personal DTI + credit; lowest rate.
DSCR
20% down · 8.5% · 30yr
- Down + closing
- —
- Monthly P&I
- —
- Monthly cashflow
- —
- DSCR
- —
- Eligible?
- —
No personal income docs; deal must DSCR.
Hard money
10% down · 12.0% · 12mo
- Down + closing
- —
- Monthly P&I
- —
- Monthly cashflow
- —
- DSCR
- —
- Eligible?
- —
Short-term bridge; refi at stabilization.
Rent comps 4 comps
| Address | Beds | Baths | Sqft | Rent | $/sqft | DOM | Units | Dist |
|---|---|---|---|---|---|---|---|---|
| 1644 Delano St Maple Plain, MN | 2.0 | 1.0 | 950 | $1,595 | $1.68 | 43d | 1 | 0.12mi |
| 5285 Manchester Dr Maple Plain, MN | 2.0 | 1.0 | 1100 | $1,395 | $1.27 | 1d | 1 | 0.25mi |
| 1880 Newport St Maple Plain, MN | 2.0 | 1.0 | 900 | $1,295 | $1.44 | 1d | 1 | 0.36mi |
| 4760 Ironwood Cir Minnetrista, MN | 3.0–4.0 | 2.5 | 1625 | $2,999 | $1.84 | 1d | 3 | 0.79mi |
Listing history 23 events
-
2026-06-18days on market $362,500 Active 13 DOM
-
2026-06-17days on market $362,500 Active 12 DOM
-
2026-06-16days on market $362,500 Active 11 DOM
-
2026-06-15days on market $362,500 Active 10 DOM
-
2026-06-13days on market $362,500 Active 8 DOM
-
2026-06-09days on market $362,500 Active 4 DOM
-
2026-06-08days on market $362,500 Active 3 DOM
-
2026-06-07pricedays on market $362,500 Active 2 DOM
-
2026-05-31days on market $365,900 Active 16 DOM
-
2026-05-15$365,900 Active 325-char remark
-
2018-11-02soldstatus $213,700 4-char remark
Show marketing remark (4 chars)
sold
-
2018-11-01$213,200 4-char remark
Show marketing remark (4 chars)
sold
-
2018-06-22soldstatus $213,700
-
2016-06-21soldstatus $108,500
-
2016-05-20soldstatus $108,500 Sold
-
2016-05-03status Pending
-
2016-04-21historical Contingent - Inspection
-
2016-03-14status Active
-
2016-02-18historical Contingent - Inspection
-
2015-12-14status Active
-
2015-10-30historical
-
2015-10-05$115,000 Active
-
1976-02-01soldstatus $30,000
ⓘ Source: listings_history table (triggers on properties + properties_extension) + one-shot
backfill from property_details.listing_events for pre-trigger history.
Tax reassessment forecast MN · Partial reset (capped growth)
- Current annual tax
- $3,571 · $298/mo
- Projected year-2 tax
- $3,815 · $318/mo
- Expected delta
- +$245/yr (+$20/mo · 6.8%)
ⓘ Screening estimate from a state-policy table — verify with the county assessor before closing.
Climate risk First Street
- Flood 1/10 Low FEMA zone X (unshaded) · 0% chance over 30 yrs
- Wildfire 2/10 Low
- Heat 2/10 Low 7 d/yr ≥98°F today · 14 d/yr by 30 yrs out
- Wind 2/10 Low
- Air quality 2/10 Low 1 unhealthy d/yr today · 1 by 30 yrs out
Nearby sold comps map
Loading sold comps map…
Walkable amenities ~0.75 mi
Loading nearby amenities…
Taxation est. · year 1
- Rental income
- $19,680
- − Mortgage interest
- −$20,306
- − Property taxes
- −$3,571
- − Insurance
- −$1,812
- − Repairs & maintenance
- −$1,574
- − Management
- −$1,574
- − Depreciation
- −$10,545
- Taxable loss
- −$19,703
- Est. tax savings @ 24.0%
- +$4,729
- After-tax cash flow
- $-7,919/yr
For passive investors: Depreciation is non-cash, so a rental often shows a tax loss while cash-flowing — sheltering income. Rental losses are passive: they offset passive income freely, and up to $25,000/yr can offset ordinary (W-2) income if you actively participate and your MAGI is under $100k (phasing out to $0 by $150k); unused losses carry forward. On sale, claimed depreciation is recaptured at up to 25%, and gains may owe capital-gains tax (a 1031 exchange can defer both). Figures are a year-1 estimate at your 24.0% rate — not tax advice; consult a CPA.
Schools (NCES district)
- District
- Orono Public School District
- NCES district ID
- 2725080
- Math proficiency
- 65% ▼ -11.00%
- Reading proficiency
- 73% ▼ -6.00%
- Median HH income
- $93,850
- Composite
- 62.7/100
- National rank
- #673
- State rank
- #9 of 301 in MN
Livability — Maple Plain
- Score
- 63/100
- State rank
- #655
- US rank
- #15738
Category grades
Schools grade is shown separately in the Schools card above.
Census & demographics
- Census place
- Maple Plain, MN
- Population (ZIP)
- 7,068
Population outlook (Hennepin County) Hauer SSP2
- Today (2025)
- 1,405,227 people
- By 2030
- 1,492,650 · +6.2%
- By 2040
- 1,660,157 · +18.1%
- By 2050
- 1,823,498 · +29.8%
- By 2075
- 2,221,283 · +58.1%
- By 2100
- 2,509,976 · +78.6%
Race, ethnicity, and origin ACS 2023
- Neighborhood character
- Predominantly White (91%)
- Race & ethnicity
- White 91% Two or more races 5% Hispanic / Latino 2% Black 1% Asian 1%
- Common ancestry
- Portuguese 11% Romanian 5% Lithuanian 5%
- Foreign-born
- 2% · Canada, South Korea, Vietnam
- Languages at home
- 96% English-only · Spanish 2%
Political lean MEDSL · Hennepin
- 2024 margin
- Solid D (+42.6) · D 70.2% · R 27.5% · Other 2.3%
- 2008→2024 swing
- +14.0pp toward D · 2008: 28.6pp · 2024: 42.6pp
- All cycles
- 2024: D+42.6 2020: D+43.2 2016: D+35.3 2012: D+27.1 2008: D+28.6
Not yet ingested
- Civics
- —
Market trends
- HPI YoY
- ▼ -159.80%
- Current HPI
- 261.8218
- Rent YoY
- —
- Metro
- —
- State GDP YoY
- ▲ 2.41%
- F500 in state
- 34
Industry mix (Fortune 500 HQ in MN)
| Industry | F500 HQs | Revenue |
|---|---|---|
| Healthcare | 2 | $407B |
|
||
| Retail | 2 | $150B |
|
||
| Consumer Goods | 2 | $32B |
|
||
| Industrial Machinery | 2 | $6B |
|
||
| Agriculture | 1 | $40B |
|
||
| Healthcare / Medical Devices | 1 | $32B |
|
||
Price history
+1108.3% since first listed16 events — show timeline
- 2026-06-05 Listed $362,500 NORTHSTARMLS as Distributed by MLS Grid
- 2026-05-31 Listing Removed — NORTHSTARMLS as Distributed by MLS Grid
- 2026-05-15 Listed $365,900 NORTHSTARMLS as Distributed by MLS Grid
- 2018-11-02 Sold (MLS) $213,700 NORTHSTARMLS as Distributed by MLS Grid
- 2018-11-01 Listed $213,200 NORTHSTARMLS as Distributed by MLS Grid
- 2018-06-22 Sold (Public Records) $213,700 Public Records
- 2016-06-21 Sold (Public Records) $108,500 Public Records
- 2016-05-20 Sold (MLS) $108,500 NORTHSTARMLS as Distributed by MLS Grid
- 2016-05-03 Pending — NORTHSTARMLS as Distributed by MLS Grid
- 2016-04-21 Contingent — NORTHSTARMLS as Distributed by MLS Grid
- 2016-03-14 Relisted — NORTHSTARMLS as Distributed by MLS Grid
- 2016-02-18 Contingent — NORTHSTARMLS as Distributed by MLS Grid
- 2015-12-14 Relisted — NORTHSTARMLS as Distributed by MLS Grid
- 2015-10-30 Listing Removed — NORTHSTARMLS as Distributed by MLS Grid
- 2015-10-05 Listed $115,000 NORTHSTARMLS as Distributed by MLS Grid
- 1976-02-01 Sold (Public Records) $30,000 Public Records
Property tax history
+4.5%/yrLatest (2025): $3,571 · +2.9% YoY. Source: county tax records.
Cash-flow waterfall
monthlySold comps — $/sqft
last 12 mo · ≤1 miLoading sold comps…