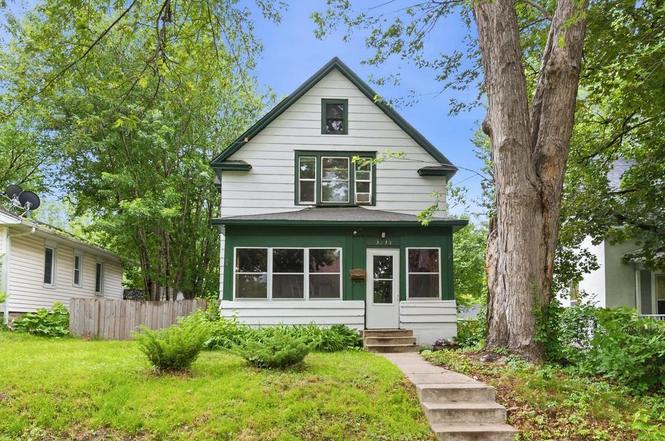
3735 Girard Ave N · Minneapolis, MN
Flood risk 1/10 · Minimal
- FEMA flood zone
- X (unshaded)
- Chance of flooding over 30 yrs
- 0.0%
- Est. flood insurance / yr
- $473 – $860
Fire risk 1/10 · Minimal
- Est. fire insurance / yr
- $888 – $1,650
Heat risk 2/10 · Minimal
- Hot days now (above 99°F)
- 7 days/yr
- Hot days in 30 yrs
- 14 days/yr
Wind risk 2/10 · Minimal
- Chance of severe wind over 30 yrs
- —
Air-quality risk 2/10 · Minimal
- Unhealthy air days now
- 1 days/yr
- Unhealthy air days in 30 yrs
- 1 days/yr
Risk factors via First Street. Map © Google.
Why this score? — see what drove the D+ grade
The composite is a weighted blend of 9 inputs, each scored 0–100. Each bar is that input's sub-score; the figure is the points it added to the 100-point composite (weight × sub-score).
- ARV discount +14.4/15.0
- Cash flow +14.0/30.0
- DSCR +4.3/10.0
- Rent growth +4.1/5.0
- Livability +3.9/5.0
- Schools +3.5/10.0
- 1% rule +3.1/10.0
- Condition / age +2.5/5.0
- Appreciation +0.0/10.0
$225,000
🖨 Deal sheet 📄 Offer letter ✓ Due diligence
Listing remarks MLS
Back on the market! Completely renovated, beautiful 3 bedroom home! Updates include, brand new granite counter, new stainless steel appliances, new washer and dryer, whole house freshly painted, gleaming hardwood floors, brand new upper floor bathroom with a new vanity and shower. Huge 3 season porch, detached 2 car garage and much more! Close to downtown, all at a price under $200k!
Key facts
- Three season porch
- Updated kitchen
- Granite countertops
Tags
Property features AI
Finance
- Other: Above-grade finished area and living area reported; Basement: full and unfinished
Exterior
- Parking: Detached 2-car garage; One carport space
- Utilities: City water (connected); City sewer (connected); Natural gas; Electric with circuit breakers; Power provided by Xcel Energy
- Home design: Residential property; Two levels; Entry on main level
- Construction: Brick/mortar foundation; Built with traditional construction
- Exterior features: Covered, enclosed front porch (glass enclosed); Three-season porch; Chain link, wood, and privacy fencing; Tree coverage (medium); City view; Zero lot line
Interior
- Kitchen: Kitchen with center island; Range; Dishwasher; Refrigerator
- Bedrooms: Three bedrooms total; Primary bedroom on upper level; Second and third bedrooms on upper level
- Flooring: Hardwood floors
- Bathrooms: One full bathroom (upper level)
- Heating & cooling: Hot water heating; No central air
- Interior features: Hardwood floors; Natural woodwork; Kitchen center island; Kitchen window; Porch
- Laundry & utility: Washer and dryer (hookup in basement); Laundry located in basement
Neighborhood map
What this means for you Summary
Snapshot
- This is a 3-bed/1.0-bath single-family listed at $225k.
Deal economics
- At list price, monthly cash flow is $31 ($370/yr) — positive.
- The deal already cash-flows at list — no discount required.
- To meet the 1% rule (rent ≥ 1% of price), the offer needs to be $183k (18.8% below list).
- Recommended offer: $183k (18.8% below list) — sets the bar for 1% rule.
- Cap rate 6.5% vs local median 3.1% in Minneapolis — top-decile yield for the area; either an underpriced asset or a hidden risk that comps aren't pricing in. Stress-test before assuming the spread holds.
Location & tenants
- Location reads 78/100 on livability (#110 in MN, #2,525 nationally) — a middle-class / working-renter tenant base. Strengths: amenities A+, commute A+, housing A+; Watch: cost of living C-, crime F.
- Minneapolis Public School District (urban): math 35% / reading 46% proficiency, ranked #217 of 301 in MN (top 72%) — families likely to look elsewhere, expect single-tenant / working-renter base with shorter leases.
- Market conditions: Rents rising fast (+6.3%/yr); 169 active listings in the ZIP; 21 comparable units currently listed for rent nearby; rentals at typical pace (median 21d on market — plan ~3-4 weeks tenant-placement turnaround); 4,651 units permitted in Hennepin County in 2024 (2,443 in 5+ unit buildings).
- This rent runs 32% of the median local income ($69k/yr) — at the standard rent-burdened threshold; future hikes will face affordability resistance.
Forward outlook
- Local home prices are declining (-3.0%/yr); year-one equity from $2k of loan paydown is wiped out by about $7k of value loss. Plan a longer hold.
- Hennepin County population projected at +30% by 2050 — long-run rental-demand tailwind backs the buy-and-hold thesis.
Negotiation context
- Only 1 days on market — expect competitive offers; lowballing is unlikely to land.
- 9 sale attempts since 23y ago with the ask held roughly flat each time — persistent listings suggest the price (not the market) is what's stuck; bring a comps-based counter.
- Current owner paid $182k; 24% above their basis — modest negotiation headroom, anchor on the comps not their cost.
Risks & watch-outs
- Watch-outs: built in 1907 — expect roof / HVAC / electrical / plumbing capex.
Questions for the listing agent
- Built in 1907 — when were the roof, HVAC, electrical panel, plumbing, and water heater last replaced?
- Is there a deadline driving the sale (1031 exchange, divorce, estate, relocation)? That informs how much negotiation room exists.
- Crime grade is F in this area — have there been break-ins, vandalism, or insurance claims at this property in the last 3 years? What carrier currently insures it and at what premium?
- The area grade is low — what's the realistic commute time and amenity access for the typical tenant pool here? Any planned neighborhood developments (good or bad) we should know about?
- What's the average days-on-market for RENTAL listings here right now (not sales)? A rising rental-DOM trend means longer vacancies and softer asking-rent achievability than the comps imply.
- What's the recent tenant-quality profile in this submarket — average credit score on applications, eviction rate, late-payment / NSF rate, and stable-employment percentage? A property-management company in the area should have these aggregated.
- How much new for-sale + rental construction is in the pipeline within 1–3 miles? Heavy new supply typically softens prices + rents 12–24 months out; constrained supply supports both.
Investment metrics
- 1% rule
- 0.81% ✗
- Cap rate
- 6.46%
- Cash-on-cash
- 0.59%
- DSCR
- 1.03
- GRM
- 10.3
CMA / ARV
- ARV (on-the-fly)
- $265,404
- Comps found
- 1
Show comp detail 1 sale within ~0.75 mi
| Address | Dist | Beds/Ba | Sqft | Sold | Price | $/sf | Match |
|---|---|---|---|---|---|---|---|
| 3123 Dupont Ave N | 0.73mi | 2/1.0 (-1) | 1,200 (-8%) | 19mo | $245,000 | $204 | 32 |
Match score weights: distance 35% · size 25% · config 20% · recency 20%. Top-matched comps best support the ARV.
Projected returns pro-forma
-3.0% appreciation · 6.35% rent growth · sell at horizon
- IRR
- -12.0%
- Equity multiple
- 0.55×
- Total profit
- $-28,185
- Equity at exit
- $33,548
- IRR
- 1.1%
- Equity multiple
- 1.09×
- Total profit
- $5,742
- Equity at exit
- $19,454
Cash invested: $63,000 (down + closing). Projections, not guarantees.
Landlord ↔ Tenant lean methodology
- Overall (CITY)
- 34 Tenant-Leaning
- State Minnesota
- 46 Balanced · D+2
- County
- — inherits STATE
- City Minneapolis
- 34 Tenant-Leaning · D+50
ZIP-level market 55412
- Home prices YoY
- -26.9%
- Rents YoY
- 6.3%
- Active inventory
- 169
- Price-to-rent
- 10.3×
Monthly cashflow live
- Estimated rent
- $1,828 high interval (Pro) →
- Mortgage (P&I)
- −$1,180
- Tax from tax record
- −$139 /mo · $1,673/yr
- Insurance
- −$94
- HOA
- −$0
- Vacancy / Maint / Mgmt
- −$384
- Net cashflow
- $31
Break-even live
UW: 25.0% down · 7.5% · 30yr · 1.5% tax · 5.0% vac · 8.0% maint · 8.0% mgmt
Financing live
Cash to close
- Down payment
- $56,250
- Closing costs
- $6,750
- Reserves months
- —
- Total cash needed
- —
Loan-product check · same deal, 3 products live
Conventional
25% down · 7.5% · 30yr
- Down + closing
- —
- Monthly P&I
- —
- Monthly cashflow
- —
- DSCR
- —
- Eligible?
- —
Personal DTI + credit; lowest rate.
DSCR
20% down · 8.5% · 30yr
- Down + closing
- —
- Monthly P&I
- —
- Monthly cashflow
- —
- DSCR
- —
- Eligible?
- —
No personal income docs; deal must DSCR.
Hard money
10% down · 12.0% · 12mo
- Down + closing
- —
- Monthly P&I
- —
- Monthly cashflow
- —
- DSCR
- —
- Eligible?
- —
Short-term bridge; refi at stabilization.
Rent comps 21 comps
| Address | Beds | Baths | Sqft | Rent | $/sqft | DOM | Units | Dist |
|---|---|---|---|---|---|---|---|---|
| 1315 N Dowling Ave Unit 304 Minneapolis, MN | 2.0 | 1.0 | 900 | $1,450 | $1.61 | 4d | 1 | 0.06mi |
| 3315 James Ave N Minneapolis, MN | 4.0 | 1.0 | 1400 | $2,100 | $1.50 | 4d | 1 | 0.55mi |
| 3255 N Logan Ave Unit 2 Minneapolis, MN | 2.0 | 1.0 | 900 | $995 | $1.11 | 17d | 1 | 0.65mi |
| 3105 N Girard Ave Unit 2 Minneapolis, MN | 4.0 | 1.0 | 1250 | $2,300 | $1.84 | 24d | 1 | 0.73mi |
| 4311 Humboldt Ave N Minneapolis, MN | 2.0 | 1.0 | 915 | $1,795 | $1.96 | 43d | 1 | 0.75mi |
| 414 N 33rd Ave Unit 2 Minneapolis, MN | 2.0 | 1.0 | 1246 | $1,600 | $1.28 | 43d | 1 | 0.77mi |
| 3114 Morgan Ave N Minneapolis, MN | 4.0 | 2.0 | 1362 | $2,000 | $1.47 | 14d | 1 | 0.79mi |
| 3211 N 6th St Unit 2 Minneapolis, MN | 4.0 | 1.0 | 900 | $1,450 | $1.61 | 24d | 1 | 0.82mi |
| 2947 Morgan Ave N Minneapolis, MN | 2.0 | 1.0 | 1106 | $1,950 | $1.76 | 14d | 1 | 0.91mi |
| 2900 N Colfax Ave Unit 2 Minneapolis, MN | 2.0 | 1.0 | 1200 | $1,345 | $1.12 | 24d | 1 | 0.96mi |
| 2703 Humboldt Ave N Minneapolis, MN | 3.0 | 1.0 | 1218 | $1,450 | $1.19 | 22d | 1 | 1.04mi |
| 3001 N 3rd St Apt 1 Minneapolis, MN | 2.0 | 1.0 | 900 | $1,250 | $1.39 | 20d | 1 | 1.06mi |
| 2646 Dupont Ave N Unit 2 Minneapolis, MN | 4.0 | 1.0 | 1514 | $2,245 | $1.48 | 43d | 1 | 1.10mi |
| 318 N 27th Ave #2 Minneapolis, MN | 3.0 | 1.0 | 1200 | $1,800 | $1.50 | 43d | 1 | 1.25mi |
| 318 N 27th Ave #2 Minneapolis, MN | 3.0 | 1.0 | 1200 | $1,800 | $1.50 | 4d | 1 | 1.25mi |
| 2330 N Irving Ave Minneapolis, MN | 2.0 | 1.0 | 1600 | $1,375 | $0.86 | 7d | 1 | 1.34mi |
| 2323 26th Ave N Minneapolis, MN | 2.0 | 1.0 | 807 | $1,717 | $2.13 | 14d | 3 | 1.37mi |
| 2324 Logan Ave N Minneapolis, MN | 4.0 | 1.5 | 1400 | $2,300 | $1.64 | 44d | 1 | 1.42mi |
| 1510 N 22nd Ave #1 Minneapolis, MN | 3.0 | 1.0 | 1500 | $1,875 | $1.25 | 22d | 1 | 1.46mi |
| 1510 N 22nd Ave #1 Minneapolis, MN | 3.0 | 1.0 | 1500 | $1,875 | $1.25 | 4d | 1 | 1.46mi |
| 1523 22nd Ave N Minneapolis, MN | 3.0 | 1.0 | 943 | $1,695 | $1.80 | 14d | 1 | 1.49mi |
Listing history 2 events
-
2026-06-17remarks 699-char remark
-
2026-06-17$225,000 Active 1 DOM
ⓘ Source: listings_history table (triggers on properties + properties_extension) + one-shot
backfill from property_details.listing_events for pre-trigger history.
Tax reassessment forecast MN · Partial reset (capped growth)
- Current annual tax
- $1,673 · $139/mo
- Projected year-2 tax
- $2,097 · $175/mo
- Expected delta
- +$423/yr (+$35/mo · 25.3%)
ⓘ Screening estimate from a state-policy table — verify with the county assessor before closing.
Climate risk First Street
- Flood 1/10 Low FEMA zone X (unshaded) · 0% chance over 30 yrs
- Wildfire 1/10 Low
- Heat 2/10 Low 7 d/yr ≥99°F today · 14 d/yr by 30 yrs out
- Wind 2/10 Low
- Air quality 2/10 Low 1 unhealthy d/yr today · 1 by 30 yrs out
Nearby sold comps map
Loading sold comps map…
Walkable amenities ~0.75 mi
Loading nearby amenities…
Taxation est. · year 1
- Rental income
- $21,934
- − Mortgage interest
- −$12,603
- − Property taxes
- −$1,673
- − Insurance
- −$1,125
- − Repairs & maintenance
- −$1,755
- − Management
- −$1,755
- − Depreciation
- −$6,545
- Taxable loss
- −$3,523
- Est. tax savings @ 24.0%
- +$845
- After-tax cash flow
- $1,216/yr
For passive investors: Depreciation is non-cash, so a rental often shows a tax loss while cash-flowing — sheltering income. Rental losses are passive: they offset passive income freely, and up to $25,000/yr can offset ordinary (W-2) income if you actively participate and your MAGI is under $100k (phasing out to $0 by $150k); unused losses carry forward. On sale, claimed depreciation is recaptured at up to 25%, and gains may owe capital-gains tax (a 1031 exchange can defer both). Figures are a year-1 estimate at your 24.0% rate — not tax advice; consult a CPA.
Schools (NCES district)
- District
- Minneapolis Public School District
- NCES district ID
- 2721240
- Math proficiency
- 35% ▼ -7.00%
- Reading proficiency
- 46% ▼ -1.00%
- Median HH income
- $50,521
- Composite
- 34.92/100
- National rank
- #5067
- State rank
- #217 of 301 in MN
Livability — Minneapolis
- Score
- 78/100
- State rank
- #110
- US rank
- #2525
Category grades
Schools grade is shown separately in the Schools card above.
Census & demographics
- Census place
- Minneapolis, MN
- County
- Hennepin County · 1,150,272 people
- City population
- 417,555
- Metro
- Minneapolis-St. Paul-Bloomington, MN-WI
- Population (ZIP)
- 24,460
- Household income
- $68,682
- Rent vs Own
- Severe rent burden
- 913.0
Population outlook (Hennepin County) Hauer SSP2
- Today (2025)
- 1,405,227 people
- By 2030
- 1,492,650 · +6.2%
- By 2040
- 1,660,157 · +18.1%
- By 2050
- 1,823,498 · +29.8%
- By 2075
- 2,221,283 · +58.1%
- By 2100
- 2,509,976 · +78.6%
Race, ethnicity, and origin ACS 2023
- Neighborhood character
- Highly diverse neighborhood (Simpson 0.73)
- Race & ethnicity
- White 36% Black 33% Hispanic / Latino 14% Two or more races 12% Asian 8% Native American 1%
- Hispanic origin (detail)
- Mexican 8%
- Common ancestry
- Portuguese 6% Lithuanian 2% Romanian 1%
- Foreign-born
- 12% · Canada
- Languages at home
- 82% English-only · Spanish 9% Other Asian/Pacific 7% Tagalog/Filipino 1%
Political lean MEDSL · Hennepin
- 2024 margin
- Solid D (+42.6) · D 70.2% · R 27.5% · Other 2.3%
- 2008→2024 swing
- +14.0pp toward D · 2008: 28.6pp · 2024: 42.6pp
- All cycles
- 2024: D+42.6 2020: D+43.2 2016: D+35.3 2012: D+27.1 2008: D+28.6
Not yet ingested
- Civics
- —
Market trends
- HPI YoY
- ▼ -109.98%
- Current HPI
- 298.1414
- Rent YoY
- ▲ 6.35%
- Metro
- Minneapolis-St. Paul-Bloomington, MN-WI
- State GDP YoY
- ▲ 2.41%
- F500 in state
- 34
Industry mix (Fortune 500 HQ in MN)
| Industry | F500 HQs | Revenue |
|---|---|---|
| Healthcare | 2 | $407B |
|
||
| Retail | 2 | $150B |
|
||
| Consumer Goods | 2 | $32B |
|
||
| Industrial Machinery | 2 | $6B |
|
||
| Agriculture | 1 | $40B |
|
||
| Healthcare / Medical Devices | 1 | $32B |
|
||
Price history
+181.6% since first listed31 events — show timeline
- 2026-06-17 Listed $225,000 NORTHSTARMLS as Distributed by MLS Grid
- 2021-03-26 Sold (Public Records) $182,000 Public Records
- 2021-03-19 Sold (MLS) $182,000 NORTHSTARMLS as Distributed by MLS Grid
- 2021-02-18 Pending — NORTHSTARMLS as Distributed by MLS Grid
- 2021-02-12 Contingent — NORTHSTARMLS as Distributed by MLS Grid
- 2021-01-24 Relisted — NORTHSTARMLS as Distributed by MLS Grid
- 2021-01-17 Contingent — NORTHSTARMLS as Distributed by MLS Grid
- 2021-01-06 Listed $185,000 NORTHSTARMLS as Distributed by MLS Grid
- 2021-01-01 Coming Soon $185,000 NORTHSTARMLS as Distributed by MLS Grid
- 2020-11-30 Listing Removed — NORTHSTARMLS as Distributed by MLS Grid
- 2020-09-03 Price Changed $184,900 NORTHSTARMLS as Distributed by MLS Grid
- 2020-08-11 Price Changed $189,900 NORTHSTARMLS as Distributed by MLS Grid
- 2020-07-22 Listed $199,000 NORTHSTARMLS as Distributed by MLS Grid
- 2012-06-14 Sold (Public Records) $77,000 Public Records
- 2011-01-11 Listing Removed — NORTHSTARMLS as Distributed by MLS Grid
- 2010-10-26 Listed $84,000 NORTHSTARMLS as Distributed by MLS Grid
- 2010-07-13 Sold (Public Records) $793,250 Public Records
- 2010-07-13 Sold (Public Records) $793,250 Public Records
- 2010-03-15 Sold (Public Records) $30,165 Public Records
- 2007-10-22 Sold (MLS) $69,000 NORTHSTARMLS as Distributed by MLS Grid
- 2007-10-03 Listing Removed — NORTHSTARMLS as Distributed by MLS Grid
- 2007-04-11 Listed $84,900 NORTHSTARMLS as Distributed by MLS Grid
- 2007-04-05 Listing Removed — NORTHSTARMLS as Distributed by MLS Grid
- 2006-10-04 Listed $129,900 NORTHSTARMLS as Distributed by MLS Grid
- 2005-10-10 Sold (Public Records) $165,000 Public Records
- 2005-09-12 Listing Removed — NORTHSTARMLS as Distributed by MLS Grid
- 2005-09-06 Sold (MLS) $165,000 NORTHSTARMLS as Distributed by MLS Grid
- 2005-08-04 Listed $162,900 NORTHSTARMLS as Distributed by MLS Grid
- 2003-09-30 Sold (MLS) $80,000 NORTHSTARMLS as Distributed by MLS Grid
- 2003-09-11 Listing Removed — NORTHSTARMLS as Distributed by MLS Grid
- 2003-09-10 Listed $79,900 NORTHSTARMLS as Distributed by MLS Grid
Property tax history
+0.1%/yrLatest (2025): $1,673 · +5.9% YoY. Source: county tax records.
Cash-flow waterfall
monthlySold comps — $/sqft
last 12 mo · ≤1 miLoading sold comps…