 🏷️ Likely Rental
3 Jennifer Ln · West Stockbridge, MA
Flood risk No data
- FEMA flood zone
- —
- Chance of flooding over 30 yrs
- —
- Est. flood insurance / yr
- —
Fire risk No data
- Est. fire insurance / yr
- —
Heat risk 3/10 · Minor
- Hot days now (above threshold)
- 7 days/yr
- Hot days in 30 yrs
- 17 days/yr
Wind risk No data
- Chance of severe wind over 30 yrs
- —
Air-quality risk 2/10 · Minimal
- Unhealthy air days now
- 1 days/yr
- Unhealthy air days in 30 yrs
- 1 days/yr
Risk factors via First Street. Map © Google.
Why this score? — see what drove the A- grade
The composite is a weighted blend of 9 inputs, each scored 0–100. Each bar is that input's sub-score; the figure is the points it added to the 100-point composite (weight × sub-score).
- Cash flow +30.0/30.0
- ARV discount +15.0/15.0
- 1% rule +10.0/10.0
- DSCR +10.0/10.0
- Appreciation +6.4/10.0
- Condition / age +4.0/5.0
- Schools +3.6/10.0
- Rent growth +2.5/5.0
- Livability +2.5/5.0
$69,500
🖨 Deal sheet 📄 Offer letter ✓ Due diligence
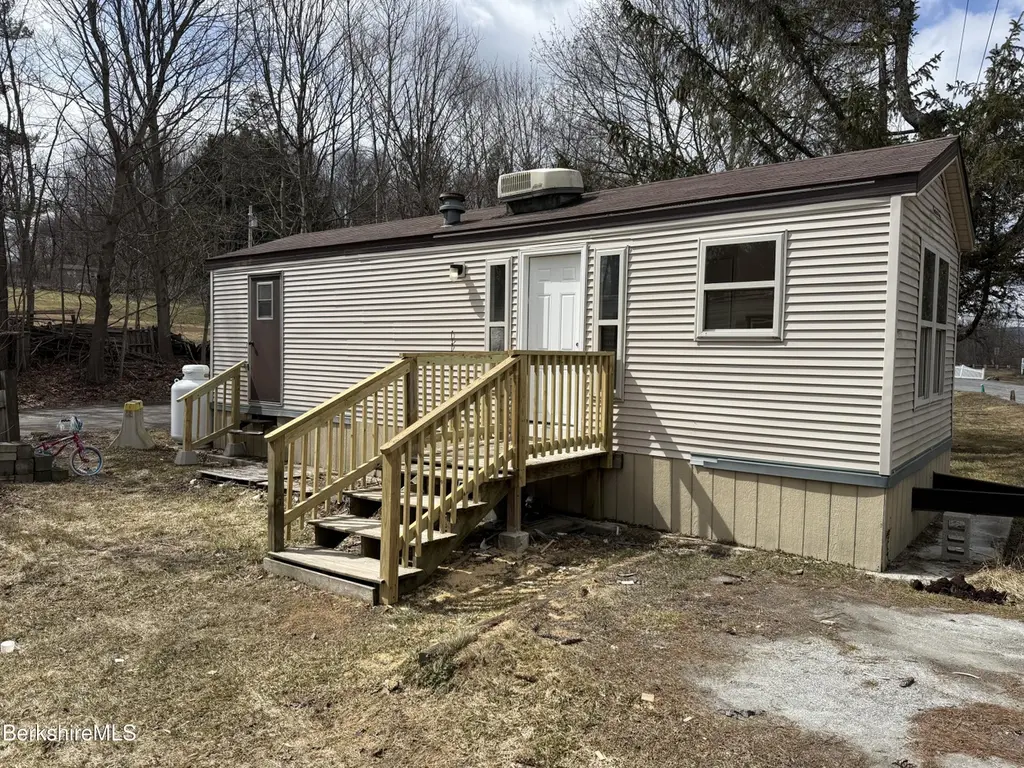
Listing remarks MLS
Nicely remodeled 2 bedroom trailer with fireplace and 2 baths. Park rent is $399.56 per month.
Key facts
- 2 parking spots
- Built 1993
- Listed 98 days
Neighborhood map
What this means for you Summary
Snapshot
- This is a 2-bed/1.0-bath manufactured listed at $70k. Condition is rated good.
Deal economics
- At list price, monthly cash flow is $1k ($17k/yr) — positive.
- The deal already cash-flows at list — no discount required.
- Meets the 1% rule at list price ($2k rent vs $70k).
- Recommended offer: $63k (9.0% below list) — sets the bar for market timing.
Location & tenants
- Location reads: area grade A — affects rentability + tenant quality, not the cash-flow math above.
- Berkshire Hills (rural): math 33% / reading 49% proficiency, ranked #197 of 302 in MA (top 65%) — families likely to look elsewhere, expect single-tenant / working-renter base with shorter leases.
- Market conditions: 31 active listings in the ZIP; 130 units permitted in Berkshire County in 2024 (10 in 5+ unit buildings).
Forward outlook
- In year one you build about $2k of equity ($481 loan paydown + $2k appreciation (2.7% local appreciation)).
- Berkshire County population projected at -24% by 2050 — secular population decline; favor cash flow + early exit over multi-decade hold.
- At projected returns (2.7% appreciation + 3.0% rent growth), your $19k cash investment doubles in ~1 year — after that, you're playing with house money.
Negotiation context
- It's been on market 98 days — a 9% lower offer ($63k) is reasonable based on typical stale-listing flexibility.
Questions for the listing agent
- It's been on market 98 days. Have you received any prior offers? Is the seller open to a 9% concession, seller financing, or rate buy-down credit?
- Why hasn't it sold? Are there any deal-killer items the seller is aware of (foundation, flood, title, zoning, code violations)?
- Is there a deadline driving the sale (1031 exchange, divorce, estate, relocation)? That informs how much negotiation room exists.
- What's the average days-on-market for RENTAL listings here right now (not sales)? A rising rental-DOM trend means longer vacancies and softer asking-rent achievability than the comps imply.
- What's the recent tenant-quality profile in this submarket — average credit score on applications, eviction rate, late-payment / NSF rate, and stable-employment percentage? A property-management company in the area should have these aggregated.
- How much new for-sale + rental construction is in the pipeline within 1–3 miles? Heavy new supply typically softens prices + rents 12–24 months out; constrained supply supports both.
Investment metrics
- 1% rule
- 3.47% ✓
- Cap rate
- 30.90%
- Cash-on-cash
- 87.90%
- DSCR
- 4.91
- GRM
- 2.4
CMA / ARV
- ARV (median comp)
- $100,058
- List price
- $69,500
- Delta
- -30.54%
- Verdict
- UNDERPRICED
- Comps
- 1 within 2.0 mi
Projected returns pro-forma
2.71% appreciation · 3.0% rent growth · sell at horizon
- IRR
- 92.0%
- Equity multiple
- 6.04×
- Total profit
- $98,121
- Equity at exit
- $30,112
- IRR
- 91.8%
- Equity multiple
- 12.48×
- Total profit
- $223,481
- Equity at exit
- $45,539
Cash invested: $19,460 (down + closing). Projections, not guarantees.
Landlord ↔ Tenant lean methodology
- Overall (STATE)
- 20 Strongly Tenant-Friendly
- State Massachusetts
- 20 Strongly Tenant-Friendly · D+15
- County
- — inherits STATE
- City
- — inherits STATE
ZIP-level market 01266
- Home prices YoY
- 0.8%
- Active inventory
- 31
- Price-to-rent
- 2.4×
Monthly cashflow live
- Estimated rent
- $2,412 medium interval (Pro) →
- Mortgage (P&I)
- −$364
- Tax est. 1.5%
- −$87 /mo · $1,042/yr
- Insurance
- −$29
- HOA
- −$0
- Vacancy / Maint / Mgmt
- −$507
- Net cashflow
- $1,425
Break-even live
UW: 25.0% down · 7.5% · 30yr · 1.5% tax · 5.0% vac · 8.0% maint · 8.0% mgmt
Financing live
Cash to close
- Down payment
- $17,375
- Closing costs
- $2,085
- Reserves months
- —
- Total cash needed
- —
Loan-product check · same deal, 3 products live
Conventional
25% down · 7.5% · 30yr
- Down + closing
- —
- Monthly P&I
- —
- Monthly cashflow
- —
- DSCR
- —
- Eligible?
- —
Personal DTI + credit; lowest rate.
DSCR
20% down · 8.5% · 30yr
- Down + closing
- —
- Monthly P&I
- —
- Monthly cashflow
- —
- DSCR
- —
- Eligible?
- —
No personal income docs; deal must DSCR.
Hard money
10% down · 12.0% · 12mo
- Down + closing
- —
- Monthly P&I
- —
- Monthly cashflow
- —
- DSCR
- —
- Eligible?
- —
Short-term bridge; refi at stabilization.
Listing history 16 events
-
2026-06-18days on market $69,500 Active 98 DOM
-
2026-06-17days on market $69,500 Active 97 DOM
-
2026-06-16days on market $69,500 Active 96 DOM
-
2026-06-15days on market $69,500 Active 95 DOM
-
2026-06-13days on market $69,500 Active 93 DOM
-
2026-06-12days on market $69,500 Active 92 DOM
-
2026-06-09days on market $69,500 Active 89 DOM
-
2026-06-08days on market $69,500 Active 88 DOM
-
2026-06-07days on market $69,500 Active 87 DOM
-
2026-06-07days on market $69,500 Active 86 DOM
-
2026-06-04days on market $69,500 Active 83 DOM
-
2026-06-02days on market $69,500 Active 82 DOM
-
2026-06-01days on market $69,500 Active 81 DOM
-
2026-05-31days on market $69,500 Active 80 DOM
-
2026-05-31days on market $69,500 Active 79 DOM
-
2026-03-12$79,900 Active 94-char remark
Show marketing remark (94 chars)
Nicely remodeled 2 bedroom trailer with fireplace and 2 baths. Park rent is $399.56 per month.
ⓘ Source: listings_history table (triggers on properties + properties_extension) + one-shot
backfill from property_details.listing_events for pre-trigger history.
Climate risk First Street
- Heat 3/10 Moderate
- Air quality 2/10 Low 1 unhealthy d/yr today · 1 by 30 yrs out
Nearby sold comps map
Loading sold comps map…
Walkable amenities ~0.75 mi
Loading nearby amenities…
Taxation est. · year 1
- Rental income
- $28,947
- − Mortgage interest
- −$3,893
- − Property taxes
- −$1,042
- − Insurance
- −$348
- − Repairs & maintenance
- −$2,316
- − Management
- −$2,316
- − Depreciation
- −$2,022
- Taxable income
- $17,011
- Est. tax owed @ 24.0%
- −$4,083
- After-tax cash flow
- $13,022/yr
For passive investors: Depreciation is non-cash, so a rental often shows a tax loss while cash-flowing — sheltering income. Rental losses are passive: they offset passive income freely, and up to $25,000/yr can offset ordinary (W-2) income if you actively participate and your MAGI is under $100k (phasing out to $0 by $150k); unused losses carry forward. On sale, claimed depreciation is recaptured at up to 25%, and gains may owe capital-gains tax (a 1031 exchange can defer both). Figures are a year-1 estimate at your 24.0% rate — not tax advice; consult a CPA.
Condition & rehab AI · 10 photos
This remodeled mobile home is in good condition with minimal repairs needed. Painting the exterior and improving landscaping would significantly enhance its curb appeal and value.
Value-add opportunities
- Both Paint exterior siding — Enhances curb appeal and value
- Both Trim and mulch landscaping — Improves curb appeal and enhances property value
Renovation cost estimate screening
Value-add ROI direction
- Both Paint exterior siding — Enhances curb appeal and value ↑
- Both Trim and mulch landscaping — Improves curb appeal and enhances property value ↑
ⓘ Cost ranges are severity-bucket heuristics (US national rule-of-thumb). Get contractor quotes + a written scope before underwriting a rehab budget.
Schools (NCES district)
- District
- Berkshire Hills
- NCES district ID
- 2502530
- Math proficiency
- 33% ▼ -14.00%
- Reading proficiency
- 49% ▼ -5.00%
- Median HH income
- $54,413
- Composite
- 35.69/100
- National rank
- #4868
- State rank
- #197 of 302 in MA
Livability — West Stockbridge
No livability data for this city. (Only ~50 U.S. cities are tracked.)
Census & demographics
- Population (ZIP)
- 919
Population outlook (Berkshire County) Hauer SSP2
- Today (2025)
- 119,723 people
- By 2030
- 114,608 · -4.3%
- By 2040
- 102,806 · -14.1%
- By 2050
- 91,305 · -23.7%
- By 2075
- 71,517 · -40.3%
- By 2100
- 57,988 · -51.6%
Race, ethnicity, and origin ACS 2023
- Neighborhood character
- Predominantly White (92%)
- Race & ethnicity
- White 92% Hispanic / Latino 4% Native American 2% Two or more races 2% Asian 1%
- Common ancestry
- Lithuanian 8% Scotch-Irish 4% Slovak 4%
- Foreign-born
- 8% · Canada, China
- Languages at home
- 90% English-only · Spanish 5% French/Haitian/Cajun 1% Other Indo-European 1%
Political lean MEDSL · Berkshire
- 2024 margin
- Solid D (+39.9) · D 68.9% · R 29.0% · Other 2.1%
- 2008→2024 swing
- -12.5pp toward R · 2008: 52.4pp · 2024: 39.9pp
- All cycles
- 2024: D+39.9 2020: D+47.1 2016: D+41.5 2012: D+53.7 2008: D+52.4
Not yet ingested
- Civics
- —
Market trends
- HPI YoY
- ▲ 2.71%
- Current HPI
- 324.1646
- Rent YoY
- —
- Metro
- —
- State GDP YoY
- ▲ 2.28%
- F500 in state
- 38
Industry mix (Fortune 500 HQ in MA)
| Industry | F500 HQs | Revenue |
|---|---|---|
| Technology | 3 | $17B |
|
||
| Insurance | 2 | $84B |
|
||
| Retail | 2 | $76B |
|
||
| Life Sciences | 1 | $43B |
|
||
| Energy Technology | 1 | $31B |
|
||
| Aerospace / Defense | 1 | $18B |
|
||
Price history
1 event — show timeline
- 2026-03-12 Listed $79,900 BCMLS
Cash-flow waterfall
monthlySold comps — $/sqft
last 12 mo · ≤1 miLoading sold comps…