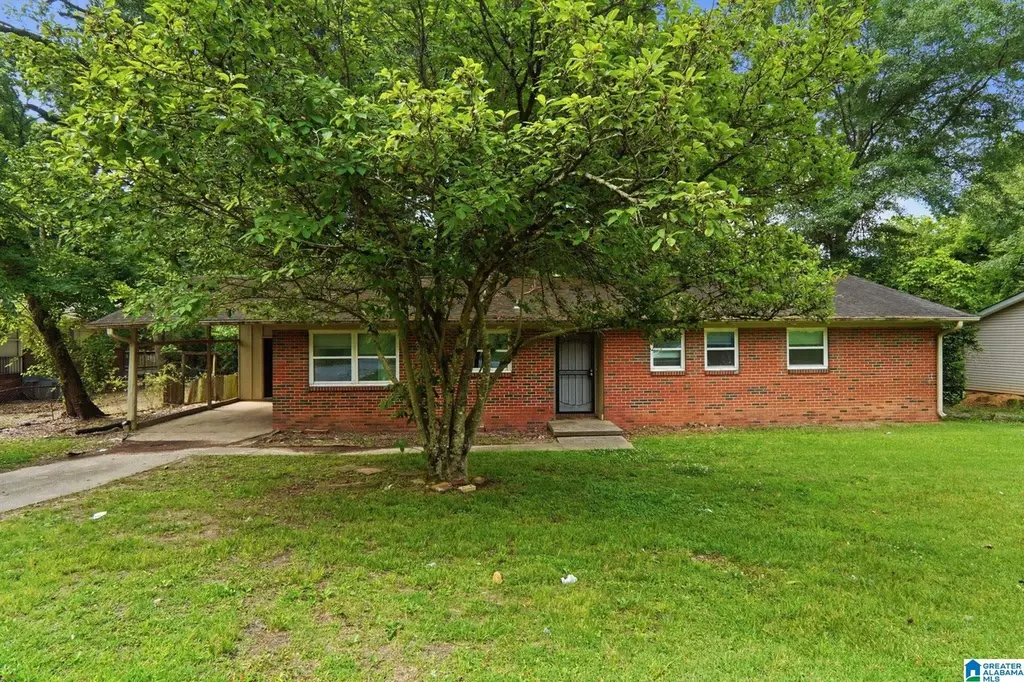
409 16th Ave NW · Center Point, AL
Flood risk 8/10 · Major
- FEMA flood zone
- X (unshaded)
- Chance of flooding over 30 yrs
- 0.99%
- Est. flood insurance / yr
- $507 – $1,088
Fire risk 3/10 · Minor
- Est. fire insurance / yr
- $916 – $1,700
Heat risk 6/10 · Moderate
- Hot days now (above 106°F)
- 7 days/yr
- Hot days in 30 yrs
- 19 days/yr
Wind risk 6/10 · Moderate
- Chance of severe wind over 30 yrs
- 27.0%
Air-quality risk 5/10 · Moderate
- Unhealthy air days now
- 7 days/yr
- Unhealthy air days in 30 yrs
- 9 days/yr
Risk factors via First Street. Map © Google.
Why this score? — see what drove the B grade
The composite is a weighted blend of 9 inputs, each scored 0–100. Each bar is that input's sub-score; the figure is the points it added to the 100-point composite (weight × sub-score).
- Cash flow +28.8/30.0
- ARV discount +15.0/15.0
- DSCR +10.0/10.0
- 1% rule +7.9/10.0
- Rent growth +3.3/5.0
- Livability +3.2/5.0
- Condition / age +2.5/5.0
- Schools +1.8/10.0
- Appreciation +0.0/10.0
$103,900
🖨 Deal sheet (PDF) 📄 Offer letter ✓ Due diligence
Listing remarks
Don’t miss this inviting 1-story home featuring 3 bedrooms, 1.5 bathrooms, and a 1-car carport with a comfortable layout designed for everyday living. The main living area offers a welcoming space for relaxing or entertaining, while the kitchen provides everyday functionality with easy flow to the dining area. The bedrooms offer flexible space for guests, a home office, or hobbies.
Key facts
- 0.28 acre lot
- Parking
- Built 1959
Property features AI
Exterior
- Parking: Attached parking; One carport space
- Utilities: Public water; Electric water heater; Underground utilities; Internet service available
- Home design: 4-side brick construction; Existing (previously built) property; Crawl space foundation; Subdivision: Bridlewood Forest
- Construction: 4-side brick exterior; Crawl space foundation
- Exterior features: No pool; No patio; No decks; No garden/patio; Not waterfront
Interior
- Kitchen: Laminate countertops; Electric oven; Refrigerator
- Bedrooms: Master bedroom on main level (approx. 15 x 11); Bedroom on main level (approx. 14 x 11); Bedroom on main level (approx. 12 x 11)
- Flooring: Vinyl
- Bathrooms: One full bath with tub/shower combo; One half bath
- Heating & cooling: Central heating; Central cooling
- Interior features: Vinyl flooring; Ceilings: other (see remarks); No additional interior features listed
- Laundry & utility: Washer hookup; Electric dryer hookup; Laundry located on the main level (laundry space: other — see remarks)
Neighborhood map
What this means for you Summary
Snapshot
- This is a 3-bed/1.5-bath single-family listed at $104k.
Deal economics
- At list price, monthly cash flow is $283 ($3k/yr) — positive.
- The deal already cash-flows at list — no discount required.
- Meets the 1% rule at list price ($1k rent vs $104k).
- Recommended offer: $102k (1.5% below list) — sets the bar for market timing.
- Cap rate 10.3% vs local median 7.2% in Center Point — top-decile yield for the area; either an underpriced asset or a hidden risk that comps aren't pricing in. Stress-test before assuming the spread holds.
Location & tenants
- Location reads 63/100 on livability (#193 in AL) — a middle-class / working-renter tenant base. Strengths: cost of living A+, commute A, housing A; Watch: crime D, amenities F, employment F.
- Jefferson County (suburban): math 9% / reading 32% proficiency, ranked #104 of 129 in AL (top 81%) — low school quality limits family demand, transient renter base, plan for 1-2y turnover.
- Zoned schools: Center Point Elementary School (618 students, 82% FRL); Erwin Middle School (math 2% / reading 17%, grade F, #233 of 257 statewide, top 91%, 617 students, 94% FRL); Center Point High School (math 2% / reading 2%, grade F, #291 of 305 statewide, top 100%, 774 students, 91% FRL) — zoned schools average 89% FRL vs 49% district-wide (40 pts higher); higher-poverty schools than district average — tighter screening recommended.
- Zoned-school proficiency averages 6% at this address vs 20% district-wide (-14 pts) — the specific schools serving this property underperform the Jefferson County average; the district grade overstates school quality for this exact location.
- Market conditions: Rents rising (+3.0%/yr); 336 active listings in the ZIP; 40 comparable units currently listed for rent nearby; rentals at typical pace (median 25d on market — plan ~3-4 weeks tenant-placement turnaround); 40% of comp listings sitting > 30 days — soft ceiling on asking rent; 2,114 units permitted in Jefferson County in 2024 (556 in 5+ unit buildings).
- This rent runs 30% of the median local income ($53k/yr) — at the standard rent-burdened threshold; future hikes will face affordability resistance.
Forward outlook
- Local home prices are declining (-3.0%/yr); year-one equity from $718 of loan paydown is wiped out by about $3k of value loss. Plan a longer hold.
- Jefferson County population projected to shrink 4% by 2050 — rents likely to lag national; underwrite the cash flow, not the appreciation.
- At projected returns (-3.0% appreciation + 3.0% rent growth), your $29k cash investment doubles in ~10 years — after that, you're playing with house money.
Negotiation context
- It's been on market 24 days — a 2% lower offer ($102k) is reasonable based on typical stale-listing flexibility.
Risks & watch-outs
- Watch-outs: flood insurance adds $66/mo; built in 1959 — expect roof / HVAC / electrical / plumbing capex.
- Climate carrying-cost: severe flood risk; major wind risk, 27% chance of damaging wind over 30y; extreme-heat days projected 7→19/yr by 2055 (HVAC capex compounding) — expect insurance premiums to compound above CPI over the hold.
Questions for the listing agent
- Built in 1959 — when were the roof, HVAC, electrical panel, plumbing, and water heater last replaced?
- What's the actual annual flood-insurance premium (NFIP or private), and is the property in a SFHA with mandatory coverage?
- Is there a deadline driving the sale (1031 exchange, divorce, estate, relocation)? That informs how much negotiation room exists.
- Schools are F-rated, which usually means shorter tenancies and higher turnover. Who's the typical renter profile here, and what's been the actual vacancy rate?
- Crime grade is D in this area — have there been break-ins, vandalism, or insurance claims at this property in the last 3 years? What carrier currently insures it and at what premium?
- What's the average days-on-market for RENTAL listings here right now (not sales)? A rising rental-DOM trend means longer vacancies and softer asking-rent achievability than the comps imply.
- What's the recent tenant-quality profile in this submarket — average credit score on applications, eviction rate, late-payment / NSF rate, and stable-employment percentage? A property-management company in the area should have these aggregated.
- How much new for-sale + rental construction is in the pipeline within 1–3 miles? Heavy new supply typically softens prices + rents 12–24 months out; constrained supply supports both.
Investment metrics
- 1% rule
- 1.29% ✓
- Cap rate
- 10.33%
- Cash-on-cash
- 14.41%
- DSCR
- 1.64
- GRM
- 6.5
CMA / ARV
- ARV (on-the-fly)
- $130,174
- Comps found
- 12
Show comp detail 12 sales within ~0.75 mi
| Address | Dist | Beds/Ba | Sqft | Sold | Price | $/sf | Match |
|---|---|---|---|---|---|---|---|
| 1409 4th Pl NW | 0.32mi | 3/2.0 | 1,363 (+2%) | 2mo | $192,000 | $141 | 79 |
| 512 15th Ave NW | 0.33mi | 3/1.5 | 1,447 (+8%) | 2mo | $140,000 | $97 | 70 |
| 512 16th Ter NW | 0.30mi | 3/2.0 | 1,225 (-9%) | 1mo | $183,000 | $149 | 69 |
| 1401 4th Way NW | 0.36mi | 4/2.5 (+1) | 1,380 (+3%) | 4mo | $147,000 | $107 | 66 |
| 1360 5th Pl NW | 0.40mi | 3/1.0 | 1,220 (-9%) | 1mo | $92,500 | $76 | 63 |
| 432 13th Ave NW | 0.59mi | 4/1.0 (+1) | 1,346 (+0%) | 4mo | $35,100 | $26 | 61 |
| 1712 4th Pl NW | 0.33mi | 3/1.0 | 1,182 (-12%) | 3mo | $90,000 | $76 | 60 |
| 1640 4th Way NW | 0.22mi | 3/1.0 | 1,144 (-15%) | 4mo | $149,900 | $131 | 60 |
| 348 17th Ave NW | 0.35mi | 4/2.0 (+1) | 1,456 (+8%) | 4mo | $175,000 | $120 | 59 |
| 1705 Lake Park Cir | 0.72mi | 2/2.0 (-1) | 1,339 (-0%) | 1mo | $125,000 | $93 | 58 |
| 437 Wedgeworth Rd | 0.75mi | 2/1.5 (-1) | 1,407 (+5%) | 2mo | $114,900 | $82 | 50 |
| 112 19th Ave NW | 0.71mi | 3/1.5 | 1,142 (-15%) | 2mo | $108,500 | $95 | 41 |
Match score weights: distance 35% · size 25% · config 20% · recency 20%. Top-matched comps best support the ARV.
Projected returns pro-forma
-3.0% appreciation · 3.04% rent growth · sell at horizon
- IRR
- 1.2%
- Equity multiple
- 1.04×
- Total profit
- $1,291
- Equity at exit
- $15,492
- IRR
- 10.9%
- Equity multiple
- 1.85×
- Total profit
- $24,765
- Equity at exit
- $8,983
Cash invested: $29,092 (down + closing). Projections, not guarantees.
Landlord ↔ Tenant lean methodology
- Overall (STATE)
- 90 Strongly Landlord-Friendly
- State Alabama
- 90 Strongly Landlord-Friendly · R+15
- County
- — inherits STATE
- City
- — inherits STATE
ZIP-level market 35215
- Home prices YoY
- -34.4%
- Rents YoY
- 3.0%
- Active inventory
- 336
- Price-to-rent
- 6.5×
Monthly cashflow live
- Estimated rent
- $1,335 high interval (Pro) →
- Mortgage (P&I)
- −$545
- Tax from tax record
- −$117 /mo · $1,407/yr
- Insurance
- −$43
- Flood insurance flood zone
- −$66 /mo · $798/yr
- HOA
- −$0
- Vacancy / Maint / Mgmt
- −$280
- Net cashflow
- $283
Break-even live
Sensitivity live
| Price | -10% $342 | -5% $312 | +0% $283 | +5% $254 | +10% $224 |
|---|---|---|---|---|---|
| Rent | -10% $177 | -5% $230 | +0% $283 | +5% $336 | +10% $388 |
| Rate | -1.0pp $335 | -0.5pp $309 | base $283 | +0.5pp $256 | +1.0pp $229 |
UW: 25.0% down · 7.5% · 30yr · 1.5% tax · 5.0% vac · 8.0% maint · 8.0% mgmt
Financing live
Cash to close
- Down payment
- $25,975
- Closing costs
- $3,117
- Reserves months
- —
- Total cash needed
- —
Loan-product check · same deal, 3 products live
Conventional
25% down · 7.5% · 30yr
- Down + closing
- —
- Monthly P&I
- —
- Monthly cashflow
- —
- DSCR
- —
- Eligible?
- —
Personal DTI + credit; lowest rate.
DSCR
20% down · 8.5% · 30yr
- Down + closing
- —
- Monthly P&I
- —
- Monthly cashflow
- —
- DSCR
- —
- Eligible?
- —
No personal income docs; deal must DSCR.
Hard money
10% down · 12.0% · 12mo
- Down + closing
- —
- Monthly P&I
- —
- Monthly cashflow
- —
- DSCR
- —
- Eligible?
- —
Short-term bridge; refi at stabilization.
Rent comps 40 comps
| Address | Beds | Baths | Sqft | Rent | $/sqft | DOM | Units | Dist |
|---|---|---|---|---|---|---|---|---|
| 428 15th Ter NW Center Point, AL | 3.0 | 2.0 | 1528 | $1,795 | $1.17 | 4d | 1 | 0.05mi |
| 434 15th Ter NW Center Point, AL | 3.0 | 2.0 | 1053 | $1,200 | $1.14 | 45d | 1 | 0.08mi |
| 1617 3rd Pl NW Center Point, AL | 3.0 | 2.0 | 1404 | $1,150 | $0.82 | 25d | 1 | 0.14mi |
| 1612 Glenwood St NW Center Point, AL | 4.0 | 3.0 | 1344 | $1,480 | $1.10 | 25d | 1 | 0.26mi |
| 1700 4th Pl NW Center Point, AL | 3.0 | 1.0 | 914 | $1,075 | $1.18 | 25d | 1 | 0.29mi |
| 500 15th Ave NW Center Point, AL | 3.0 | 1.0 | 1079 | $1,050 | $0.97 | 4d | 1 | 0.30mi |
| 1712 4th Pl NW Center Point, AL | 3.0 | 1.0 | 1182 | $1,150 | $0.97 | 25d | 1 | 0.31mi |
| 405 18th Ave NW Center Point, AL | 3.0 | 2.0 | 1162 | $1,299 | $1.12 | 45d | 1 | 0.40mi |
| 1356 5th Pl NW Center Point, AL | 3.0 | 1.0 | 1064 | $1,105 | $1.04 | 45d | 1 | 0.43mi |
| 1628 1st St NW Center Point, AL | 3.0 | 1.0 | 1124 | $1,150 | $1.02 | 45d | 1 | 0.45mi |
| 324 13th Ter NW Center Point, AL | 3.0 | 1.5 | 1418 | $1,295 | $0.91 | 25d | 1 | 0.45mi |
| 1333 5th Pl NW Center Point, AL | 3.0 | 2.0 | 1056 | $1,275 | $1.21 | 45d | 1 | 0.47mi |
| 1629 1st St NW Center Point, AL | 3.0 | 1.0 | 900 | $1,025 | $1.14 | 25d | 1 | 0.48mi |
| 1732 6th St NW Center Point, AL | 3.0 | 1.5 | 1300 | $1,250 | $0.96 | 4d | 1 | 0.49mi |
| 621 15th Ave NW Birmingham, AL | 4.0 | 2.0 | 1070 | $1,200 | $1.12 | 17d | 1 | 0.50mi |
| 1736 6th St NW Center Point, AL | 4.0 | 2.0 | 1830 | $1,550 | $0.85 | 45d | 1 | 0.51mi |
| 1328 5th Pl NW Center Point, AL | 3.0 | 1.0 | 1250 | $1,050 | $0.84 | 17d | 1 | 0.51mi |
| 405 13th Ct NW Center Point, AL | 4.0 | 1.5 | 1248 | $1,415 | $1.13 | 23d | 1 | 0.52mi |
| 305 18th Ct NW Center Point, AL | 3.0 | 1.5 | 1270 | $1,100 | $0.87 | 45d | 1 | 0.54mi |
| 1305 5th Pl NW Center Point, AL | 3.0 | 2.0 | 1092 | $1,200 | $1.10 | 45d | 1 | 0.56mi |
| 400 13th Ave NW Birmingham, AL | 2.0 | 1.0 | 1100 | $890 | $0.81 | 45d | 1 | 0.57mi |
| 1301 5th Pl NW Center Point, AL | 3.0 | 1.0 | 1170 | $1,100 | $0.94 | 5d | 1 | 0.58mi |
| 1541 Charter East Cir NE Birmingham, AL | 1.0–2.0 | 1.0–1.5 | 807 | $1,095 | $1.36 | 3d | 8 | 0.60mi |
| 1237 Linwood St Birmingham, AL | 3.0 | 1.5 | 1066 | $995 | $0.93 | 45d | 1 | 0.60mi |
| 108 13th Ave NW Center Point, AL | 4.0 | 2.0 | 1444 | $1,265 | $0.88 | 25d | 1 | 0.60mi |
| 1628 1st St NE Center Point, AL | 3.0 | 1.0 | 1027 | $1,165 | $1.13 | 45d | 1 | 0.61mi |
| 1232 Oakwood St Birmingham, AL | 3.0 | 1.5 | 1301 | $1,223 | $0.94 | 25d | 1 | 0.62mi |
| 1225 Birchwood St Birmingham, AL | 3.0 | 2.0 | 1092 | $1,175 | $1.08 | 5d | 1 | 0.63mi |
| 113 19th Ave NW Center Point, AL | 3.0 | 2.0 | 1407 | $1,250 | $0.89 | 13d | 1 | 0.68mi |
| 1905 2nd St NW Center Point, AL | 3.0 | 1.0 | 1258 | $1,395 | $1.11 | 45d | 1 | 0.69mi |
| 1153 Linwood St Birmingham, AL | 3.0 | 2.0 | 1250 | $1,295 | $1.04 | 4d | 1 | 0.74mi |
| 1827 Carson Rd Unit 7 Birmingham, AL | 3.0 | 2.5 | 1332 | $950 | $0.71 | 25d | 1 | 0.74mi |
| 1827 Carson Rd Unit 1 Birmingham, AL | 3.0 | 2.5 | 1332 | $1,125 | $0.84 | 45d | 1 | 0.74mi |
| 107 Sterling Ct NW Center Point, AL | 2.0 | 1.5–2.0 | 1026 | $1,062 | $1.04 | 4d | 4 | 0.76mi |
| 457 Tupelo Way Center Point, AL | 3.0 | 1.0 | 1658 | $995 | $0.60 | 23d | 1 | 0.78mi |
| 1259 Huffman Rd Center Point, AL | 3.0 | 2.0 | 1662 | $1,556 | $0.94 | 45d | 1 | 0.79mi |
| 617 Carson Crest Cir Birmingham, AL | 4.0 | 2.0 | 1528 | $1,723 | $1.13 | 17d | 1 | 0.80mi |
| 424 Tupelo Way Center Point, AL | 4.0 | 2.0 | 1233 | $1,300 | $1.05 | 45d | 1 | 0.82mi |
| 1720 2nd St NE Center Point, AL | 3.0 | 2.0 | 1100 | $1,400 | $1.27 | 45d | 1 | 0.83mi |
| 769 15th Ct NW Birmingham, AL | 3.0 | 1.5 | 1130 | $1,310 | $1.16 | 13d | 1 | 0.88mi |
Listing history 16 events
-
2026-06-15status $103,900 Pending 24 DOM
-
2026-06-15days on market $103,900 Active 24 DOM
-
2026-06-13days on market $103,900 Active 22 DOM
-
2026-06-10days on market $103,900 Active 19 DOM
-
2026-06-09days on market $103,900 Active 18 DOM
-
2026-06-08days on market $103,900 Active 17 DOM
-
2026-06-07days on market $103,900 Active 16 DOM
-
2026-06-03days on market $103,900 Active 12 DOM
-
2026-06-02days on market $103,900 Active 11 DOM
-
2026-06-01days on market $103,900 Active 10 DOM
-
2026-05-31days on market $103,900 Active 9 DOM
-
2026-05-22$103,900 Active
-
2022-03-21price $1,150
-
2022-03-17price $1,150
-
2021-05-18soldstatus $7,237,964
-
1978-12-08soldstatus $31,500
ⓘ Source: listings_history table (triggers on properties + properties_extension) + one-shot
backfill from property_details.listing_events for pre-trigger history.
Tax reassessment forecast AL · Resets to sale price
- Current annual tax
- $1,407 · $117/mo
- Projected year-2 tax
- $1,407 · $117/mo
- Expected delta
- $0/yr ($0/mo · 0.0%)
ⓘ Screening estimate from a state-policy table — verify with the county assessor before closing.
Climate risk First Street
- Flood 8/10 Severe FEMA zone X (unshaded) · 99% chance over 30 yrs
- Wildfire 3/10 Moderate
- Heat 6/10 Major 7 d/yr ≥106°F today · 19 d/yr by 30 yrs out
- Wind 6/10 Major 27% chance of damaging wind over 30 yrs
- Air quality 5/10 Major 7 unhealthy d/yr today · 9 by 30 yrs out
Nearby sold comps map
Loading sold comps map…
Walkable amenities ~0.75 mi
Loading nearby amenities…
Taxation est. · year 1
- Rental income
- $16,023
- − Mortgage interest
- −$5,820
- − Property taxes
- −$1,407
- − Insurance
- −$1,317
- − Repairs & maintenance
- −$1,282
- − Management
- −$1,282
- − Depreciation
- −$3,023
- Taxable income
- $1,892
- Est. tax owed @ 24.0%
- −$454
- After-tax cash flow
- $2,941/yr
For passive investors: Depreciation is non-cash, so a rental often shows a tax loss while cash-flowing — sheltering income. Rental losses are passive: they offset passive income freely, and up to $25,000/yr can offset ordinary (W-2) income if you actively participate and your MAGI is under $100k (phasing out to $0 by $150k); unused losses carry forward. On sale, claimed depreciation is recaptured at up to 25%, and gains may owe capital-gains tax (a 1031 exchange can defer both). Figures are a year-1 estimate at your 24.0% rate — not tax advice; consult a CPA.
Schools (NCES district)
- District
- Jefferson County
- NCES district ID
- 0101920
- Math proficiency
- 9% ▼ -24.00%
- Reading proficiency
- 32% ▼ -5.00%
- Median HH income
- $51,712
- Composite
- 18.4/100
- National rank
- #8937
- State rank
- #104 of 129 in AL
Livability — Center Point
- Score
- 63/100
- State rank
- #193
- US rank
- #15671
Category grades
Schools grade is shown separately in the Schools card above.
Census & demographics
- Census place
- Center Point, AL
- County
- Jefferson County · 527,445 people
- City population
- 210,422
- Metro
- Birmingham-Hoover, AL
- Population (ZIP)
- 43,903
- Household income
- $52,793
- Rent vs Own
- Severe rent burden
- 1729.0
Population outlook (Jefferson County) Hauer SSP2
- Today (2025)
- 669,185 people
- By 2030
- 669,694 · +0.1%
- By 2040
- 661,388 · -1.2%
- By 2050
- 643,086 · -3.9%
- By 2075
- 577,267 · -13.7%
- By 2100
- 474,758 · -29.1%
Race, ethnicity, and origin ACS 2023
- Neighborhood character
- Predominantly Black (75%)
- Race & ethnicity
- Black 75% White 15% Hispanic / Latino 7% Two or more races 3%
- Hispanic origin (detail)
- Mexican 4%
- Common ancestry
- Lithuanian 1% Italian 1% Slovak 1%
- Foreign-born
- 4% · Canada
- Languages at home
- 92% English-only · Spanish 7%
Political lean MEDSL · Jefferson
- 2024 margin
- D (+10.4) · D 54.6% · R 44.2% · Other 1.2%
- 2008→2024 swing
- +5.4pp toward D · 2008: 5.1pp · 2024: 10.4pp
- All cycles
- 2024: D+10.4 2020: D+13.2 2016: D+7.2 2012: D+6.0 2008: D+5.1
Not yet ingested
- Civics
- —
Market trends
- HPI YoY
- ▼ -112.97%
- Current HPI
- 215.0607
- Rent YoY
- ▲ 3.04%
- Metro
- Birmingham-Hoover, AL
- State GDP YoY
- ▲ 2.94%
- F500 in state
- 4
Industry mix (Fortune 500 HQ in AL)
| Industry | F500 HQs | Revenue |
|---|---|---|
| Financial Services | 1 | $8B |
|
||
| Healthcare | 1 | $5B |
|
||
Price history
+229.8% since first listed6 events — show timeline
- 2026-06-15 Pending — Greater Alabama MLS
- 2026-05-22 Listed $103,900 Greater Alabama MLS
- 2022-03-21 Price Changed $1,150 RENT.
- 2022-03-17 Price Changed $1,150 RENT.
- 2021-05-18 Sold (Public Records) $7,237,964 Public Records
- 1978-12-08 Sold (Public Records) $31,500 Public Records
Property tax history
+3.3%/yrLatest (2025): $1,407 · +15.8% YoY. Source: county tax records.
Cash-flow waterfall
monthlySold comps — $/sqft
last 12 mo · ≤1 miLoading sold comps…