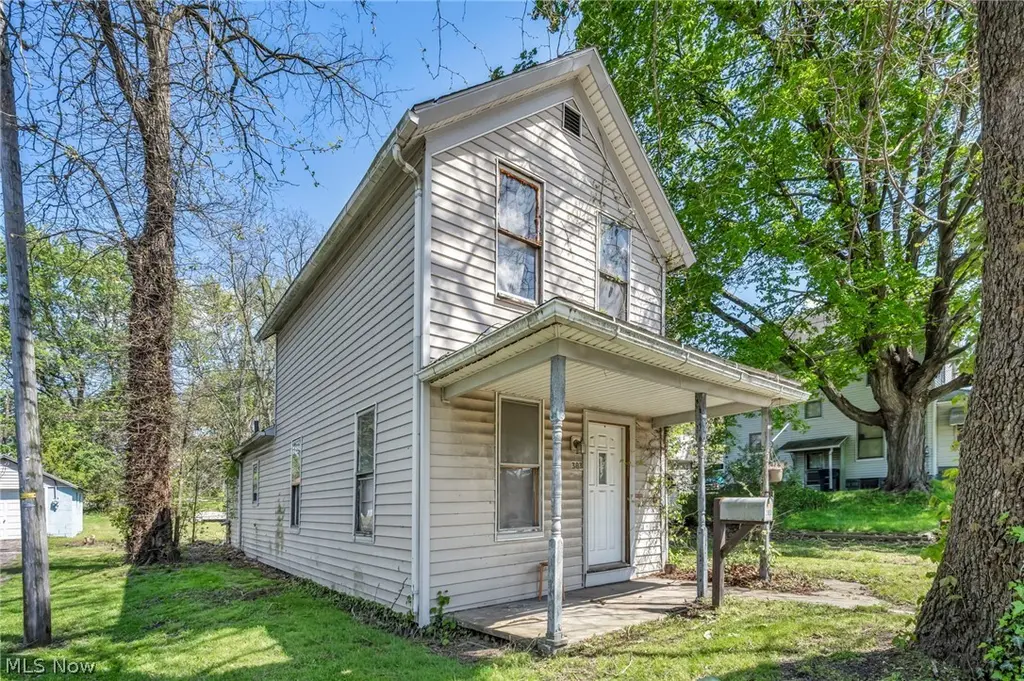
383 N Arlington St · Akron, OH
Flood risk 1/10 · Minimal
- FEMA flood zone
- X (unshaded)
- Chance of flooding over 30 yrs
- 0.0%
- Est. flood insurance / yr
- $473 – $860
Fire risk 1/10 · Minimal
- Est. fire insurance / yr
- $713 – $1,323
Heat risk 3/10 · Minor
- Hot days now (above 97°F)
- 7 days/yr
- Hot days in 30 yrs
- 17 days/yr
Wind risk 1/10 · Minimal
- Chance of severe wind over 30 yrs
- —
Air-quality risk 3/10 · Minor
- Unhealthy air days now
- 2 days/yr
- Unhealthy air days in 30 yrs
- 4 days/yr
Risk factors via First Street. Map © Google.
Why this score? — see what drove the B+ grade
The composite is a weighted blend of 9 inputs, each scored 0–100. Each bar is that input's sub-score; the figure is the points it added to the 100-point composite (weight × sub-score).
- Cash flow +30.0/30.0
- ARV discount +13.7/15.0
- 1% rule +10.0/10.0
- DSCR +10.0/10.0
- Livability +4.0/5.0
- Rent growth +3.6/5.0
- Condition / age +2.5/5.0
- Schools +2.1/10.0
- Appreciation +0.0/10.0
$59,900
🖨 Deal sheet 📄 Offer letter ✓ Due diligence
Listing remarks
Attention investors! 383 N Arlington St in Akron is a prime value-add opportunity ready for your next project. This 2-bedroom, 1-bath home offers a functional layout and strong potential for a straightforward renovation. The property does need work, making it an ideal candidate for the Buy, Rehab, Rent, Refinance, Repeat strategy or a profitable fix-and-flip. With market rents around $1,000/month, there’s solid potential for steady cash flow once updates are complete. For flippers, the manageable scope and value-add upside create an opportunity to renovate and resell for profit. Affordable entry point, proven rental demand, and multiple exit strategies make this a smart addition to an
Key facts
- 7,139 sq ft lot
- Built 1883
- Listed 42 days
Property features AI
Exterior
- Parking: Open parking (unpaved)
- Utilities: Public water; Public sewer
- Home design: 2-story house
- Construction: Shingle roof; Vinyl siding and wood siding
- Exterior features: Open, unpaved parking; Public sewer and public water
Interior
- Kitchen: Kitchen on first floor
- Bedrooms: Bedroom on second floor (one pictured; home has multiple rooms)
- Bathrooms: 1 full bathroom (main level)
- Heating & cooling: Central air conditioning; Forced air heating (gas)
- Interior features: Full basement
Neighborhood map
What this means for you Summary
Snapshot
- This is a 2-bed/1.0-bath single-family listed at $60k.
Deal economics
- At list price, monthly cash flow is $412 ($5k/yr) — positive.
- The deal already cash-flows at list — no discount required.
- Meets the 1% rule at list price ($1k rent vs $60k).
- Recommended offer: $58k (3.0% below list) — sets the bar for market timing.
- Cap rate 14.5% vs local median 6.6% in Akron — top-decile yield for the area; either an underpriced asset or a hidden risk that comps aren't pricing in. Stress-test before assuming the spread holds.
Location & tenants
- Location reads 81/100 on livability (#104 in OH, #1,591 nationally) — a professional / high-income tenant draw. Strengths: amenities A+, commute A+, cost of living A+; Watch: crime F, employment F.
- Akron City (urban): math 22% / reading 30% proficiency, ranked #602 of 656 in OH (top 92%) — low school quality limits family demand, transient renter base, plan for 1-2y turnover; 66% free/reduced lunch — lower-income household profile, screen leases tightly.
- Market conditions: Rents rising fast (+4.5%/yr); 101 active listings in the ZIP; 37 comparable units currently listed for rent nearby; rentals lingering (median 44d on market — plan ~5-8 weeks vacancy on turnover, expect pricing pressure); 57% of comp listings sitting > 30 days — soft ceiling on asking rent; 1,114 units permitted in Summit County in 2024 (397 in 5+ unit buildings).
Forward outlook
- Local home prices are declining (-3.0%/yr); year-one equity from $414 of loan paydown is wiped out by about $2k of value loss. Plan a longer hold.
- Summit County population projected to shrink 6% by 2050 — rents likely to lag national; underwrite the cash flow, not the appreciation.
- At projected returns (-3.0% appreciation + 4.5% rent growth), your $17k cash investment doubles in ~4 years — after that, you're playing with house money.
Negotiation context
- It's been on market 42 days — a 3% lower offer ($58k) is reasonable based on typical stale-listing flexibility.
- Current owner paid $8k; list at $60k implies a 699% gain — meaningful room to come down on a strong offer.
Risks & watch-outs
- Watch-outs: built in 1883 — expect roof / HVAC / electrical / plumbing capex.
Questions for the listing agent
- It's been on market 42 days. Have you received any prior offers? Is the seller open to a 3% concession, seller financing, or rate buy-down credit?
- Built in 1883 — when were the roof, HVAC, electrical panel, plumbing, and water heater last replaced?
- Is there a deadline driving the sale (1031 exchange, divorce, estate, relocation)? That informs how much negotiation room exists.
- Crime grade is F in this area — have there been break-ins, vandalism, or insurance claims at this property in the last 3 years? What carrier currently insures it and at what premium?
- What's the average days-on-market for RENTAL listings here right now (not sales)? A rising rental-DOM trend means longer vacancies and softer asking-rent achievability than the comps imply.
- What's the recent tenant-quality profile in this submarket — average credit score on applications, eviction rate, late-payment / NSF rate, and stable-employment percentage? A property-management company in the area should have these aggregated.
- How much new for-sale + rental construction is in the pipeline within 1–3 miles? Heavy new supply typically softens prices + rents 12–24 months out; constrained supply supports both.
Investment metrics
- 1% rule
- 1.79% ✓
- Cap rate
- 14.55%
- Cash-on-cash
- 29.47%
- DSCR
- 2.31
- GRM
- 4.7
CMA / ARV
- ARV (median comp)
- $69,422
- List price
- $59,900
- Delta
- -13.72%
- Verdict
- UNDERPRICED
- Comps
- 20 within 1.0 mi
Show comp detail 12 sales within ~0.75 mi
| Address | Dist | Beds/Ba | Sqft | Sold | Price | $/sf | Match |
|---|---|---|---|---|---|---|---|
| 177 Spellman Ct | 0.19mi | 3/1.0 (+1) | 897 (-2%) | 13mo | $67,450 | $75 | 73 |
| 767 Upson St | 0.20mi | 2/1.0 | 980 (+8%) | 9mo | $65,000 | $66 | 70 |
| 143 Roswell St | 0.57mi | 2/1.0 | 912 (0%) | 14mo | $60,000 | $66 | 62 |
| 789 Upson St | 0.19mi | 2/1.0 | 1,024 (+12%) | 12mo | $63,050 | $62 | 61 |
| 879 Lorain St | 0.05mi | 3/1.0 (+1) | 800 (-12%) | 14mo | $103,000 | $129 | 61 |
| 1102 Tonawanda Ave | 0.62mi | 3/1.0 (+1) | 960 (+5%) | 1mo | $97,000 | $101 | 56 |
| 1177 Smithfarm Ave | 0.68mi | 2/1.0 | 992 (+9%) | 2mo | $113,000 | $114 | 52 |
| 1181 Grandview Ave | 0.61mi | 3/1.0 (+1) | 888 (-3%) | 13mo | $40,000 | $45 | 51 |
| 691 Gardendale Ave | 0.63mi | 3/1.0 (+1) | 960 (+5%) | 9mo | $95,000 | $99 | 49 |
| 643 Villa Ave | 0.74mi | 2/2.0 | 912 (0%) | 15mo | $165,000 | $181 | 48 |
| 617 Sanford Ave | 0.71mi | 2/1.0 | 864 (-5%) | 12mo | $133,000 | $154 | 48 |
| 1140 Arnold Ave | 0.58mi | 3/2.0 (+1) | 974 (+7%) | 18mo | $65,000 | $67 | 37 |
Match score weights: distance 35% · size 25% · config 20% · recency 20%. Top-matched comps best support the ARV.
Projected returns pro-forma
-3.0% appreciation · 4.51% rent growth · sell at horizon
- IRR
- 25.7%
- Equity multiple
- 2.09×
- Total profit
- $18,212
- Equity at exit
- $8,931
- IRR
- 34.4%
- Equity multiple
- 4.38×
- Total profit
- $56,758
- Equity at exit
- $5,179
Cash invested: $16,772 (down + closing). Projections, not guarantees.
Landlord ↔ Tenant lean methodology
- Overall (STATE)
- 73 Landlord-Friendly
- State Ohio
- 73 Landlord-Friendly · R+6
- County
- — inherits STATE
- City
- — inherits STATE
ZIP-level market 44305
- Rents YoY
- 4.5%
- Active inventory
- 101
- Price-to-rent
- 4.7×
Monthly cashflow live
- Estimated rent
- $1,072 high interval (Pro) →
- Mortgage (P&I)
- −$314
- Tax from tax record
- −$96 /mo · $1,153/yr
- Insurance
- −$25
- HOA
- −$0
- Vacancy / Maint / Mgmt
- −$225
- Net cashflow
- $412
Break-even live
UW: 25.0% down · 7.5% · 30yr · 1.5% tax · 5.0% vac · 8.0% maint · 8.0% mgmt
Financing live
Cash to close
- Down payment
- $14,975
- Closing costs
- $1,797
- Reserves months
- —
- Total cash needed
- —
Loan-product check · same deal, 3 products live
Conventional
25% down · 7.5% · 30yr
- Down + closing
- —
- Monthly P&I
- —
- Monthly cashflow
- —
- DSCR
- —
- Eligible?
- —
Personal DTI + credit; lowest rate.
DSCR
20% down · 8.5% · 30yr
- Down + closing
- —
- Monthly P&I
- —
- Monthly cashflow
- —
- DSCR
- —
- Eligible?
- —
No personal income docs; deal must DSCR.
Hard money
10% down · 12.0% · 12mo
- Down + closing
- —
- Monthly P&I
- —
- Monthly cashflow
- —
- DSCR
- —
- Eligible?
- —
Short-term bridge; refi at stabilization.
Rent comps 37 comps
| Address | Beds | Baths | Sqft | Rent | $/sqft | DOM | Units | Dist |
|---|---|---|---|---|---|---|---|---|
| 134 N Arlington St Akron, OH | 2.0 | 1.0 | 964 | $900 | $0.93 | 23d | 1 | 0.48mi |
| 1190 Hazel St Akron, OH | 3.0 | 1.0 | 1124 | $1,425 | $1.27 | 43d | 1 | 0.54mi |
| 680 Grifton Ave Akron, OH | 2.0 | 1.0 | 828 | $1,050 | $1.27 | 23d | 1 | 0.60mi |
| 797 E Market St Apt 220 Akron, OH | 2.0 | 1.5 | 1100 | $1,500 | $1.36 | 23d | 1 | 0.60mi |
| 797 E Market St Apt 209 Akron, OH | 1.0 | 1.0 | 600 | $1,350 | $2.25 | 23d | 1 | 0.60mi |
| 676 Grifton Ave Akron, OH | 2.0 | 1.0 | 703 | $1,000 | $1.42 | 43d | 1 | 0.60mi |
| 605 E Buchtel Ave Unit 1 Akron, OH | 2.0 | 1.0 | 1000 | $695 | $0.69 | 14d | 1 | 0.66mi |
| 109 Kent Ct Akron, OH | 2.0 | 1.0 | 1032 | $1,142 | $1.11 | 23d | 1 | 0.67mi |
| 590 E Buchtel Ave Akron, OH | 1.0 | 1.0 | 600 | $679 | $1.13 | 43d | 1 | 0.71mi |
| 545 E Buchtel Ave Unit 1 Akron, OH | 2.0 | 1.0 | 900 | $1,300 | $1.44 | 43d | 1 | 0.75mi |
| 545 E Buchtel Ave Apt 3 Akron, OH | 1.0 | 1.0 | 700 | $1,200 | $1.71 | 23d | 1 | 0.75mi |
| 801 E Exchange St Akron, OH | 2.0 | 1.0 | 850 | $925 | $1.09 | 23d | 1 | 0.84mi |
| 783 E Exchange St Unit 2nd Akron, OH | 2.0 | 1.0 | 951 | $875 | $0.92 | 23d | 1 | 0.85mi |
| 1318 Arnold Ave Akron, OH | 3.0 | 1.0 | 1056 | $1,450 | $1.37 | 43d | 1 | 0.90mi |
| 857 Kennebec Ave Akron, OH | 3.0 | 1.0 | 1008 | $1,350 | $1.34 | 44d | 1 | 0.92mi |
| 208 Barder Ave Akron, OH | 3.0 | 1.0 | 924 | $1,050 | $1.14 | 43d | 1 | 1.10mi |
| 344 Lease St Akron, OH | 3.0 | 1.0 | 1000 | $1,199 | $1.20 | 43d | 1 | 1.12mi |
| 237 Kryder Ave Unit 237 Akron, OH | 2.0 | 1.0 | 860 | $850 | $0.99 | 44d | 1 | 1.15mi |
| 166 Chittenden St Akron, OH | 3.0 | 1.0 | 1020 | $985 | $0.97 | 43d | 1 | 1.18mi |
| 167 Chittenden St #1 Akron, OH | 2.0 | 1.0 | 900 | $850 | $0.94 | 43d | 1 | 1.18mi |
| 167 Chittenden St Apt 2 Akron, OH | 2.0 | 1.0 | 900 | $825 | $0.92 | 43d | 1 | 1.18mi |
| 167 Chittenden St Unit 3 Akron, OH | 1.0 | 1.0 | 575 | $700 | $1.22 | 43d | 1 | 1.18mi |
| 878 Clark St Akron, OH | 3.0 | 2.0 | 1029 | $1,440 | $1.40 | 43d | 1 | 1.27mi |
| 1044 Brittain Rd Unit 1050 Akron, OH | 1.0 | 1.0 | 700 | $785 | $1.12 | 43d | 1 | 1.33mi |
| 1050 Brittain Rd Akron, OH | 1.0 | 1.0 | 700 | $785 | $1.12 | 43d | 1 | 1.33mi |
| 461 Spicer St Akron, OH | 3.0 | 2.0 | 1000 | $995 | $0.99 | 43d | 1 | 1.35mi |
| 467 Spicer St Akron, OH | 2.0 | 1.0 | 800 | $915 | $1.14 | 23d | 1 | 1.35mi |
| 500 Delmar Ave Unit 502 Akron, OH | 2.0 | 1.0 | 1000 | $775 | $0.78 | 23d | 1 | 1.36mi |
| 106 Charles St Akron, OH | 2.0 | 1.0 | 800 | $850 | $1.06 | 43d | 1 | 1.37mi |
| 420 Power St Akron, OH | 3.0 | 1.0 | 900 | $800 | $0.89 | 23d | 1 | 1.40mi |
| 418 Power St Akron, OH | 3.0 | 1.0 | 1000 | $999 | $1.00 | 23d | 1 | 1.41mi |
| 484 Hammel St Akron, OH | 2.0 | 1.0 | 792 | $1,100 | $1.39 | 43d | 1 | 1.43mi |
| 287 Wheeler St Akron, OH | 3.0 | 1.0 | 1100 | $1,350 | $1.23 | 23d | 1 | 1.44mi |
| 377 Talbot Ave Akron, OH | 2.0 | 1.0 | 1070 | $1,050 | $0.98 | 43d | 1 | 1.45mi |
| 1428 Sara Ave Akron, OH | 2.0 | 1.0 | 1080 | $1,050 | $0.97 | 14d | 1 | 1.46mi |
| 421 Allyn St Unit 2 Akron, OH | 3.0 | 1.0 | 743 | $850 | $1.14 | 43d | 1 | 1.46mi |
| 406 Sumner St Akron, OH | 2.0–4.0 | 1.0–2.0 | 836 | $875 | $1.05 | 14d | 3 | 1.50mi |
Listing history 19 events
-
2026-06-18days on market $59,900 Active 42 DOM
-
2026-06-17days on market $59,900 Active 41 DOM
-
2026-06-16days on market $59,900 Active 40 DOM
-
2026-06-15days on market $59,900 Active 39 DOM
-
2026-06-14days on market $59,900 Active 37 DOM
-
2026-06-13days on market $59,900 Active 36 DOM
-
2026-06-10days on market $59,900 Active 34 DOM
-
2026-06-09days on market $59,900 Active 33 DOM
-
2026-06-08days on market $59,900 Active 32 DOM
-
2026-06-07pricedays on market $59,900 Active 31 DOM
-
2026-06-05days on market $64,900 Active 28 DOM
-
2026-06-03days on market $64,900 Active 27 DOM
-
2026-06-02days on market $64,900 Active 26 DOM
-
2026-06-01days on market $64,900 Active 25 DOM
-
2026-05-31days on market $64,900 Active 24 DOM
-
2026-05-31days on market $64,900 Active 23 DOM
-
2026-05-07$64,900 Active 978-char remark
-
1998-08-31soldstatus $7,500
-
1998-08-31soldstatus $7,500
ⓘ Source: listings_history table (triggers on properties + properties_extension) + one-shot
backfill from property_details.listing_events for pre-trigger history.
Tax reassessment forecast OH · Partial reset (capped growth)
- Current annual tax
- $1,153 · $96/mo
- Projected year-2 tax
- $1,153 · $96/mo
- Expected delta
- $0/yr ($0/mo · 0.0%)
ⓘ Screening estimate from a state-policy table — verify with the county assessor before closing.
Climate risk First Street
- Flood 1/10 Low FEMA zone X (unshaded) · 0% chance over 30 yrs
- Wildfire 1/10 Low
- Heat 3/10 Moderate 7 d/yr ≥97°F today · 17 d/yr by 30 yrs out
- Wind 1/10 Low
- Air quality 3/10 Moderate 2 unhealthy d/yr today · 4 by 30 yrs out
Nearby sold comps map
Loading sold comps map…
Walkable amenities ~0.75 mi
Loading nearby amenities…
Taxation est. · year 1
- Rental income
- $12,867
- − Mortgage interest
- −$3,355
- − Property taxes
- −$1,153
- − Insurance
- −$300
- − Repairs & maintenance
- −$1,029
- − Management
- −$1,029
- − Depreciation
- −$1,743
- Taxable income
- $4,258
- Est. tax owed @ 24.0%
- −$1,022
- After-tax cash flow
- $3,921/yr
For passive investors: Depreciation is non-cash, so a rental often shows a tax loss while cash-flowing — sheltering income. Rental losses are passive: they offset passive income freely, and up to $25,000/yr can offset ordinary (W-2) income if you actively participate and your MAGI is under $100k (phasing out to $0 by $150k); unused losses carry forward. On sale, claimed depreciation is recaptured at up to 25%, and gains may owe capital-gains tax (a 1031 exchange can defer both). Figures are a year-1 estimate at your 24.0% rate — not tax advice; consult a CPA.
Schools (NCES district)
- District
- Akron City
- NCES district ID
- 3904348
- Math proficiency
- 22% ▼ -17.00%
- Reading proficiency
- 30% ▼ -12.00%
- Median HH income
- $33,811
- Composite
- 21.31/100
- National rank
- #8383
- State rank
- #602 of 656 in OH
Livability — Akron
- Score
- 81/100
- State rank
- #104
- US rank
- #1591
Category grades
Schools grade is shown separately in the Schools card above.
Census & demographics
- Census place
- Akron, OH
- County
- Summit County · 440,783 people
- City population
- 174,375
- Metro
- Akron, OH
- Population (ZIP)
- 21,103
- Household income
- $52,768
- Rent vs Own
- Severe rent burden
- 1021.0
Population outlook (Summit County) Hauer SSP2
- Today (2025)
- 546,583 people
- By 2030
- 544,028 · -0.5%
- By 2040
- 531,363 · -2.8%
- By 2050
- 514,923 · -5.8%
- By 2075
- 481,765 · -11.9%
- By 2100
- 432,265 · -20.9%
Race, ethnicity, and origin ACS 2023
- Neighborhood character
- Diverse neighborhood (Simpson 0.57)
- Race & ethnicity
- White 62% Black 20% Two or more races 12% Asian 5% Hispanic / Latino 2%
- Common ancestry
- Lithuanian 3% Slovak 2% Romanian 2%
- Foreign-born
- 4% · India, Philippines, Canada
- Languages at home
- 94% English-only · Other Asian/Pacific 3% Other Indo-European 1% Spanish 1%
Political lean MEDSL · Summit
- 2024 margin
- Lean D (+7.0) · D 53.0% · R 46.0%
- 2008→2024 swing
- -9.6pp toward R · 2008: 16.6pp · 2024: 7.0pp
- All cycles
- 2024: D+7.0 2020: D+9.6 2016: D+8.2 2012: D+14.8 2008: D+16.6
Not yet ingested
- Civics
- —
Market trends
- HPI YoY
- ▼ -140.39%
- Current HPI
- 190.6223
- Rent YoY
- ▲ 4.51%
- Metro
- Akron, OH
- State GDP YoY
- ▲ 1.98%
- F500 in state
- 48
Industry mix (Fortune 500 HQ in OH)
| Industry | F500 HQs | Revenue |
|---|---|---|
| Insurance | 3 | $145B |
|
||
| Industrial Machinery | 3 | $49B |
|
||
| Financial Services | 3 | $24B |
|
||
| Consumer Goods | 2 | $93B |
|
||
| Aerospace / Defense | 2 | $47B |
|
||
| Utilities | 2 | $33B |
|
||
Price history
+698.7% since first listed4 events — show timeline
- 2026-06-05 Price Changed $59,900 MLSNOW
- 2026-05-07 Listed $64,900 MLSNOW
- 1998-08-31 Sold (Public Records) $7,500 Public Records
- 1998-08-31 Sold (Public Records) $7,500 Public Records
Property tax history
+3.6%/yrLatest (2025): $1,153 · +14.7% YoY. Source: county tax records.
Cash-flow waterfall
monthlySold comps — $/sqft
last 12 mo · ≤1 miLoading sold comps…