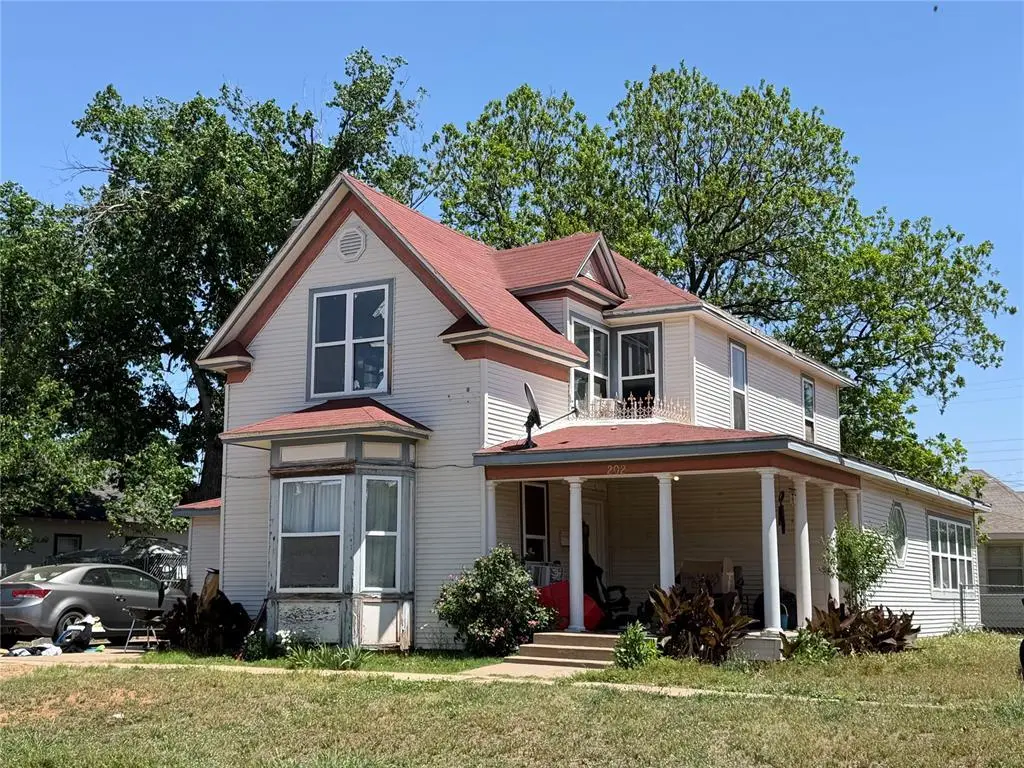
202 N Randlett St · Hobart, OK
Flood risk No data
- FEMA flood zone
- —
- Chance of flooding over 30 yrs
- —
- Est. flood insurance / yr
- —
Fire risk No data
- Est. fire insurance / yr
- —
Heat risk No data
- Hot days now (above threshold)
- —
- Hot days in 30 yrs
- —
Wind risk No data
- Chance of severe wind over 30 yrs
- —
Air-quality risk No data
- Unhealthy air days now
- —
- Unhealthy air days in 30 yrs
- —
Risk factors via First Street. Map © Google.
Why this score? — see what drove the B+ grade
The composite is a weighted blend of 9 inputs, each scored 0–100. Each bar is that input's sub-score; the figure is the points it added to the 100-point composite (weight × sub-score).
- Cash flow +30.0/30.0
- 1% rule +10.0/10.0
- DSCR +10.0/10.0
- Appreciation +10.0/10.0
- ARV discount +7.5/15.0
- Livability +2.7/5.0
- Rent growth +2.5/5.0
- Condition / age +2.5/5.0
- Schools +2.1/10.0
$79,000
🖨 Deal sheet (PDF) 📄 Offer letter ✓ Due diligence
Listing remarks MLS
Calling all investors! This home is located right in the heart of Hobart. Currently being rented at $600 a month. This is a package deal consisting of 9 properties. MLS #s : 1118783, 1118781, 1118778, 1118775, 1118774, 1118773, 1118771, 1118765, 1118755. Total price for all 9 properties $220K
Key facts
- Covered front porch
- Large kitchen
- Corner lot
Tags
Property features AI
Finance
- Other: Living area reported as 2,849 (assessor); Corner lot legal addition: Lambs; Directions: Head West on Iris. Turn North on Randlett. House is on the east side on the corner of Iris and Randlett.
- Financial info: Loan qualification available; Property is leased; Occupied
- HOA & community: No mandatory association dues
Exterior
- Parking: Concrete parking
- Security: Storm shelter (other type)
- Utilities: Homestead not claimed
- Home design: Single family residence; Residential property; Two-level home; Existing property
- Construction: Frame construction; Composition roof; Conventional foundation; Built (existing)
- Exterior features: Covered porch; Exterior storage; Corner lot
Interior
- Bedrooms: 4 bedrooms
- Bathrooms: 2 full bathrooms
- Interior features: Two living areas; Formal dining area; Study/office; One fireplace
Neighborhood map
What this means for you Summary
Snapshot
- This is a 4-bed/2.0-bath single-family listed at $79k.
Deal economics
- At list price, monthly cash flow is $585 ($7k/yr) — positive.
- The deal already cash-flows at list — no discount required.
- Meets the 1% rule at list price ($1k rent vs $79k).
- Recommended offer: $78k (1.5% below list) — sets the bar for market timing.
- Cap rate 15.2% vs local median 8.7% in Hobart — top-decile yield for the area; either an underpriced asset or a hidden risk that comps aren't pricing in. Stress-test before assuming the spread holds.
Location & tenants
- Location reads 53/100 on livability (#627 in OK) — a working-class tenant base; expect higher turnover. Strengths: cost of living A+; Watch: crime D+, amenities F, commute F.
- Hobart (town): math 23% / reading 28% proficiency, ranked #110 of 270 in OK (top 41%) — low school quality limits family demand, transient renter base, plan for 1-2y turnover; 63% free/reduced lunch — lower-income household profile, screen leases tightly.
- Zoned schools: Hobart Es (math 32% / reading 27%, grade F, #255 of 845 statewide, top 35%, 366 students, 0% FRL); Hobart Hs (math 5% / reading 24%, grade F, #332 of 447 statewide, top 78%, 197 students, 0% FRL) — zoned schools average 0% FRL vs 63% district-wide (63 pts lower); this property's tenant base skews higher-income than the district average.
- Market conditions: 54 active listings in the ZIP.
Forward outlook
- In year one you build about $8k of equity ($546 loan paydown + $8k appreciation (10.0% local appreciation)).
- At projected returns (10.0% appreciation + 3.0% rent growth), your $22k cash investment doubles in ~2 years — after that, you're playing with house money.
- By year 5, paydown + projected appreciation supports a ~$39k cash-out refi (75% LTV) — recoverable capital for the next deal without selling this one.
Negotiation context
- It's been on market 15 days — a 2% lower offer ($78k) is reasonable based on typical stale-listing flexibility.
- 2 sale attempts since 2y ago with the ask held roughly flat each time — persistent listings suggest the price (not the market) is what's stuck; bring a comps-based counter.
- Current owner paid $56k; 42% above their basis — modest negotiation headroom, anchor on the comps not their cost.
Risks & watch-outs
- Watch-outs: built in 1918 — expect roof / HVAC / electrical / plumbing capex.
Questions for the listing agent
- Built in 1918 — when were the roof, HVAC, electrical panel, plumbing, and water heater last replaced?
- Is there a deadline driving the sale (1031 exchange, divorce, estate, relocation)? That informs how much negotiation room exists.
- Schools are F-rated, which usually means shorter tenancies and higher turnover. Who's the typical renter profile here, and what's been the actual vacancy rate?
- Crime grade is D in this area — have there been break-ins, vandalism, or insurance claims at this property in the last 3 years? What carrier currently insures it and at what premium?
- What's the average days-on-market for RENTAL listings here right now (not sales)? A rising rental-DOM trend means longer vacancies and softer asking-rent achievability than the comps imply.
- What's the recent tenant-quality profile in this submarket — average credit score on applications, eviction rate, late-payment / NSF rate, and stable-employment percentage? A property-management company in the area should have these aggregated.
- How much new for-sale + rental construction is in the pipeline within 1–3 miles? Heavy new supply typically softens prices + rents 12–24 months out; constrained supply supports both.
Investment metrics
- 1% rule
- 1.83% ✓
- Cap rate
- 15.19%
- Cash-on-cash
- 31.76%
- DSCR
- 2.41
- GRM
- 4.6
CMA / ARV
- ARV (on-the-fly)
- $185,185
- Comps found
- 8
Show comp detail 8 sales within ~0.75 mi
| Address | Dist | Beds/Ba | Sqft | Sold | Price | $/sf | Match |
|---|---|---|---|---|---|---|---|
| 107 S Broadway Ave | 0.15mi | 4/2.0 | 2,871 (+1%) | 7mo | $58,000 | $20 | 85 |
| 202 N Randlett St | 0.00mi | 4/2.0 | 2,849 (0%) | 20mo | $55,666 | $20 | 83 |
| 115 N Randlett St | 0.05mi | 5/2.5 (+1) | 2,899 (+2%) | 14mo | $187,000 | $65 | 77 |
| 423 N Lowe St | 0.25mi | 5/3.0 (+1) | 2,820 (-1%) | 5mo | $75,100 | $27 | 74 |
| 510 Terrace Dr | 0.36mi | 4/3.0 | 3,208 (+13%) | 4mo | $255,000 | $79 | 54 |
| 107 Gaynelle Ln | 0.52mi | 3/2.5 (-1) | 2,716 (-5%) | 19mo | $215,000 | $79 | 45 |
| 605 Terrace Dr | 0.45mi | 3/3.0 (-1) | 2,631 (-8%) | 21mo | $240,000 | $91 | 40 |
| 430 N Stephens St | 0.36mi | 3/2.5 (-1) | 2,438 (-14%) | 24mo | $144,000 | $59 | 32 |
Match score weights: distance 35% · size 25% · config 20% · recency 20%. Top-matched comps best support the ARV.
Projected returns pro-forma
10.0% appreciation · 3.0% rent growth · sell at horizon
- IRR
- 48.5%
- Equity multiple
- 4.63×
- Total profit
- $80,340
- Equity at exit
- $71,169
- IRR
- 42.3%
- Equity multiple
- 10.37×
- Total profit
- $207,321
- Equity at exit
- $153,480
Cash invested: $22,120 (down + closing). Projections, not guarantees.
Landlord ↔ Tenant lean methodology
- Overall (STATE)
- 83 Strongly Landlord-Friendly
- State Oklahoma
- 83 Strongly Landlord-Friendly · R+20
- County
- — inherits STATE
- City
- — inherits STATE
ZIP-level market 73651
- Home prices YoY
- 8.0%
- Active inventory
- 54
- Price-to-rent
- 4.6×
Monthly cashflow live
- Estimated rent
- $1,444 medium interval (Pro) →
- Mortgage (P&I)
- −$414
- Tax from tax record
- −$108 /mo · $1,300/yr
- Insurance
- −$33
- HOA
- −$0
- Vacancy / Maint / Mgmt
- −$303
- Net cashflow
- $585
Break-even live
Sensitivity live
| Price | -10% $630 | -5% $608 | +0% $585 | +5% $563 | +10% $541 |
|---|---|---|---|---|---|
| Rent | -10% $471 | -5% $528 | +0% $585 | +5% $642 | +10% $700 |
| Rate | -1.0pp $625 | -0.5pp $606 | base $585 | +0.5pp $565 | +1.0pp $544 |
UW: 25.0% down · 7.5% · 30yr · 1.5% tax · 5.0% vac · 8.0% maint · 8.0% mgmt
Financing live
Cash to close
- Down payment
- $19,750
- Closing costs
- $2,370
- Reserves months
- —
- Total cash needed
- —
Loan-product check · same deal, 3 products live
Conventional
25% down · 7.5% · 30yr
- Down + closing
- —
- Monthly P&I
- —
- Monthly cashflow
- —
- DSCR
- —
- Eligible?
- —
Personal DTI + credit; lowest rate.
DSCR
20% down · 8.5% · 30yr
- Down + closing
- —
- Monthly P&I
- —
- Monthly cashflow
- —
- DSCR
- —
- Eligible?
- —
No personal income docs; deal must DSCR.
Hard money
10% down · 12.0% · 12mo
- Down + closing
- —
- Monthly P&I
- —
- Monthly cashflow
- —
- DSCR
- —
- Eligible?
- —
Short-term bridge; refi at stabilization.
Listing history 12 events
-
2026-06-21days on market $79,000 Active 15 DOM
-
2026-06-18days on market $79,000 Active 13 DOM
-
2026-06-17days on market $79,000 Active 12 DOM
-
2026-06-16days on market $79,000 Active 11 DOM
-
2026-06-15days on market $79,000 Active 10 DOM
-
2026-06-13days on market $79,000 Active 8 DOM
-
2026-06-12remarks 595-char remark
-
2026-06-12days on market $79,000 Active 7 DOM
-
2026-06-09days on market $79,000 Active 4 DOM
-
2026-06-08days on market $79,000 Active 3 DOM
-
2026-06-08remarks 497-char remark
-
2026-06-08$79,000 Active 2 DOM
ⓘ Source: listings_history table (triggers on properties + properties_extension) + one-shot
backfill from property_details.listing_events for pre-trigger history.
Tax reassessment forecast OK · Resets to sale price
- Current annual tax
- $1,300 · $108/mo
- Projected year-2 tax
- $1,300 · $108/mo
- Expected delta
- $0/yr ($0/mo · 0.0%)
ⓘ Screening estimate from a state-policy table — verify with the county assessor before closing.
Nearby sold comps map
Loading sold comps map…
Walkable amenities ~0.75 mi
Loading nearby amenities…
Taxation est. · year 1
- Rental income
- $17,331
- − Mortgage interest
- −$4,425
- − Property taxes
- −$1,300
- − Insurance
- −$395
- − Repairs & maintenance
- −$1,386
- − Management
- −$1,386
- − Depreciation
- −$2,298
- Taxable income
- $6,140
- Est. tax owed @ 24.0%
- −$1,474
- After-tax cash flow
- $5,552/yr
For passive investors: Depreciation is non-cash, so a rental often shows a tax loss while cash-flowing — sheltering income. Rental losses are passive: they offset passive income freely, and up to $25,000/yr can offset ordinary (W-2) income if you actively participate and your MAGI is under $100k (phasing out to $0 by $150k); unused losses carry forward. On sale, claimed depreciation is recaptured at up to 25%, and gains may owe capital-gains tax (a 1031 exchange can defer both). Figures are a year-1 estimate at your 24.0% rate — not tax advice; consult a CPA.
Schools (NCES district)
- District
- Hobart
- NCES district ID
- 4014700
- Math proficiency
- 23% ▼ -6.00%
- Reading proficiency
- 28% ▼ -8.00%
- Median HH income
- $36,779
- Composite
- 21.2/100
- National rank
- #8417
- State rank
- #110 of 270 in OK
Livability — Hobart
- Score
- 53/100
- State rank
- #627
- US rank
- #24677
Category grades
Schools grade is shown separately in the Schools card above.
Census & demographics
- Census place
- Hobart, OK
- City population
- 4,070
- Population (ZIP)
- 4,070
Population outlook (Kiowa County) Hauer SSP2
- Today (2025)
- 8,842 people
- By 2030
- 8,733 · -1.2%
- By 2040
- 8,641 · -2.3%
- By 2050
- 8,758 · -1.0%
- By 2075
- 9,894 · +11.9%
- By 2100
- 11,194 · +26.6%
Race, ethnicity, and origin ACS 2023
- Neighborhood character
- Predominantly White (72%)
- Race & ethnicity
- White 72% Hispanic / Latino 15% Two or more races 10% Black 4% Native American 2%
- Hispanic origin (detail)
- Mexican 13%
- Common ancestry
- Iranian 8% Italian 2% Slovak 1%
- Foreign-born
- 1% · Canada
- Languages at home
- 90% English-only · Spanish 10%
Political lean MEDSL · Kiowa
- 2024 margin
- Solid R (+58.3) · D 20.1% · R 78.4% · Other 1.6%
- 2008→2024 swing
- -23.5pp toward R · 2008: -34.8pp · 2024: -58.3pp
- All cycles
- 2024: R+58.3 2020: R+57.6 2016: R+52.4 2012: R+35.4 2008: R+34.8
Not yet ingested
- Civics
- —
Market trends
- HPI YoY
- ▲ 11.68%
- Current HPI
- 158.6311
- Rent YoY
- —
- Metro
- —
- State GDP YoY
- ▲ 1.55%
- F500 in state
- 6
Industry mix (Fortune 500 HQ in OK)
| Industry | F500 HQs | Revenue |
|---|---|---|
| Energy | 3 | $48B |
|
||
Price history
+33.9% since first listed5 events — show timeline
- 2026-06-05 Listed $79,000 MLSOK
- 2024-10-11 Sold (Public Records) $190,000 Public Records
- 2024-10-11 Sold (MLS) $55,666 MLSOK
- 2024-08-18 Pending — MLSOK
- 2024-06-11 Listed $59,000 MLSOK
Property tax history
+4.0%/yrLatest (2025): $1,300 · +10.4% YoY. Source: county tax records.
Cash-flow waterfall
monthlySold comps — $/sqft
last 12 mo · ≤1 miLoading sold comps…